Trends in the Oil and Gas Industry
Then & Now


You don’t need an expert to tell you that the oil and gas industry has significantly changed over the past three years. Simply looking at crude oil and natural gas prices from 2014 versus today can confirm this. However, understanding how the change in oil prices has affected the value of your oil and gas business is a little more difficult.

Looking Back at the Price Trend
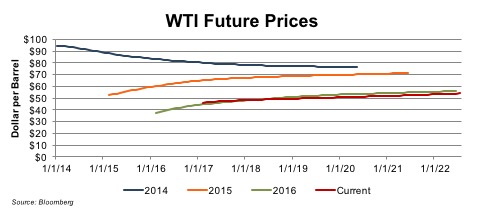
In early 2014, a barrel of oil cost more than twice what it does today. Three years ago the oil and gas industry appeared to be on an upward trend. Industry revenues were expected to increase over the next several years, oil prices (which were holding around $100/barrel) were expected to rise, and futures prices had already jumped, indicating that oil would become more expensive. Some analysts even believed that if the Iraq crisis escalated, crude oil prices could surpass $120/bbl. U.S. production increased, and for the first time in four years, demand in developed nations was expected to increase as well. Although there was concern about political instability in Iraq, due in large part to Al Qaeda activity, many saw 2014 as a “great entry point” into the energy industry. In the Fortune article “Energy Bulls Are Ready for a Run,” Craig Hodges, CEO of Hodges Capital said, “The opportunities are fantastic, and we’re in the very early innings of a renaissance in the energy industry.”
Looking back, we know that the oil and gas narrative strongly deviated from expectations. After peaking at $107.95/barrel on June 22, 2014 oil prices began to spiral downward, ultimately reaching record lows in the first quarter of 2016 at just over $26/barrel. As a result of this price crash, more than 120 upstream and oilfield companies were forced into bankruptcy over the next two years.
Looking Beyond Price
As exemplified by the collapse of oil prices in mid-2014, market shifts can be hard to anticipate. Our professionals closely track trends and events affecting the oil and gas markets, analyzing their value implications. Many focus only on the decline in prices, but countless other factors have also fundamentally changed the industry over the past three years affecting oil and gas valuations. While there are far too many to list in full here, some highlights are included below.
The Export Ban
In December 2015, Congress lifted an export ban that kept all domestic crude oil within the U.S. for the past 40 years (with the exception of exports to Canada). In January 2016, the first shipments of oil left U.S. ports for Europe. Many analysts saw this as “symbolic of the country’s newfound role as a lead producer of oil,” and noted that the U.S. could now serve as a stable supplier in an energy market where many suppliers are located in regions fraught with unrest. This trend has continued by supplying China with significant quantities of crude oil in recent months.
Improved Drilling Technology
Adoption of innovative drilling techniques, such as horizontal drilling and hydraulic fracturing, has made production quicker, easier, and cheaper, while also unlocking reserves that were previously regarded as unattainable. Due in large part to technological advances, U.S. crude oil production has risen 10% since prices began to recover in late 2016. By cutting producer costs, technology allowed producers to continue operations in low price environments, which would have previously forced them to shut down. According to Rystad Energy analysis, “Since 2013, the average wellhead breakeven price (BEP) for key shale plays has dropped from US$80/barrel to US$35/barrel. This represents a decrease of over 55%, on average.”
U.S. Shale
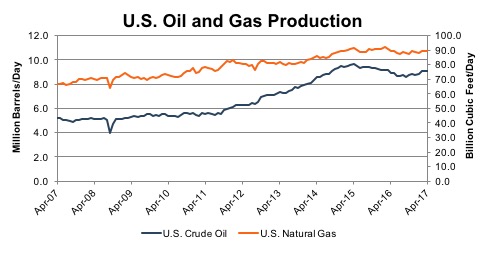
Largely as a result of improved technology, the U.S. Shale Revolution greatly impacted the oil and gas industry. As mentioned above, various drilling technologies unlocked shale plays throughout the U.S., particularly in the Bakken and Marcellus regions. Increased shale production significantly added to the U.S. oil supply, which is expected to be 800 mb/d greater in 2017 than it was in 2016. U.S. shale survived the 2014 oil price crash with cost cuts and lower breakeven prices and emerged more resilient from the downturn. On a global scale, U.S. production gains have essentially counteracted OPEC’s production cuts. Because the breakeven price for many U.S. shale plays has dropped, uncertainty looms regarding how low commodity prices must drop before U.S. producers will scale back production. The following graph shows U.S. oil and gas production over the past ten years.
Political Instability
Many oil and gas suppliers are located in regions fraught with civil and political unrest. In 2014, analysts focused on what impact potential disruptions in Iraqi oil supply, due to Al Qaeda activity, may have on the global market. While no longer centered on Iraq, concerns about political instability persist within the industry. Today, analysts are looking to the Persian Gulf to determine if unrest, particularly in Qatar, will alter the industry’s trajectory.
The simultaneous impact of each of the events discussed here (among countless others) has flipped the oil and gas industry on its head, allowing the U.S. to become more energy independent and to grow its market share. While this is great news for the U.S. from an economic, security, and defense perspective, it is threatening to other countries – notably to historically influential producers like Saudi Arabia and Russia. As the U.S. continues to garner market share, political relationships are due to shift, likely impacting the oil and gas industry.
Implications on Oil and Gas Valuations
Mercer Capital tracks the performance of exploration and production companies across different mineral reserves in order to understand how the current pricing environment affects operators in each region. The dramatic drop in price, by itself, materially impacted the value of all companies operating within the oil and gas industry – upstream, midstream, or downstream. Of 60 companies Mercer Capital tracks in the E&P oil and gas industry, 81% saw their market cap decrease over the past three years, by an average of 26.63% and a median of 46.85%. The graph below shows different regions stock performance over the past three years.
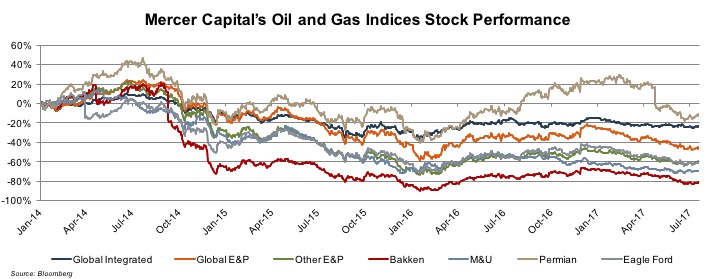
As shown above, as a result of the myriad of changes within the oil and gas industry, company values today are not what they were three years ago. Like many industries, the oil and gas industry not only changes quickly but it also changes dramatically. In order to set a proper context for the valuation, it is crucial to understand the industry climate as of your valuation date. Over the past three years, opening U.S. oil to exports, increasing driller productivity due to gains in technology, and the shale revolution have created an oversupply of oil, which has driven the price of oil down. While our analysts cannot say for certain what’s coming next for this industry, we invite you to follow these trends with us.
Mercer Capital has significant experience valuing assets and companies in the oil and gas industry, primarily oil and gas, bio fuels and other minerals. Our oil and gas valuations have been reviewed and relied on by buyers and sellers and Big 4 Auditors. These oil and gas related valuations have been utilized to support valuations for IRS Estate and Gift Tax, GAAP accounting, and litigation purposes. We have performed oil and gas valuations and associated oil and gas reserves domestically throughout the United States and in foreign countries. Contact a Mercer Capital professional today to discuss your valuation needs in confidence.
Our thanks to Paige Klump who drafted and did much of the research for this post in collaboration with our Energy Group.