Even with Saudi estimations of a 20-million-barrel supply cut, times are tumultuous for the oil and gas industry. News earlier this month was met with no rise in West Texas Intermediate pricing at the time. It hovered around $20.00 per barrel. Last week it fell to the seemingly unconscionable negative territory. It was worse in other places. In Western Canada heavy select oil was around $4.50 per barrel and dropped to $0 last week. It went negative as well.
That was not a typo. (The only beacon of “normalcy” was Brent was still trading above $25 per barrel.)
World demand for oil has dropped somewhere between 20% and 35% by some estimations, and excess supply has been building for weeks. Thus, we may not even be at the nadir of the market shock. When the smoke clears from this explosive market disruption, there will possibly be some major market ripple effects such as swaths of the Canadian oil market (1.5 million barrels per day) and U.S. backyard “stripper” wells (representing 10% of total U.S. production) permanently going offline, representing a material change in U.S. supply going forward.
Something must give, and something will. While global supply and demand imbalance has the industry scrambling in unseen territory, how does this convert to what upstream companies and reserves are worth amid the situation? Is it a 1:1 price to value change ratio? Depending on perspective, the answer is both simple and complicated.
Not surprisingly, most potential or actual sellers of upstream assets and companies are praying that they don’t have to find out. Translation: they hope the market will correct itself before they choose (or have) to sell. The reasons for this are multifold. The obvious rationale is that the value of today’s production could fetch the lowest relative prices seen in decades. Secondary rationale is that tomorrow’s production, i.e. reserves, are being hit even harder. Those reserves represent the optionality, expectations, and hopes of an investor for a brighter market tomorrow. Therefore, sellers don’t want to give that up, whilst on the other side of the coin, buyers aspire to acquire the potential opportunity. What is the likely result? Wide bid-ask spreads and little to modest market activity. Put another way – the asset and transaction market could go dark until restructuring transactions hit the market.
Navigating Today’s Upstream Economics
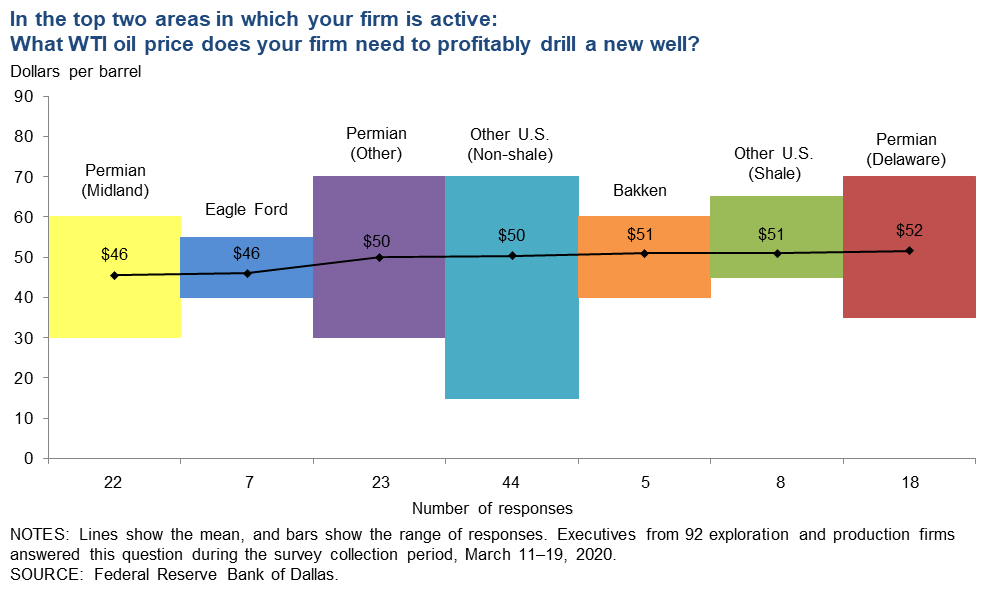
There are still indicators that can shed light on a dark market. Those include public valuations, reserve metrics, production metrics, and cash flow metrics. In terms of reserve metrics, value erosion usually starts in the bottom categories of a reserve report and moves upwards. Possible and probable reserves typically diminish in value first, then up to the proven categories, and finally to producing reserves. This makes sense because producing reserves are less risky and less expensive to produce, and thus are more value resilient in lower price environments. Consider the costs to produce an existing barrel of oil. In West Texas, this averages about $26 per barrel – some can produce cheaper and others more expensively. This means the average producer is losing $5-6 per barrel today on existing wells. What’s also notable is that these costs are much lower than they were just a few years ago for U.S. shale producers, but still aren’t low enough. Compared to the rest of the world, Saudi Arabia and Russia have the lowest production costs (of which we won’t expound on the reasons why here) and thus the rawest economic ability to weather this low-price environment.
 Source: Dallas Fed Energy Survey, Reuters, Seeking Alpha[/caption]
However, when it comes to undeveloped reserves the costs are much higher. Even in the most efficient areas of Texas, oil prices need to be at least $46 per barrel to profitably drill a new well. This illustrates why even proven undeveloped (“PUD”) reserves are worth relatively (and often significantly) less than developed reserves.
Therefore, upstream producers are de-incentivized to drill new wells, leading to the value of new inventory decreasing at an even proportionally higher rate. This dynamic has been exacerbated by the market’s focus on cash flows in priority to reserves in recent years. Investors had already been pulling valuations down as their standard tilted more towards shorter-term returns as opposed to longer-term reserves. To be sure, producers have reduced capital expenditures by historic amounts in the past 45 days or so. Extending that perspective, some might think non-producing reserves are worthless. However, they would be wrong. There is an optionality value to those future reserves, also known as acreage, that bears out in the marketplace and is evidenced by transaction prices. Valuations are based on future expectations, and many people believe that prices will not stay low permanently. Therefore, the market is willing to pay a relative premium to immediate economics to account for potential future upside. It also shows up in implied public market valuations as well.
Ceding Latitude To Public Valuations
Implied valuations of public companies can provide a living proxy for market values, assuming efficient market theory. There are several metrics that investors and the industry utilize as potential benchmarks including cash flows such as EBITDA and EBITDAX. However, I note in this instance that the first quarter 2020 earnings have not been released yet, so trailing cash flow metric indications are not concurrent. Other metrics can be followed more contemporaneously such as enterprise value per flowing barrel of production. In addition, the drop in equity values push debt ratios higher, thus potentially triggering bank covenants.
Predictably, valuations have been in a free fall. What may be unexpected is how those valuations have changed relative to prices or even other companies that are operating in different basins. Mercer Capital tracks groups of public oil and gas companies and categorizes them according to focus. There are integrated global producers, non-integrated global producers, North American focused producers, and even basin focused producers. Mercer Capital follows several valuation-related data points, but some key ones include enterprise value per flowing barrel which shows a company’s publicly traded enterprise value relative to its daily production. The table below shows the median results from those groups and from the entire sample.
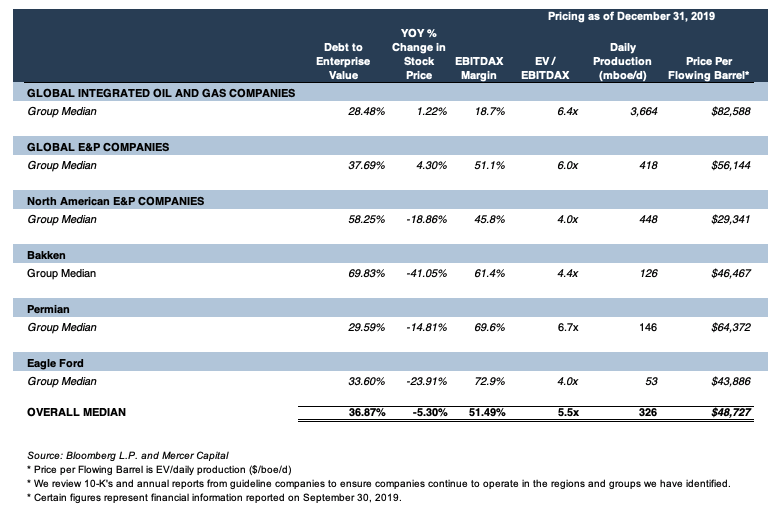
It's notable that general North American and basin-focused companies typically traded at a relative discount to global companies with one key exception – Permian focused companies. This group, including names such as Concho, Pioneer, and Diamondback, traded at multiples closer to its global counterparts. It’s also notable that debt ratios for most companies were between 30% - 40%, a reasonable historical range. Then the chaos hit, and recent valuation metrics look gaunt comparatively.
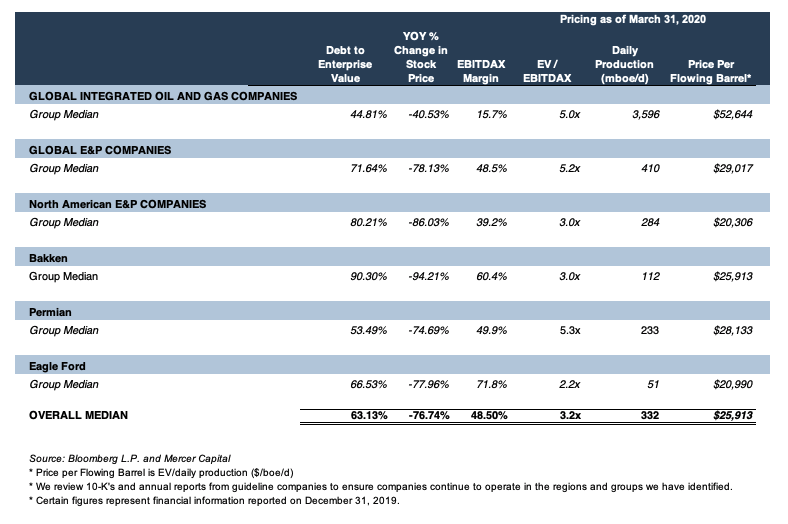
As of the end of the first quarter, while WTI oil prices per barrel dropped from $61 to $21 or a 66% decline, price per flowing barrel fell only 47% in Mercer Capital’s group indicating that enterprise and asset values were more resilient than short term price fluctuations. This is, in part, a function of the previously mentioned reserve optionality. However, it’s also notable how much equity was lost and how relative debt ratios skyrocketed. The Bakken (Continental, Whiting and Oasis Petroleum) group’s debt ratios were the hardest hit, which may be a response to its pre-existing leverage issues relative to other groups.
Finding Transactional Direction
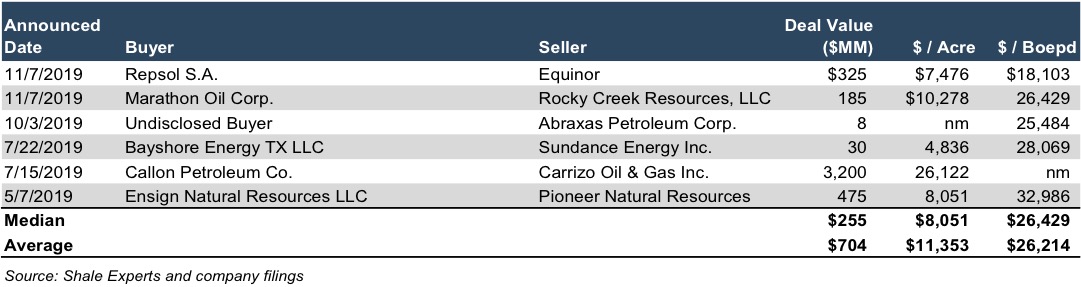
Although the merger and acquisition market is likely to reveal limited information, it doesn’t mean that there are no transactions. In fact, just this month there were a few transactions announced that give a glimpse into how valuations are being set from a production and acreage value perspective. Value per acre is another metric that ranges based on numerous factors. However, in recent years depending on those factors, many deals traded around $8,000 to $12,000 per acre. In the Permian Basin, deals often traded above $20,000 per acre. Below is a sample of transactions in 2019 in the Eagle Ford shale area that illustrate this:
In the past few weeks, there have been three transactions announced across the SCOOP-STACK area of Oklahoma, the Permian Basin in West Texas and New Mexico, and the Barnett Shale area in North Texas with some revealing financial disclosures. Potential motivations vary in these deals ranging from bankruptcy to prior strategy commitments. They also show why sellers are not incentivized to divest assets right now:
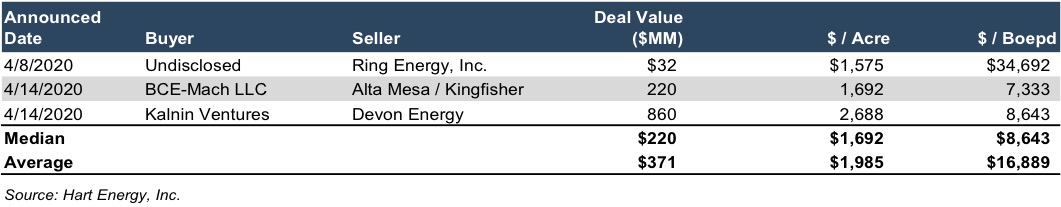
Although this is not an apple to apple basin analogy, the contrast is stark. As can be seen in comparison, acreage values have slunk relatively further down than price per flowing barrel metrics indicating more erosion from the bottom of a company’s reserve report. There is a clear disconnect between PV-10 figures and the GAAP-driven Standardized Measure figure compared to market values at present.
Destination Unknown?
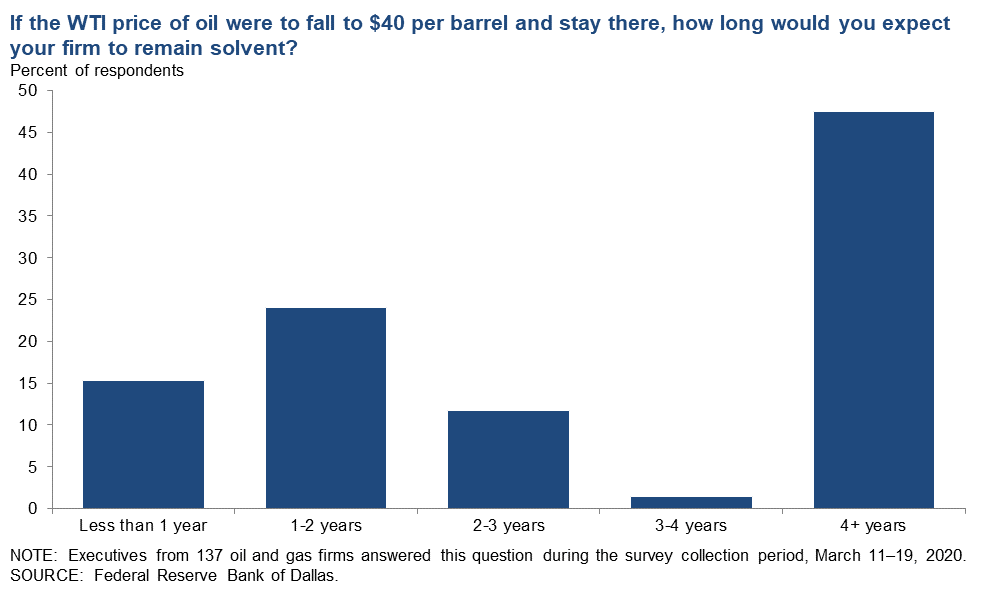
So where does this leave us? Lost? The market could potentially recover the sooner that economies open again. Each day that passes without positive indicators, the state of uncertainty continues. Many small producers can’t hang on much longer. During the Dallas Fed’s recent survey, nearly 40% of respondents would remain solvent for less than two years if prices stayed at $40 per barrel. Figuratively, that was a long time ago.
Banks may extend credit lifelines since so many producers are in the same boat. Historically banks have preferred to leave the oil and gas business to their clients, however, this time around may be different as it is reported that major banks are setting up oil companies to operate seized assets. The question is – how realistic and pragmatic is that option? Even so, asset valuations may find a bottom near these prices. Even with today’s bloodbath, the valuation metrics from March 31st appear to be holding. Upstream prices are holding up much better than forward month oil futures. One other note – the oil market is not the only energy sector impacted. Renewable projects have been hammered as well and their economics are not as established as the oil industry. This could set back oil’s energy competition for some time as well. We’ll see.
Originally appeared on Forbes.com.


