Do The Upstream Sector’s Mosaic Of Indicators Create A Clear Picture?


Considering the precipitous drop in oil prices at the end of last year, 2018 finished with somewhat unexpected results in the upstream sector. Take the OGJ 150, one of the industry’s upstream indexes. It was on a roller coaster. It began the year at 1,858 and generally climbed for the first three quarters. It peaked on October 9th with a closing of approximately 2,021. It then took a fall and finished the year at 1,522 about 18% off from the start of the year. However, it has since climbed back up in January and closed last week at 1,646.
Questions and opinions abound. Causes, concerns, opportunities and optimism are being bandied about. There are several indicators out there that are sending mixed messages. Pricing, supply, DUC counts, LNG growth, bankruptcy activity, capex budgets and merger and acquisition trends are out there to name a few that interplay with each other. They create a visual of what is happening and what could happen going forward. We’ll look at a few of these to try to get more clarity.
Prices (Bearish)
As U.S. crude oil prices plunged by 40% in the fourth quarter of 2018, from $75 in the beginning of the quarter to $45 per barrel at the end of December, valuations dropped alongside prices. What were the causes? Reasons started with concerns about potential increasing of U.S. shale output, inconsistency in Russia and OPEC’s execution of their production deal and fears of a global economic slowdown. Even OPEC’s deal with Russia to cut 1.2 million barrels per day during the December 6-7 meeting couldn’t stop oil prices from falling. The sharp decline once again demonstrates that higher prices fostered by supply-side management have a difficult time lasting.
On the other hand, natural gas prices benefited from seasonal fluctuations. Prices jumped to over $4.80 per mcf in mid-November due to several factors including an early and colder winter hitting North America. In its December edition of the Short-Term Energy Outlook, the EIA reported the price of Henry Hub averaged $4.15/MMBtu in November, up 27% from October. Higher inventory helped to smooth price volatility in the energy market, but U.S. natural gas inventories began the season at a 15-year low. This will most likely be a temporary issue, as reserves are plentiful and the LNG market will begin to offtake more supply in 2019.
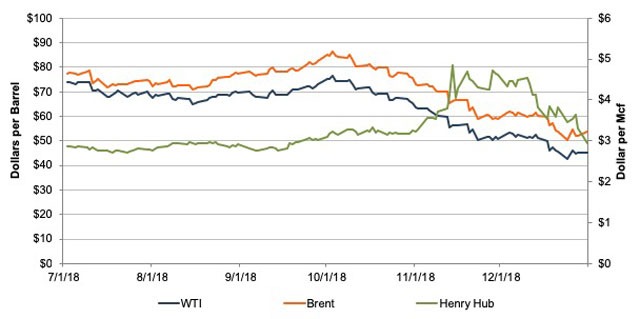
It is relatively rare to see the inverse relationship between crude oil and natural gas prices. A more than 50% increase in natural gas prices was coupled with nearly 30% downturn in crude oil prices during a seven-week period from early October to mid-November. Long oil short natural gas, once a popular trade by speculators, was punished during this unusual period of time. Natural gas prices ended the year at $2.94 per Mcf, a 2.3% decrease for the fourth quarter and essentially flat for the year.
Supply and Demand (Bullish)
In 2019, it is expected that the U.S. will continue to lead the growth in oil supply worldwide. Improving pipeline capacity, particularly in West Texas, and the combination of horizontal drilling and hydraulic fracturing continue to drive higher and more efficient production in the U.S. Good news is that a lot of this supply will be at a lower cost to producers because part of the costs has already been sunk. Drilled but uncompleted wells (“DUCs”) which jumped to new records in 2018 will likely be drawn down as a lower cost production alternative. This will contribute to supply growth.
According to the December Short-Term Energy Outlook, the EIA expects global liquid fuels consumption to increase by 1.5 million barrels per day in 2019. Growth is largely coming from China, the U.S. and India. U.S.-China trade tensions remain high entering 2019 and have shaken up most if not all industries, and oil and gas is not an exception. China is the second largest in terms of oil consumption and surpassed the U.S. as the world’s largest crude oil importer in 2017. Slower growth in China is looming for the demand side of crude oil. In 2019, the continuation of worldwide central banks tightening pressures global economic growth and the prices of assets and commodities. Higher rig counts and higher capital expenditures by major oil & gas companies worldwide during the recovery also cause concerns of oversupply. According to Baker Hughes, as of December 28, 2018, the rig count in the U.S. was 1,083, 16.6% higher from December 29, 2017.
LNG (Bullish)
U.S. LNG daily production hit record high of 5.28 Bcf during the week of Christmas, according to S&P Global Platts. Large-scale additions to production capacity in 2018 included Shell’s Prelude and Inpex’ Ichthys, both offshore Australia, and Novatek expanded its Yamal LNG facility, while demand is slowing down in Asia, the biggest LNG market in the world. Europe is likely to play the key role in absorbing all the additional production as geopolitical factors, pipeline capacity issues and the controversial Nord Stream 2. Also, Gazprom’s contract for gas transit via Ukraine is expiring at the end of this year and surprise during negotiation is always possible among Russia, Ukraine and Europe.
Going forward, LNG capacity will grow significantly in the U.S. The ability to send U.S. gas overseas will be a welcome reprieve for an oversupplied domestic gas market. This could create positive price pressure in gas markets. However, this could also have more localized effects as opposed to widespread.
Bankruptcies (Mixed to Bearish)
After ebbing for the past several years, bankruptcies in the energy sector increased slightly in number and dollars. According to the latest bankruptcy tracking report from Haynes and Boone LLP, bankruptcies upped a notch in 2018.
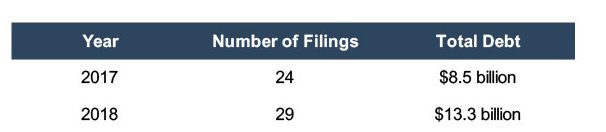
Thoughts on these statistics are mixed. With the drop in prices in the second half of 2018, concern could mount that more bankruptcies may be ahead. The good news is that many companies have already restructured their balance sheets over the past few years and oriented their business models to operate at $50 oil and $3 gas. Therefore, they can have some stability in this pricing environment.
However, at the same time, a number of public companies made announcements of significant reductions in their 2019 exploration and production budgets. This could lead to an increase in filings for remaining producers who may have tighter cash positions in the event of capex and budgetary strains.
Capital Spending for 2019 (Mixed)
North American E&P spending as a whole is expected to lag behind international markets but is estimated to grow 9% in 2019, according to a global E&P report released from Barclays. Barclays noted, however, “spending is exposed to more downside risk given the recent oil price collapse,” which isn’t fully captured in budgets that have been approved thus far. It’s also important to note that not all companies have announced 2019 plans yet.
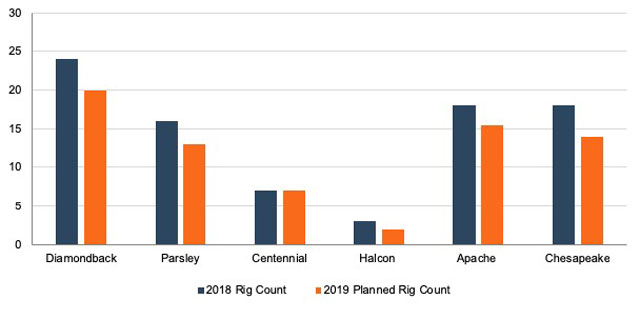
Several companies (such as Apache, Diamondback, Parsley, Centennial, Halcon and Chesapeake) are expecting to make budgetary reductions.
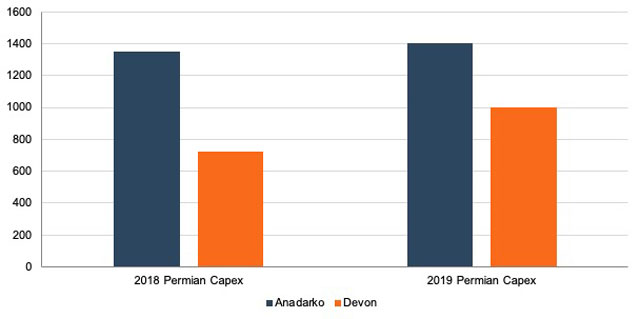
However, several others (such as Anadarko, Pioneer and Devon) appear to be looking to maintain or even increase rig counts in the Permian Basin in 2019.
Hess Corp announced a 2019 E&P capital and exploratory budget of $2.9 billion slated for 2019, up from $2.1 billion in 2018. Approximately 75% will be allocated to high return growth assets in the Bakken and Guyanna.
ConocoPhillips has set a capex budget for 2019 of $6.1 billion, which is comparable to its 2018 capex, excluding any acquisition costs. Approximately $3.1 billion will be allocated to rigs across the Eagle Ford, Bakken and Delaware plays.
M&A (TBD)
Activity in this realm has been relatively slow lately. This is probably due to the drop in oil prices. However, this pricing could also portend more M&A activity. Upstream valuations are trading at relative lows compared to the wider stock market. This could combine for more transactions in 2019. Companies plan for longer term pricing and long term expectations, using the futures curve as an indicator, are still around $54 going out about five years.
There is a lot of capital in the marketplace that is waiting to be placed. If these conditions continue, it could give rise to more deals and more dollars in 2019.
Conclusion
The indicators are out there, and one thing’s for sure—they don’t all align. Economist Karr Ingham, while recognizing the challenges of some of these bearish signals, remains optimistic. “The growth in Texas crude oil production even in the face of lower prices, rig counts, drilling permits and employment compared to 2014 peak levels remains the story of the year.”
Valuations have suffered in 2018, but if the structural undergirding of the recovery over the past few years is strong, then the U.S. upstream sector should still be able to not only survive but thrive in 2019. Whatever happens, this muddied picture will become more clear as the year gets going.
Originally appeared on Forbes.com.