How to Interpret Breakeven Prices
Before mid-2014, few investors took notice of efficiency-oriented metrics, instead focusing on stories of new oil discoveries and the development of new wells and new technologies. Since the crash in oil prices, a new measure of success was brought to the forefront: breakeven prices.
Since the crash in oil prices, a new measure of success was brought to the forefront: breakeven prices.
Over the last couple of years, E&P companies have become more efficient, forced to create investor returns at $40 – $50/barrel oil. Well productivity has improved as companies drilled longer laterals and used less proppant. After the crash in oil prices, oilfield services companies lowered their prices to compete for limited work. As oil prices recovered, the price of oilfield services was slow to catch up. Additionally, companies have more capital discipline than they ever did at $100/barrel oil prices.
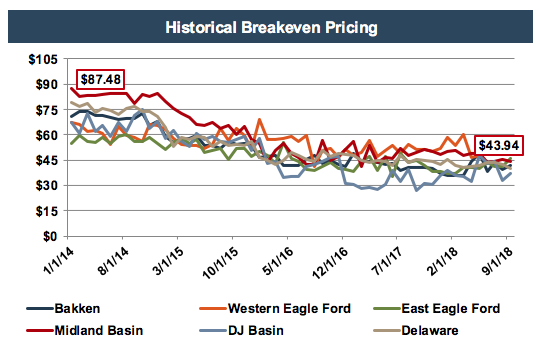
Even as oil prices have started to recover, companies are showing lower breakeven costs than ever before. As shown in the chart below, breakeven prices in the Midland Basin fell by 50% from $87 in January 2014 to $44 in September 2018.

As more companies present this metric and more investors rely on it as an indication of performance, it becomes increasingly important to understand what it actually measures, and if breakeven prices can be compared consistently from company to company.
What is a Breakeven Price?
The Wall Street Journal stated, “At its simplest, the metric represents the oil price that a company needs to generate enough cash so it can cover its capital spending and dividend payouts.” Most public E&P companies report breakeven costs in their investor presentations, oftentimes measuring themselves against peers. However, these companies rarely explain how they develop these metrics. Some companies, such as Chevron, don’t include covering dividends in this metric. Additionally, some companies look at project-specific breakeven prices which don’t always cover all spending and dividends.
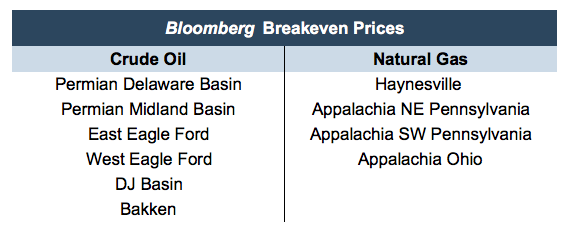
Many analysts and investors, including our oil and gas team, track Bloomberg New Energy Finance for region specific breakeven prices. Beginning in January 2014, Bloomberg began publishing monthly breakeven oil prices and breakeven natural gas prices for the following regions.

According to Bloomberg, breakeven prices by region are sourced from BTU Analytics and provide:
Average wellhead breakeven prices estimates for all wells turned to sales each month. Well economics calculations use a 10% discount rate. Well life is assumed to be 240 months. Gathering, processing, compression, fractionation, and operating expenses are estimated for individual basins and plays.
While somewhat helpful, this definition leaves a lot unexplained. We talked to BTU Analytics so that we could better understand what it calculates.
BTU Analytics’ data set includes 60,000 horizontal wells from 2013 to present across major basins in the continental U.S. Their data is collected at the well level and calibrated with production data from state agencies and reconciled with overarching trends discussed by major regional operators.
BTU’s breakeven measure on Bloomberg is a half-cycle breakeven price, meaning that all operating costs from drilling to completion of the well are accounted for. Additionally, the costs to keep the well operating such as taxes, royalties, and gathering and compression costs are included. However, what is not included in Bloomberg’s breakeven calculation is just as important.
What is Not Included in Bloomberg’s Breakeven Prices?
Notably, the Bloomberg Breakeven Price does not include wellhead differentials. This means, that breakeven prices in the Permian are based off the WTI-Cushing benchmark, not off the regional hub which traded at as high of an $18 discount in August, according to pricing information from Bloomberg.
As the Permian Basin struggles with bottlenecks, differentials have become exceedingly important to consider. Although there are plans underway to address the growing need for infrastructure in the Permian Basin, adjusting Bloomberg’s breakeven pricing to account for differentials observed at the wellhead is necessary to accurately understand a regions breakeven price.
Additionally, according to Matt Hagerty at BTU Analytics,
These breakevens exclude acreage acquisition costs which can vary significantly between operators and even across acreage for a specific operator.
Other Considerations
As mentioned previously, it is often difficult to compare breakeven prices across companies. Since BTU Analytics calculates each of these metrics, it would seem that they are more comparable across regions. But it is important to remember that these regional breakeven prices are averages and may not explain company or inter-regional dynamics.
If we continue to rely on breakeven pricing, then it is pertinent that we better understand what is included in these calculations.
In August of this year, breakeven prices in the Bakken fell below breakeven prices in the Permian. While we do not doubt the credibility of this metric, it leads us to consider the actual observations that make up this average. By mid-2016, the Bakken had only 22 operating rigs and even now has only 52 rigs as compared to 489 in the Permian. It would be interesting to get a deeper look at the standard deviation of breakeven prices in regions such as the Bakken, as these regions may exhibit a much wider range of breakeven prices.
Even at $70 oil, investors and analysts alike are still talking about breakeven pricing, suggesting that this metric has survived the downturn. However, if we continue to rely on the metric, then it is pertinent that we better understand what is included in these calculations.
Mercer Capital has significant experience valuing assets and companies in the energy industry. Our oil & gas valuations have been reviewed and relied on by buyers and sellers and Big 4 Auditors. These oil & gas related valuations have been utilized to support valuations for IRS Estate and Gift Tax, GAAP accounting, and litigation purposes. We have performed oil & gas valuations and associated oil & gas reserves domestically throughout the United States and in foreign countries. Contact a Mercer Capital professional today to discuss your valuation needs in confidence.
 Energy Valuation Insights


