Non-Operating Working Interests in Oil & Gas
Part 2: Markets and Valuation Characteristics of Non-Op Working Interests
As we continue our discussion on non-op working interests from Part 1, we turn to how the markets and valuation parameters are structured.
Non-op interests tend to be smaller, with less access to capital markets than larger operators or even many royalty aggregators. They’re more niche because they take more risks than royalty interests, as discussed in Part 1. However, at the same time, from an opportunity standpoint, the interests can be generally more overlooked by the industry at large. In one sense, they can reduce risk or exposure to any individual well, as the ownership is typically small relative to an operator. Non-op interests can also provide capital to the industry that is needed for further development. Investors in the non-op space tend to be economically rational. Profit margins and cash flow returns are typically the more immediate motive as opposed to numerous other factors that can come into play for an operator, such as leases on future acreage, drilling plans, capital budgets, debt lending parameters, and other factors.
There is a growing trend within the oil and gas space of developing specific non-op funds to fill an important role in the upstream capital markets. There is an interesting cross-section of E&P investors and more passive investors akin to royalty investors who have shown interest in the niche.
There are also a few (mostly small) publicly traded companies whereby non-operating working interests are a primary focus of their balance sheets. These include Northern Oil and Gas (NOG), previously mentioned in Part 1, but also Evolution Petroleum Corporation (EPM), Granite Ridge Resources (GRNT), and Vitesse Energy (VTS). Below are some recent company metrics for these four publicly traded non-op companies:

Click here to expand the image above
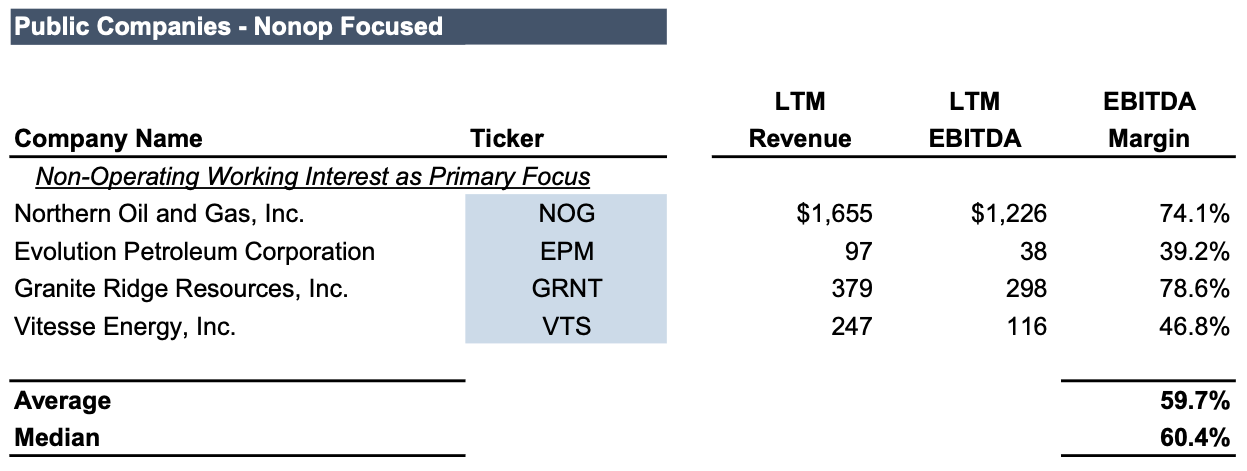
As shown above, only Northern Oil and Gas has an enterprise value of over $1 billion. Everyone but Granite Ridge has a mostly developed portfolio as well. From a geographic standpoint, these non-op companies are scattered across the United States and generally do not have basin-focused operations. Next, we observe EBITDA and margins:

Click here to expand the image above
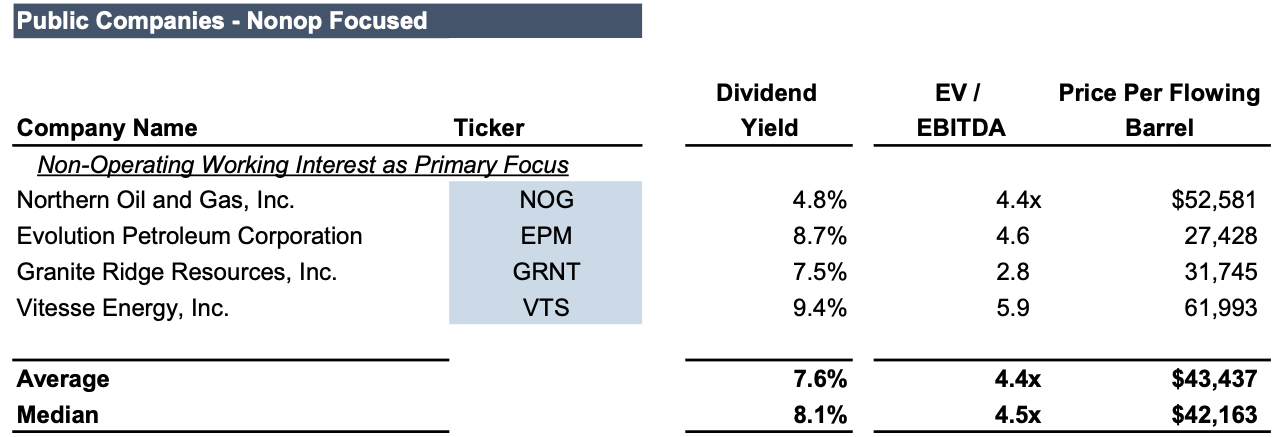
This snapshot demonstrates that margins can fluctuate between companies with 74% – 79% EBITDA margins and those with 39% – 47% EBITDA margins. This is not entirely inconsistent with publicly traded operator margin ranges shown in our Q4 2023 Newsletter. However, it also can be observed that investment choices made by these companies impact their margins, as their lack of control regarding costs comes into play. From a valuation standpoint, because of the nature of the investments, non-op companies tend to be dividend payment-oriented:

Click here to expand the image above
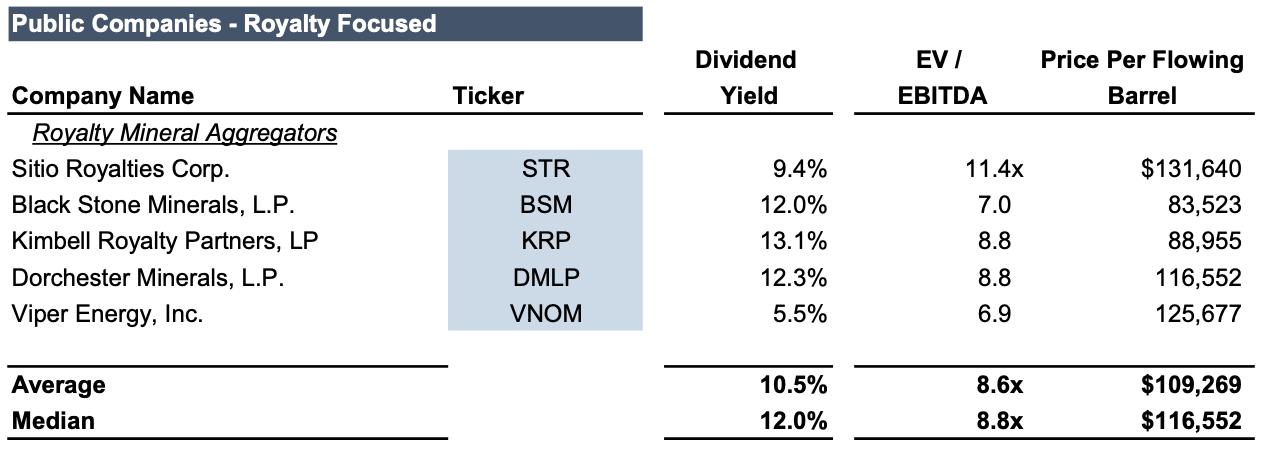
All four companies have a meaningful dividend yield but tend to trade in a similar valuation range as broader publicly traded E&P companies. From a flowing barrel standpoint, they take several of the same cost risks as operators. It should also be noted (and come as no surprise) that although dividend payers, non-op companies trade at significant valuation discounts from royalty aggregators, with some metrics being around half in comparison:

Click here to expand the image above
Non-op companies’ discounted metrics also mean that opportunities for larger returns exist as values are cheaper. The trade-off lies in whether the cash flows, dividends, and margins are worth the extra risks. This is a function of evaluating an operator’s competency and ability to manage costs, develop high-quality and productive wells, and access good commodity markets. When done right, non-ops can provide superior returns and quality valuations. When not done right, non-ops can (in some cases) be a source of negative cash flow and sub-par valuations.
 Energy Valuation Insights


