What a Difference a Year Makes: Part II
Analyst Projections


In our prior Energy Valuation Insights post – What a Difference a Year Makes – Mercer Capital’s Bryce Erickson dug into the key aspects of the energy industry during 2021, including oil and gas pricing, stock price performance, rig counts, production levels, capital spending, and LNG facility development. It’s well worth a read!
In today’s post, we continue the “what a difference a year makes” theme, but now with a focus on analyst projections, then-and-now (then being as of year-end 2020, and now being as of year-end 2021) and energy stock valuation multiples.
For the purpose of our analysis, we utilized the Capital IQ system and identified publicly traded energy companies, trading on the NYSE and NASDAQ exchanges, and operating in three broad areas – exploration and production (E&P), oilfield services (OFS), and midstream.
- The resulting pool included 44 E&P, 32 OFS, and 29 midstream companies
- 1,227 forward (i.e., for the next year) revenue estimates were included in the analysis – 666 as of year-end 2020, and 561 as of year-end 2021
- 1,735 forward EBITDA (earnings before interest, taxes depreciation and amortization) estimates were included in the analysis – 854 as of year-end 2020, and 881 as of year-end 2021
- Potential survivor bias was eliminated by including the same set of companies as of both year-end 2020 and 2021
So, What Are the Analysts Expecting?
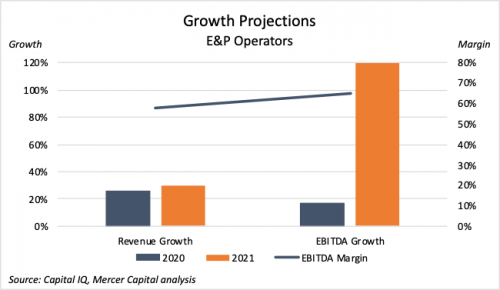
Exploration & Production
We’ll start at the drill bit end of the industry – the E&P companies. Revenue growth expectations (233 and 201 analyst estimates as of year-end 2020 and 2021, respectively) actually didn’t change significantly. As of year-end 2020 the median estimated 1-year revenue growth was 25.8%, with only a small increase to 29.7% as of year-end 2021. An improvement certainly, but by no means earth-shaking. A bit more significant for the E&Ps was a 7.5 percentage point increase in the median estimated EBITDA margin, from 57.7% to 65.2%. The real “move” in E&P estimates came from the combination of slightly improved revenue growth estimates and EBITDA margin estimates, buoyed by the rise in commodity prices. Those two estimates “teamed-up” for a mere 17.0% median EBITDA growth estimate at year-end 2020, but a very significant 119.8% median EBITDA growth estimate at year-end 2021.
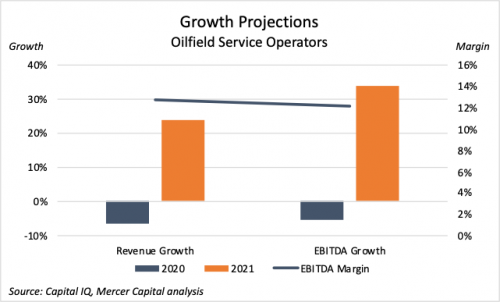
Oilfield Services
Next up we look to the service and machinery providers to the E&Ps – where we find a much more positive outlook today relative to a year ago. Last year’s median revenue growth estimates sat in negative territory at -6.3%. Sentiment was much improved at year-end 2021 with a median revenue growth estimate at 23.9%. However, OFS EBITDA margins paint a different picture. Despite the expectation for strong revenue growth, EBITDA margins are expected to actually decline slightly from a year-end 2020 median forecast of 12.8%,d to a current figure of 12.2%. This implies that while demand and utilization will be strong, pricing power for oilfield service companies will slip somewhat. The combination of revenue growth and EBITDA margin estimates, though, show a strong improvement in EBITDA growth expectations, from a median expected decline of 5.3% at year-end 2020 to a median expected growth of 34.0% at year-end 2021. This is not as strong as EBITDA growth expectations among the E&Ps, but a very welcome increase all the same.
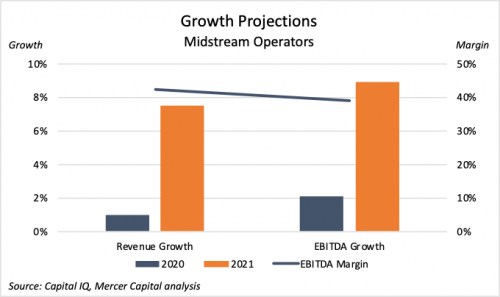
Midstream
Midstream operators of course are the “Steady Eddies” of the energy industry – that in large part is due to the very nature of the services provided and the more contractual/commitment orientation of the midstream business. As one would expect, the difference between 2020 and 2021 median analyst estimates are much less material for midstream companies. Median revenue growth estimates were quite low at only 1.0% at year-end 2020, but improved to a median growth estimate of 7.5% as of year-end 2021. EBITDA margin estimates actually declined a bit more than those for OFS companies, with a 3.3 percentage point dip from 42.5% at December 2020 to a 39.2% median at December 2021. In combination, the revenue growth and EBITDA margin estimates result in the median EBITDA growth estimate of 2.1% in December 2020 and a median estimated growth of 9.0% as of December 2021.
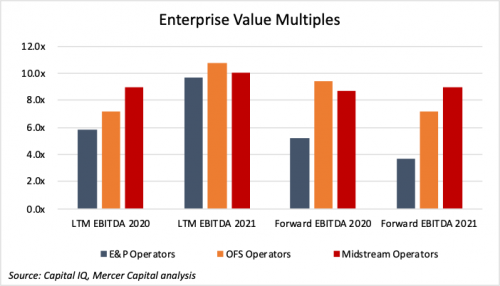
Valuation Multiples
Lastly, in our comparison of year-end 2020 and year-end 2021 within the energy industry we look to valuation multiples across the three energy sectors. Here we see how the combination of uncertainty of future operating results (risk) and growth expectations combine in the form of enterprise value multiples of EBITDA, on both a trailing (latest twelve months – LTM) and 1-year forward EBITDA basis. Starting with the midstream companies, we see that modest improvement in revenue expectations and slight reduction in EBITDA margins combine with risk perceptions for fairly modest changes from 2020 to 2021 LTM and forward valuation multiples. LTM midstream multiples edged up from 9.0x to 10.0x, while the Forward multiples showed an even more modest increase from 8.7x to 9.0x.
The negative 2020 EBITDA growth expectations and much larger (than Midstream) 2021 EBITDA growth expectations result in a very different combination of 2020 to 2021 and LTM to forward OFS multiples. Here we see the median LTM multiple jumping 34% from 2020 to 2021, while the forward multiple decreased by 24%. That with 2020 forward multiples 32% greater than 2020 LTM multiples, and 2021 forward multiples 50% below 2021 LTM multiples.
By far the largest swing in 2020 to 2021 and LTM to forward multiples comes from the E&P companies. With only modest EBITDA growth expectations as of 2020, the E&P LTM and forward multiples are quite similar at 5.8x and 5.2x, respectively. However, the 119.8% median estimated EBITDA growth at year-end 2021 results in a much larger LTM to forward differential of 6.7x – 9.7x LTM compared to 3.7x forward. That high level of EBITDA growth expectations in 2021, compared to the much more modest growth expectation as of 2020 results in a 3.1x differential between 2020 LTM multiples and 2021 LTM multiples (5.8x versus 9.7x). As with OFS forward multiples, the E&P forward multiples decreased markedly from 2020 to 2021, from 5.2x to 3.7x.
In Summary
The energy industry that was hammered in 2020 by the combined OPEC+ induced oil glut and COVID related oil demand decline showed a mixed bag of marginal and tepid operating result growth expectations at year-end 2020, but is showing much greater expectations as analysts look ahead into 2022. However, it is the energy industry – so, be ready for the next cycle shift.
Mercer Capital has significant experience valuing assets and companies in the energy industry. Our energy industry valuations have been reviewed and relied on by buyers, sellers, and Big 4 Auditors. These energy-related valuations have been utilized to support valuations for IRS Estate and Gift Tax, GAAP accounting, and litigation purposes. We have performed energy industry valuations domestically throughout the United States and in foreign countries.
Contact a Mercer Capital professional today to discuss your valuation needs in confidence.