Making Sense of 2020: Part 2
Benchmarking Cash Flow From Investing Activities


Continuing our benchmarking analysis, we turn our attention this week to how companies made investment decisions in 2020.
Big Picture Findings
Chart 9 shows that small cap companies slowed investment spending through the third quarter of the year before resuming a more typical investment pace in the fourth quarter.
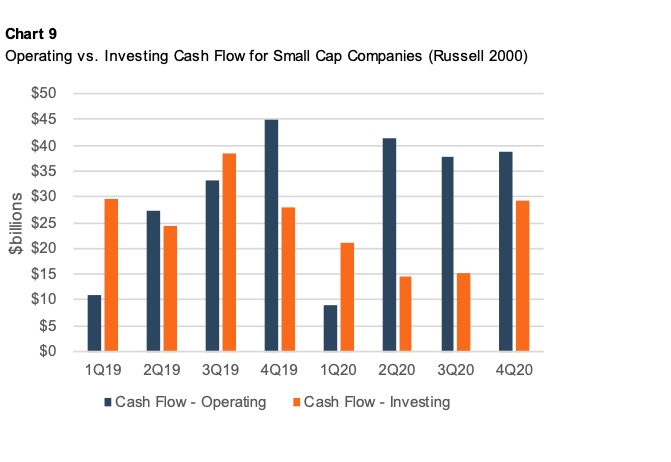
As we noted in last week’s post, cash flow from operations increased in 2020 despite the challenging operating environment. Based on conversations with our clients we suspect the year-over-year decreases in capital spending were attributable to both caution in the face of COVID uncertainty and the logistical challenges of installing capital equipment, constructing facilities, and performing due diligence on acquisitions during the pandemic.
Table 10 examines the components of cash flow from investing activities for small cap companies.
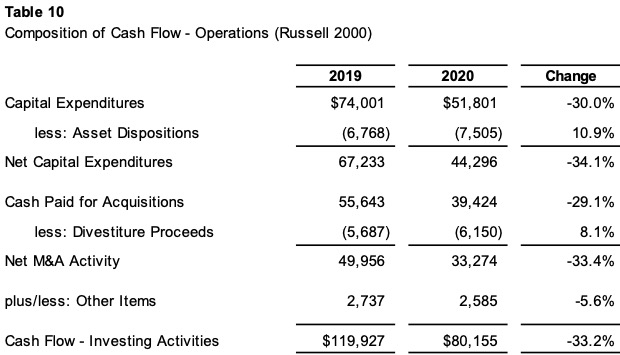
Investing activity slowed both in terms of capital expenditures and M&A. The small caps in our dataset were a bit more aggressive in disposing of assets and divesting unwanted operations than in 2019.
Deferring capital expenditures can preserve cash in the near term, but the bill on deferred expenditures eventually comes due. Depreciation and amortization expense is an (imperfect) proxy for the level of capital expenditures necessary to maintain productive capacity over time. Chart 11 summarizes the relationship between capital expenditures and depreciation charges during 2019 and 2020.
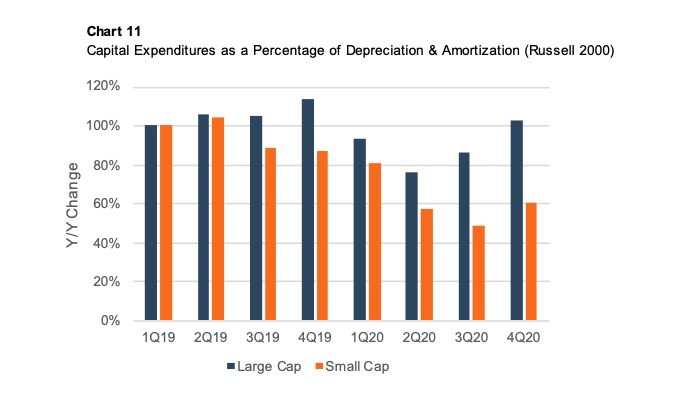
Capital spending among large caps was less constrained during 2020 than for smaller public companies. By the fourth quarter of 2020, the large cap companies had resumed a full replacement pace of capital expenditures (i.e., capex >= depreciation), while the small cap companies remained at an unsustainable rate of 60%. We will monitor how capital spending evolves as the pandemic subsides in 2021; the data suggests there may be pent-up demand for capital goods across the economy.
Digging a Bit Deeper
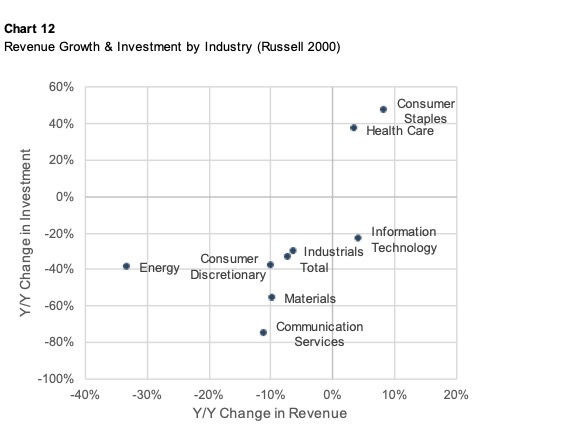
While total investment activity for the Russell 2000 companies decreased by about one-third during 2020, we know that was not the uniform experience of all of the companies in the index. We first compared the change in investment activity to the change in revenue by industry sector. As shown in Chart 12, there is a discernable relationship between firms’ willingness to invest and their revenue performance during the pandemic. Companies in sectors that performed well during the pandemic, such as consumer staples and health care, made significant capital investments to ensure that they had the capacity to take advantage of the revenue opportunities in front of them. Companies in the lagging sectors pulled back from capital investment during 2020.
Being in the right sector mattered a lot in 2020, but we were curious to know how individual company performance factored into investment activity. Chart 13 summarizes the results obtained when we ignored industry and stratified the data set by year-over-year revenue growth.
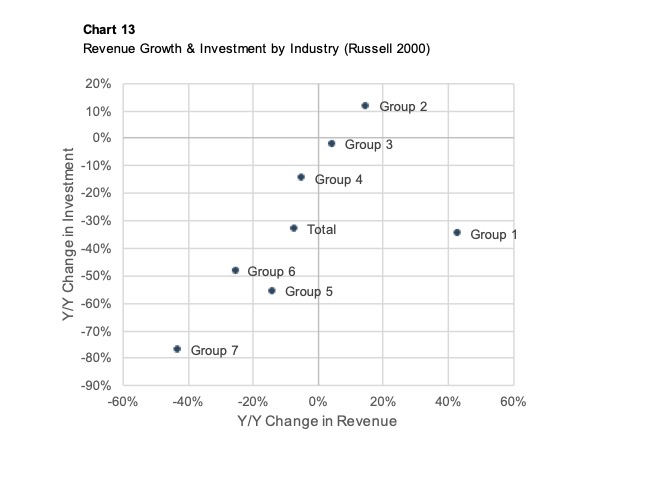
The relationship between revenue growth and change in investment is nearly a straight line. There are a couple things worth noting from Chart 13.
- The first is that the companies that grew most rapidly (Group 1) did so because of M&A activity rather than organically. As a result, aggregate investment activity for many of those firms was elevated in 2019 because of the M&A activity that gave rise to the significant growth.
- The second observation is that the slope of the investment line is steep: the difference in investment activity between Group 2 and Group 7 (89%) is greater than the difference in observed revenue growth between the two groups (58%). This means that companies’ investment decisions are sensitive to current operating performance (have a beta greater than one, if you will). Is this strictly a matter of prudent cash management, or (yet more) evidence that public companies are managed more with an eye toward the current quarter results than the long term?
Questions for Family Business Directors
This quick cruise through the investing performance of public small cap companies during 2020 raises some important questions for family business directors to ponder during 2021.
- How did the pandemic reshuffle the investing priorities for your family business? In the new post-pandemic landscape, where are the positive net present value projects for your company?
- Has the pandemic made M&A more, or less, attractive as a mode of investment for your family business? Are there motivated sellers in your industry or among your suppliers or customers that may make intriguing acquisition candidates?
- Despite the turbulence of 2020, have you and your fellow directors managed to preserve a long-term perspective on the capital investment needs of your family business? Are there any deferred capital expenditures that need to be made to ensure the long-term sustainability of your family business?
- What effect, if any, has the pandemic had on the risk tolerance of your family shareholders? How does your post-pandemic hurdle rate compare to pre-pandemic levels?
The investing decisions you make today can influence family shareholders for generations to come. Careful screening and evaluation of investment opportunities remains critical. Give one of our family business professionals a call to discuss the opportunities your family business is facing in confidence.