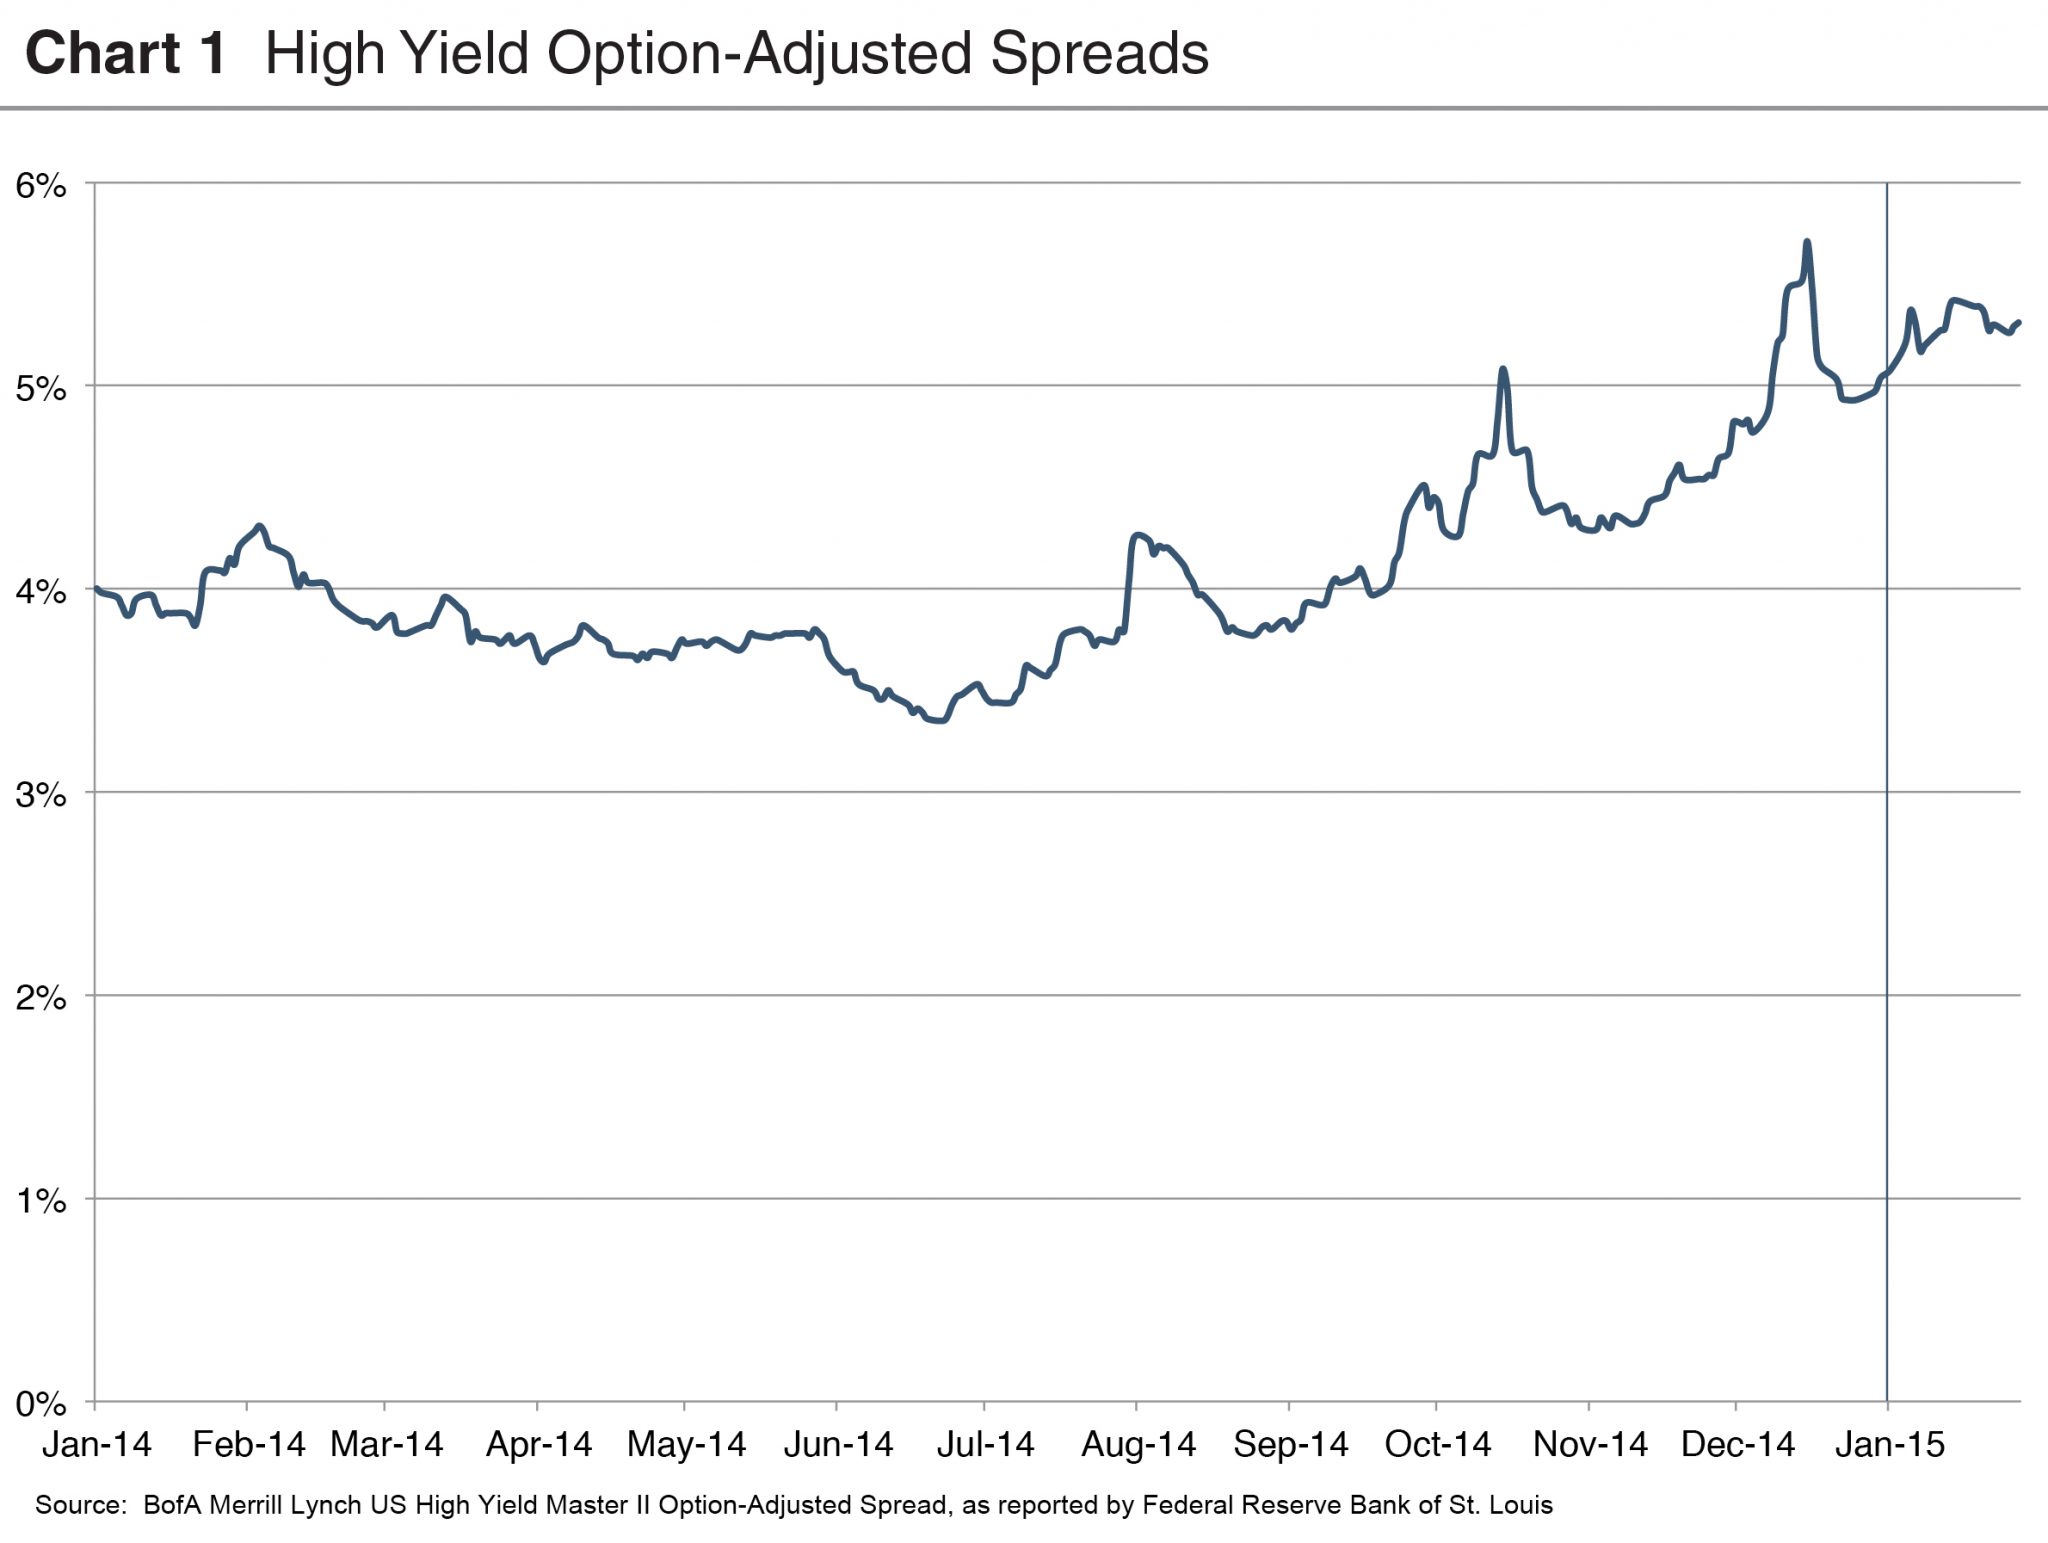
After being bloodied by widening spreads in the second half of 2014, any hopes that credit investors may have cherished for relief in 2015 remain unfulfilled through the end of January.
As shown in Chart 1, spreads widened fairly dramatically during the second half of 2014, with the benchmark BAML US High Yield Master II OAS closing the year at 504 basis points, up from a low of 335 basis points in late June. Market spreads have pushed further out thus far in 2015, growing to 531 basis points as the end of January approached.
For investment funds that report holdings at fair value, the incremental spread widening exerts downward pressure on fair value marks. The impact on fair value is a function of numerous factors, including term and rate structure. Chart 2 tracks the fair value of a benchmark debt instrument over time, taking into account changes in the term structure of interest rates (as manifest in the forward LIBOR curve) and observed high yield credit spreads. The net effect of spread widening and changes in the forward LIBOR curve during January 2015 pushed the fair value of the benchmark loan down to 97.7 from 98.6 at December 31, 2014.
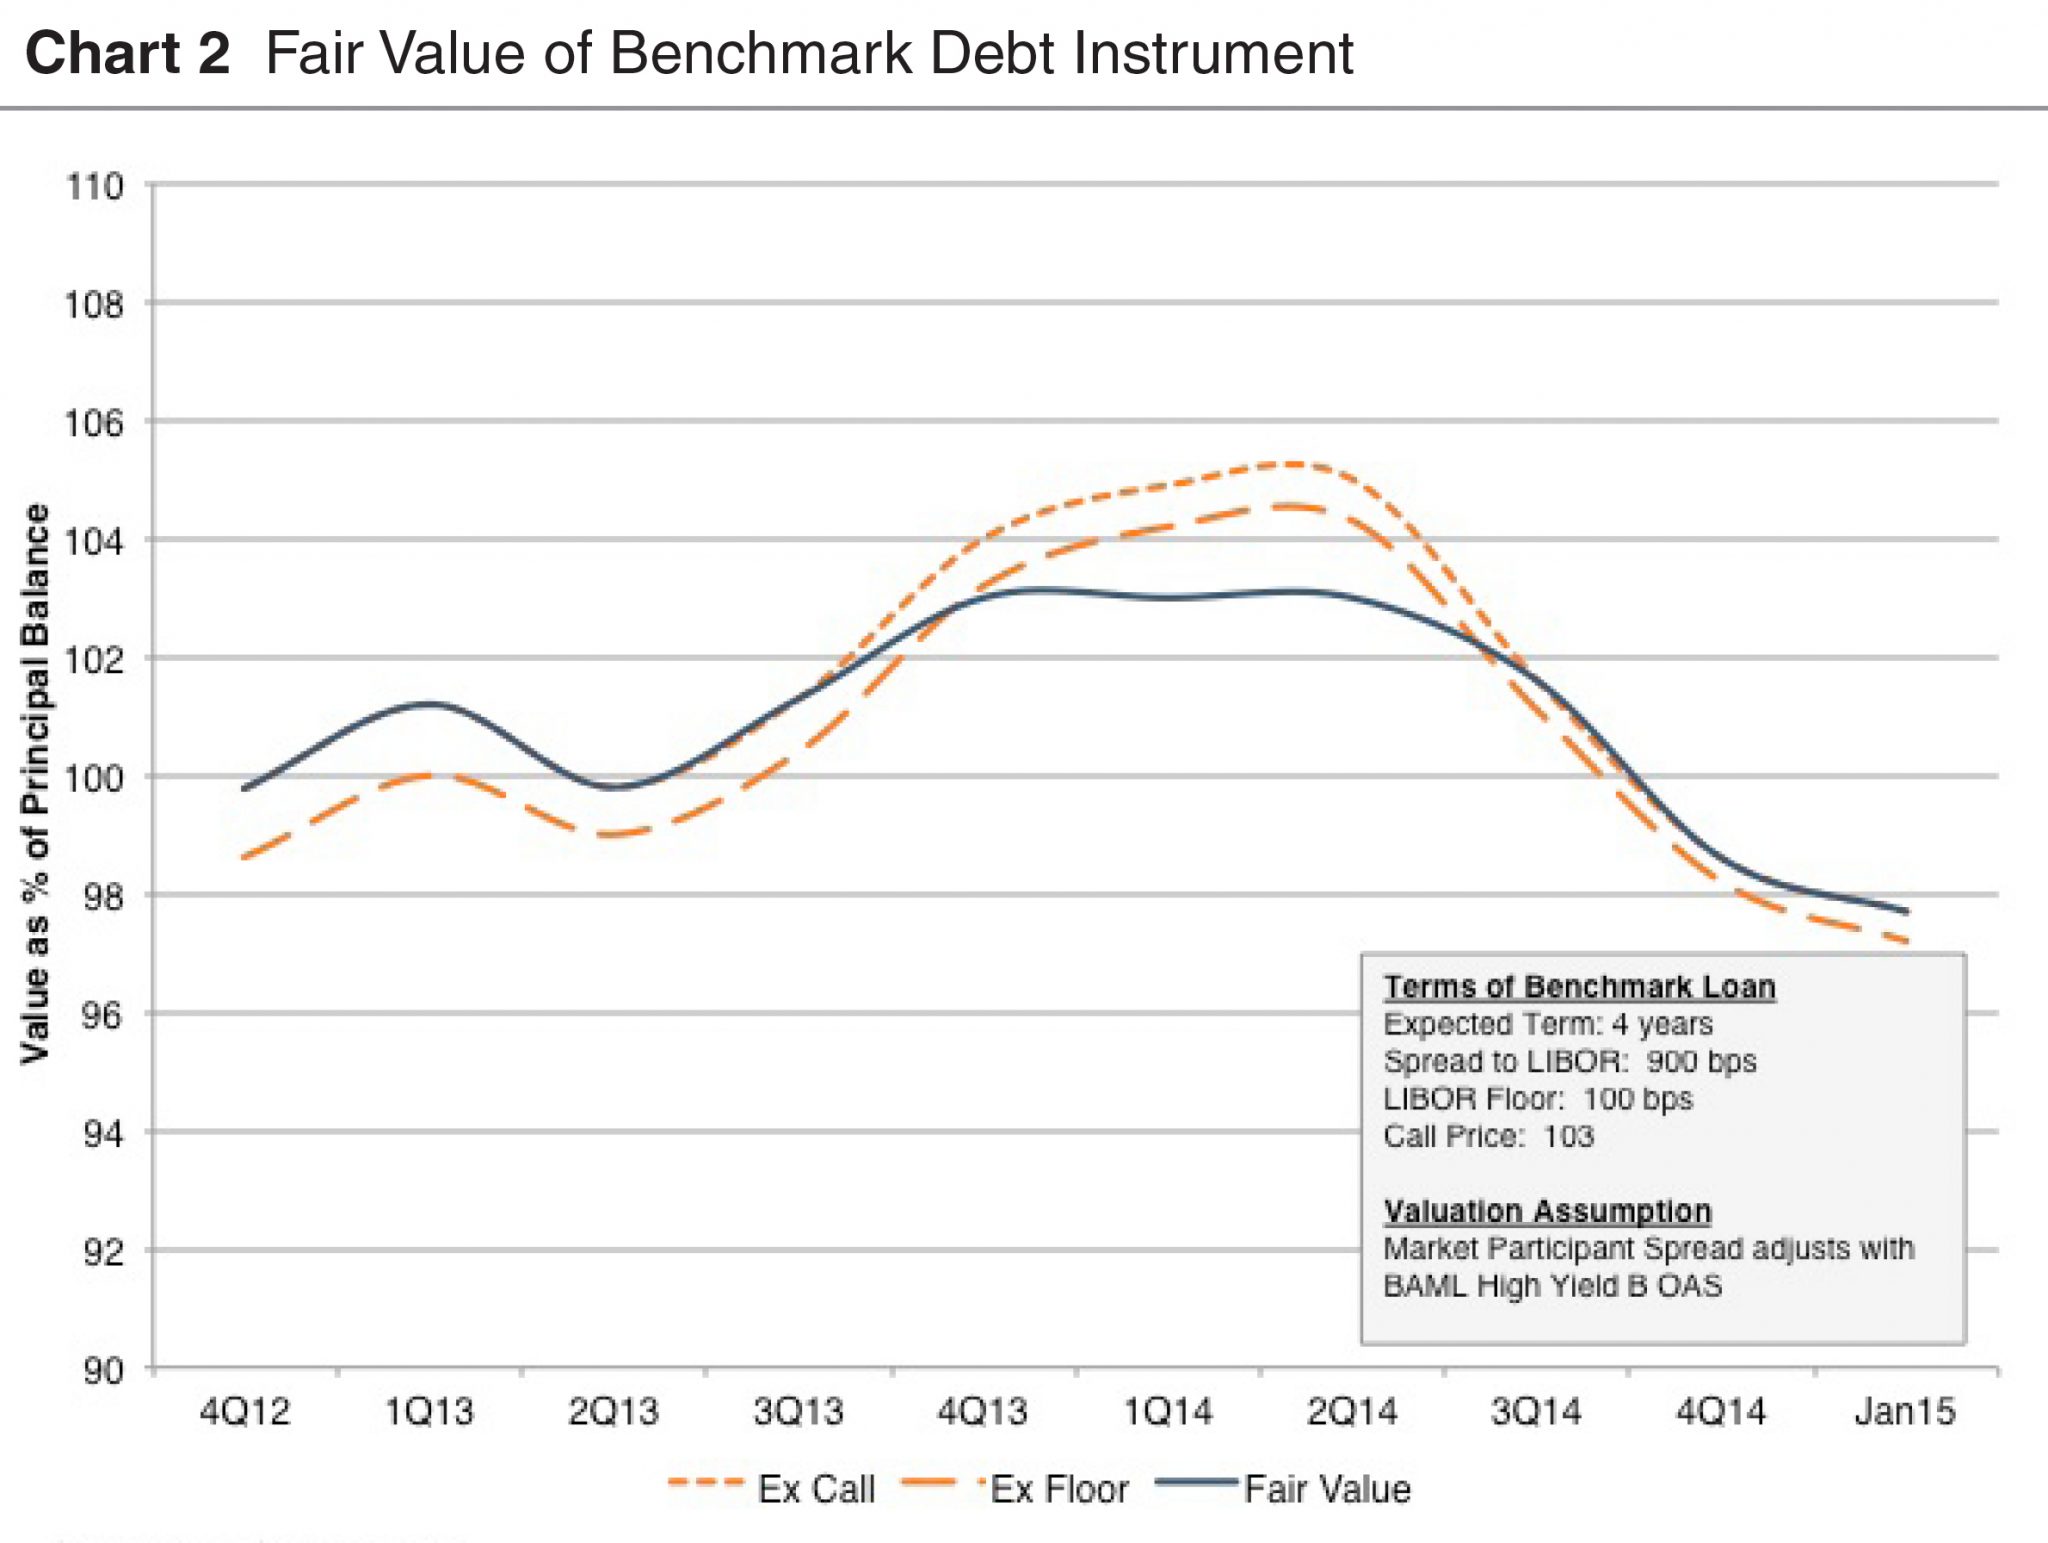
Chart 2 illustrates how common structural features of debt instruments and the overall credit markets can influence loan marks.
- Many floating-rate loans have LIBOR floors. As evident from the chart, the favorable impact of rate floors on fair value is most pronounced when the forward LIBOR curve is relatively flat (as was the case through much of 2013). Even though LIBOR at January 29, 2015, is essentially unchanged from December 31, 2012, the forward curve is a good bit steeper, reducing the value increment associated with the LIBOR floor.

- Call provisions are common features of debt instruments. As a result, such loans often exhibit “negative convexity” – while widening spreads depress loan values, the value benefit of spread tightening is constrained by the likelihood that the loan will be prepaid in such an environment. The dampening effect of the call provision on loan value as evident in the first half of 2014.
- Two additional factors which influence the fair value of actual debt instruments are not reflected in the benchmark loan modeled in Chart 2. First, the actual credit spread appropriate for a particular fair value measurement will reflect both changes in market spreads and borrower-specific factors (improving leverage ratios, changing industry outlook, acquisitions and other strategic changes). For example, the amount of spread widening appropriate to a borrower with no negative exposure to falling oil prices may well be less than that observed for the overall market. The fair value calculations in Chart 2 do not include borrower-specific factors.
Second, actual debt instruments have a fixed maturity date, and some have periodic amortization provisions. As a result, with the passage of time, the duration of the instrument decreases, and the sensitivity of loan values to changes in interest rate diminishes. In contrast, the loan modeled in Chart 5 assumes a constant maturity of four years, with no interim amortization of principal.
Time will tell whether wider spreads are here to stay, or if fund flows to high-yield credit and leveraged loan funds will turn positive again, increasing the supply of capital to borrowers. In the meantime, managers responsible for setting fair value marks will need to carefully consider how best to take account of current market conditions.
Mercer Capital’s Financial Reporting Blog
Mercer Capital monitors the latest financial reporting news relevant to CFOs and financial managers. The Financial Reporting Blog is updated weekly. Follow us on Twitter at @MercerFairValue.