We observed last spring that 2015 would likely mark a turning point in portfolio valuations with the degree of difficulty likely to increase during the year. With Q4 earnings season beginning, we take an opportunity to check in on portfolio marks and market sentiment over the year. The key takeaway from the year is that the valuation perspectives of investors and portfolio managers began to diverge.
The following chart depicts our benchmark loan mark for the past three years. After the sharp decline in 3Q15, the fair value of the benchmark loan fell again in the fourth quarter, falling from 93.9% of principal to 92.6%.
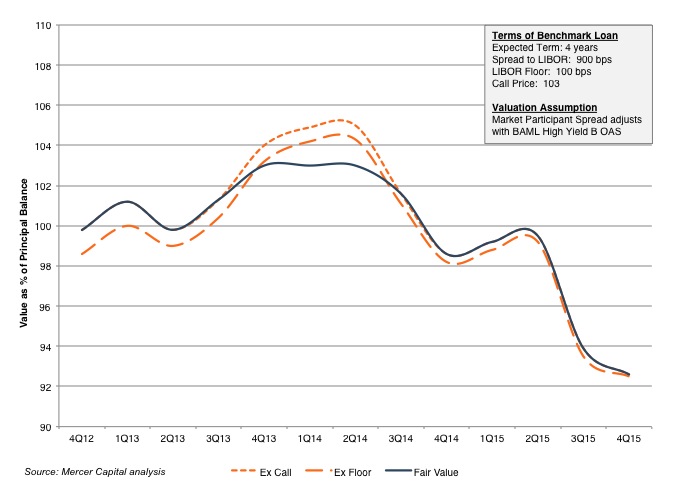
As we have noted on numerous occasions, the fair value of actual loans is determined by a host of issue-specific factors in addition to the market-wide indicators captured in the benchmark loan. However, for broad portfolios of loans, it does provide a measure of sensitivity of fair value to changes in credit spreads.
For BDCs, the benchmark loan fair value has been correlated to investor sentiment regarding BDC portfolio values. The next chart compares the benchmark loan fair value to a price index of a group of the largest BDCs over the period. Since BDC balance sheets are levered, the sensitivity of BDC share prices to the value of loan portfolios is magnified.
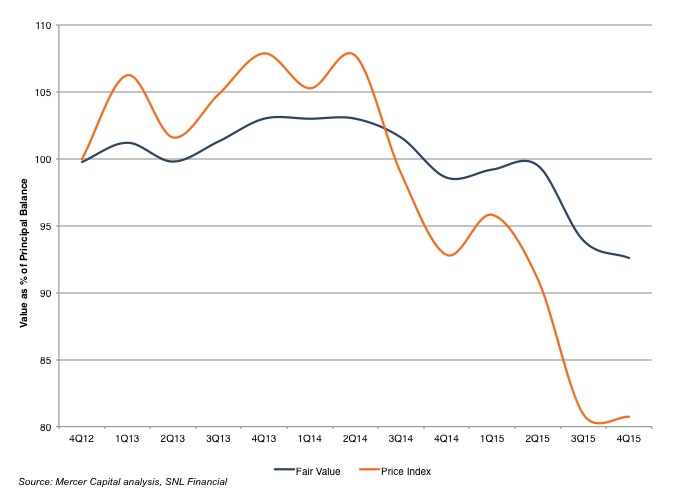
Since fair value is intended to reflect a market participant perspective, one would expect portfolio marks and investor perspectives to reconcile over time. However, current BDC share prices imply an even more dim view of BDC portfolio asset values on the part of investors than that indicated by our benchmark loan index. This would seem to suggest one of two potential scenarios: (1) investors have over-reacted to the impact of credit-spread widening on loan portfolio values, or (2) investors have adopted a skeptical posture toward the underlying credit quality of BDC portfolios. We do not hazard a guess at this point as to which will prove to be the more accurate explanation.
Table 1 summarizes 2015 market returns for 18 of the largest BDCs.
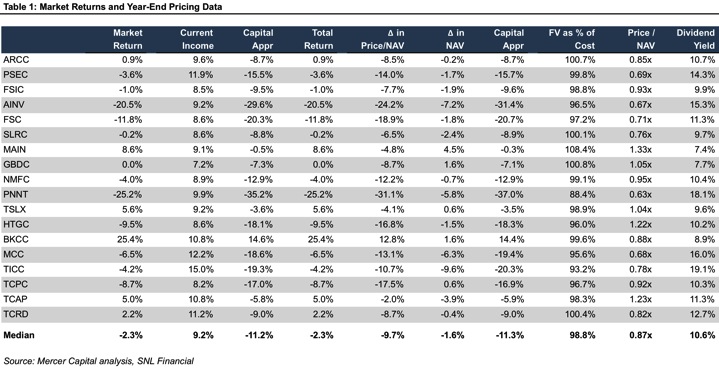
Total returns were negative for 11 of the BDCs analyzed, with share prices declining for all but one. Falling share prices were attributable to lower NAVs (median decrease of 1.6%) and shifting investor sentiment, with price/NAV ratios posting a median decrease of 9.7% for the year.
At September 30, 2015, reported portfolio fair values stood at 98.8% of amortized cost. Investors, however, seem to be marking the portfolios a bit lower, with the median price/NAV ratio for the group at 0.87x. Current dividend yields suggest that, at least for some names, the sustainability of current payouts is being questioned; beyond direct credit concerns, this may also be weighing on BDC share prices.
If 2015 was the year of increasing degree of valuation difficulty, perhaps 2016 will be the year in which we learn whether portfolio managers have been able to stick their valuation landings, or if portfolio marks will be subject to continuing market skepticism in coming quarters. In the end, the market perspective wins – BDC share prices will either recover to levels consistent with September 30, 2015 marks or the portfolio marks will trend toward the market-implied levels. Reported marks at December 31, 2015 will set the stage for 2016.
Related Links
- Portfolio Valuation: Private Equity Marks & Trends Newsletter
- Valuation Best Practices for Venture Capital and Private Equity Funds
- Turning on the Fasten Seat Belt Sign: Fair Value Measurement in Turbulence
Mercer Capital’s Financial Reporting Blog
Mercer Capital monitors the latest financial reporting news relevant to CFOs and financial managers. The Financial Reporting Blog is updated weekly. Follow us on Twitter at @MercerFairValue.