July 2025 SAAR


The July 2025 SAAR came in at 16.4 million units, up 7.1% from last month and up 3.7% from July 2024. It is important to note that this modest year-over-year gain requires a bit more context due to irregularly high sales this time last year. The June 2024 CDK software outage shifted sales into July and August 2024, making July 2025’s year-over-year performance even more impressive.
The auto industry continues to grapple with a complex tariff environment, as highlighted in last month’s blog, with ongoing uncertainty surrounding potential negotiations or further tariff extensions. Affordability remains an obstacle, as high interest rates can only be supported so much by longer loan terms before deterring purchases, while manufacturers’ incentive spending continues to trend down, further impacting sales momentum.
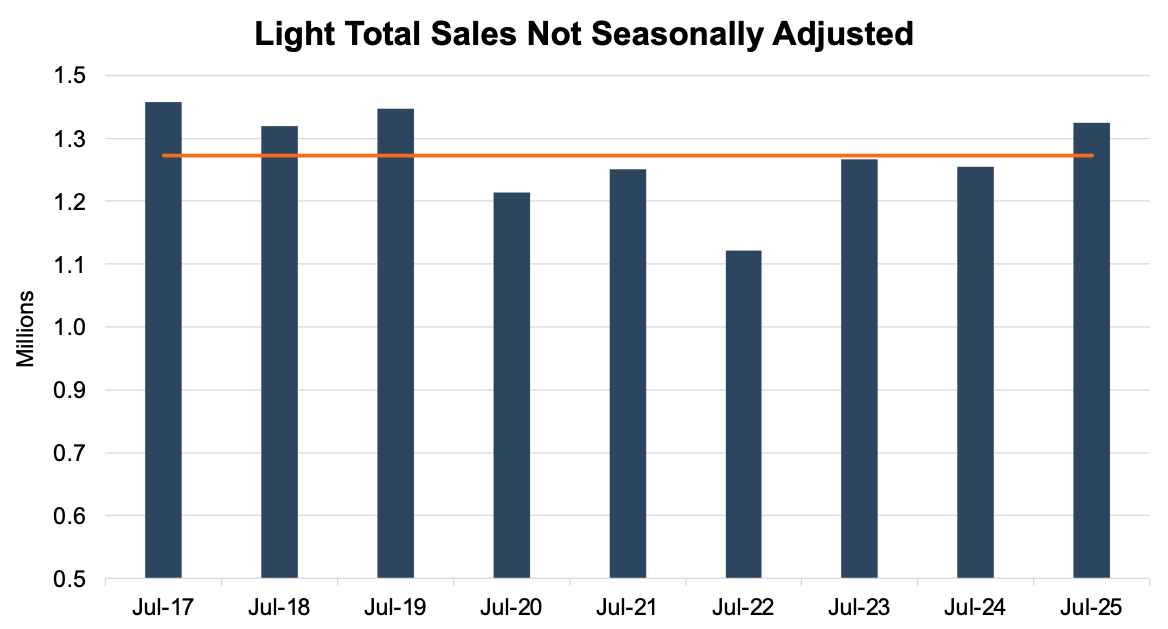
Unadjusted Sales Data
On an unadjusted basis, July 2025 industry-wide sales finished at 1.37 million units, a 9.3% increase from last month and a 6.6% increase from July 2024. This can be partially attributed to one extra selling day compared to July 2024. This month’s unadjusted sales exceeded the nine-year July average of 1.31 million units (2017 – 2025) by approximately 62 thousand units. See the chart below for a look at unadjusted sales over the last nine Julys.
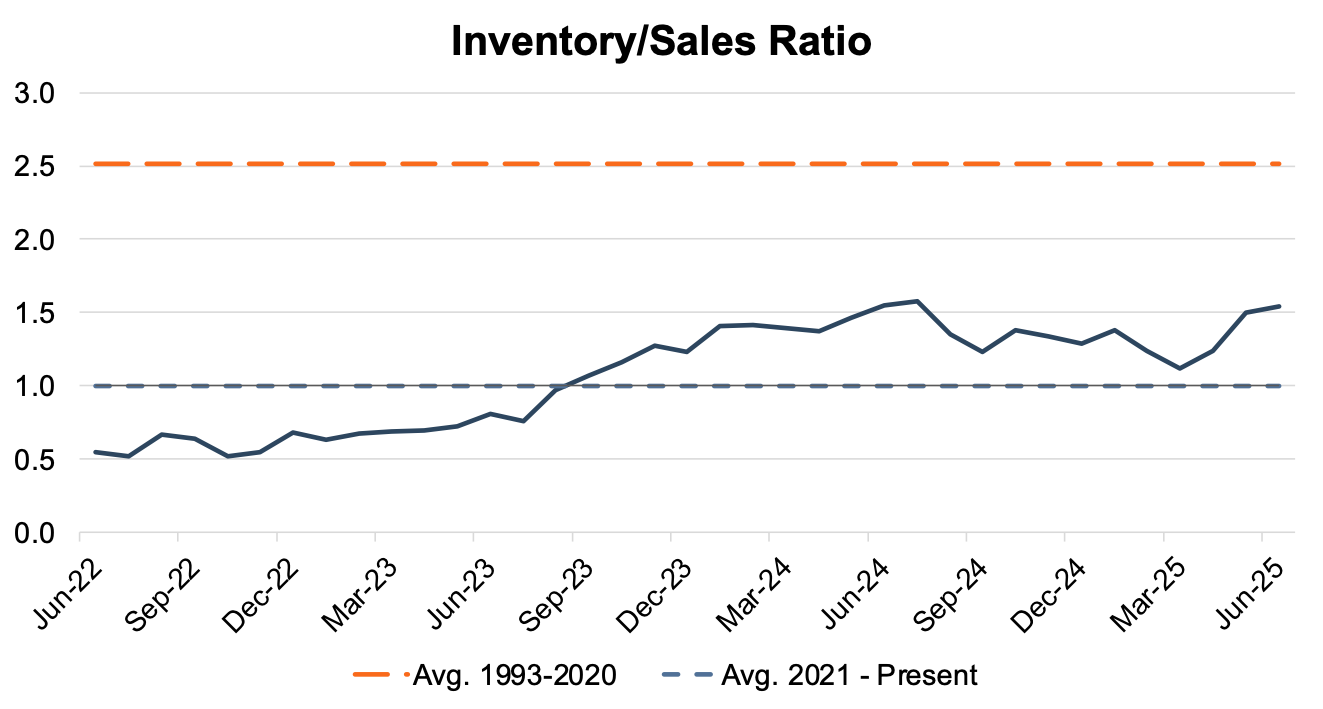
Inventory Metrics
The industry’s inventory-to-sales ratio increased to 1.54x in June 2025 from 1.50x in the prior month, which is the highest ratio reported since July 2024. In the coming months, we anticipate the ratio will stay above 1.0x as sales are expected to slow nationwide with higher-priced inventory reaching the market and softness in consumer spending. The chart below presents the industry’s inventory-to-sales ratio over the last three years.
Brand-level days’ supply data from Cox Automotive provides a more granular look into how manufacturers are managing their pipelines and highlights the increasingly important reality that a dealer’s inventory environment depends heavily on the OEM or specific brand rather than simply the average experience for the entire industry. See the chart below for a look at days’ supply by brand in July 2025.
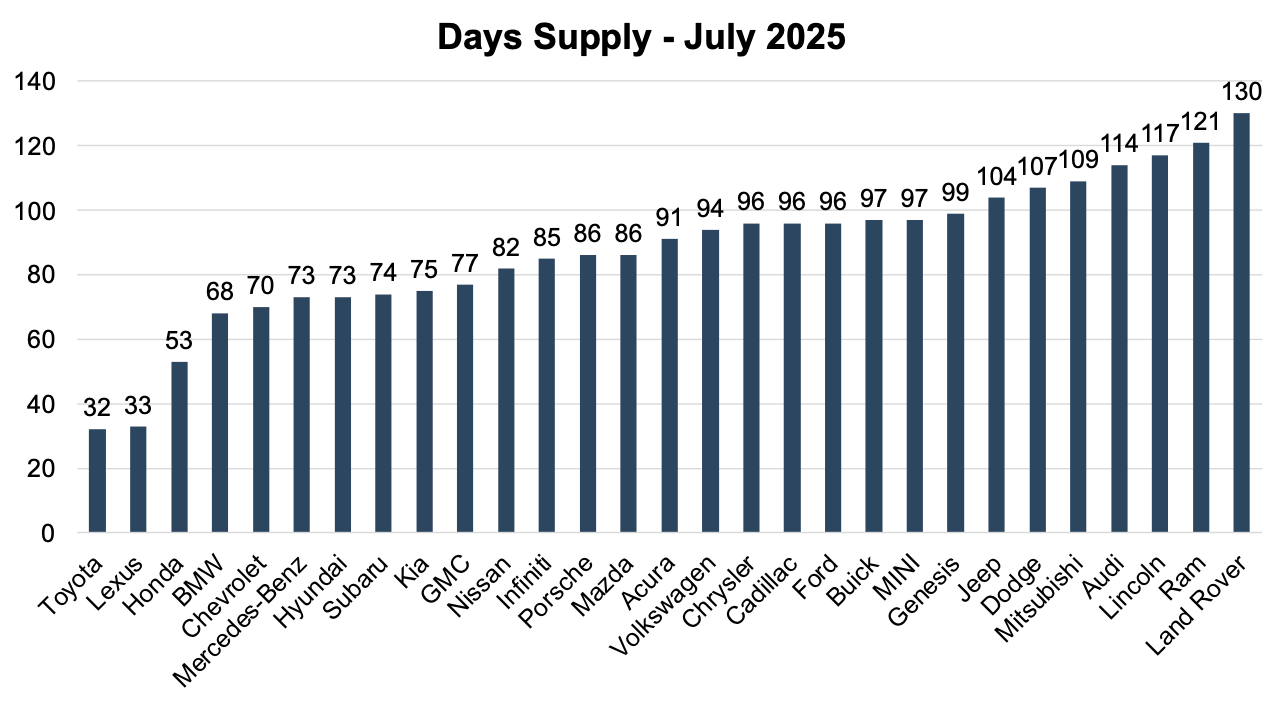
Toyota (32 days) and Lexus (33 days) continue to stand out for their disciplined approach to inventory management. These low days’ supply levels reflect faster retail turnover and tighter alignment between shipments and consumer demand. This level of supply is what many auto dealership executives touted on earnings calls as the new normal in 2022. Three years later, almost all manufacturers have returned to producing vehicles at levels that may not maximize profitability for dealers.
In contrast, brands like Land Rover (130 days), Ram (121 days), Lincoln (117 days), and Audi (114 days) are sitting on much higher levels of inventory. Whether due to sluggish demand, aggressive production targets, or weak incentives, these elevated days’ supply figures can hinder dealership performance.
With market volatility and potential tariffs looming, effective inventory management is a critical factor distinguishing OEMs. For dealers and investors, assessing franchise value now demands a deeper look at how well a brand supports operational stability.
Transaction Prices
According to J.D. Power and GlobalData, the average new-vehicle retail transaction price in July 2025 is projected to be around $45,000, an increase of approximately 2% from July 2024. This rise factors in stable MSRPs, tariff pressures, and a combination of manufacturer discounts, retailer profitability, and shifts in the mix of vehicles sold.
Incentive Spending and Profitability
Thomas King, the president of data and analytics at J.D. Power, discussed the factors impacting incentive spending and profitability in July:
“July results are also being impacted by lower-than-normal incentive escalation by manufacturers. Instead of discounts rising as they normally would at this time of year, incentive spending has edged down to 6.1% of MSRP in July from 6.3% in January [2025], reflecting the cost pressure that manufacturers are under due to tariffs.”
Despite this, total retailer profit per unit, encompassing vehicle gross and finance/insurance income, is projected at $2,257, a modest $23 increase from July 2024 but a $52 decline from June 2025. This drop in per-unit profitability considers a mix of higher sales volumes and sustained transaction prices, among other factors.
August 2025 Outlook
As tariff-related uncertainty persists, it is likely that supply chain, sales volumes, profits, and blue sky multiples will remain under pressure in the coming months. Mercer Capital expects the August 2025 SAAR to end up near the June 2025 SAAR. Subscribe to our Auto Dealer Valuation Insights blog to stay up to date on tariffs and other industry-relevant news updates.
Mercer Capital provides business valuation and financial advisory services, and our auto team helps dealers, their partners, and family members understand the value of their business. Contact a member of the Mercer Capital auto dealership team today to learn more about the value of your dealership.