June 2025 SAAR


The June 2025 SAAR came in at 15.3 million units, down 1.7% from last month but up 2.3% from June 2024. When looking at the year-over-year comparison, it is important to consider that June 2024 sales were impacted by the CDK software outage. As such, the year-over-year change in the SAAR presents the June 2025 performance in a better light than it would be without the impact of the 2024 CDK event.
The noticeable decline in the June 2025 SAAR continues the trend of softer sales after the pull-ahead effect seen in March and April, as consumers likely aimed to beat any tariff-related increases. As we discussed in last month’s blog, we anticipate that the auto industry may continue to experience a slower sales pace and tighter margins as the industry navigates the tariff environment. While tariffs have been extended to August 1st, it remains to be seen if a deal will be negotiated or if further extensions are coming.
Affordability has also been an issue for consumers, as persistently higher interest rates and increasingly longer loan terms have likely caused many consumers to hold off on big purchases in the short term. For more details on affordability, check out last month’s Overview of Auto Finance post.
Unadjusted Sales Data
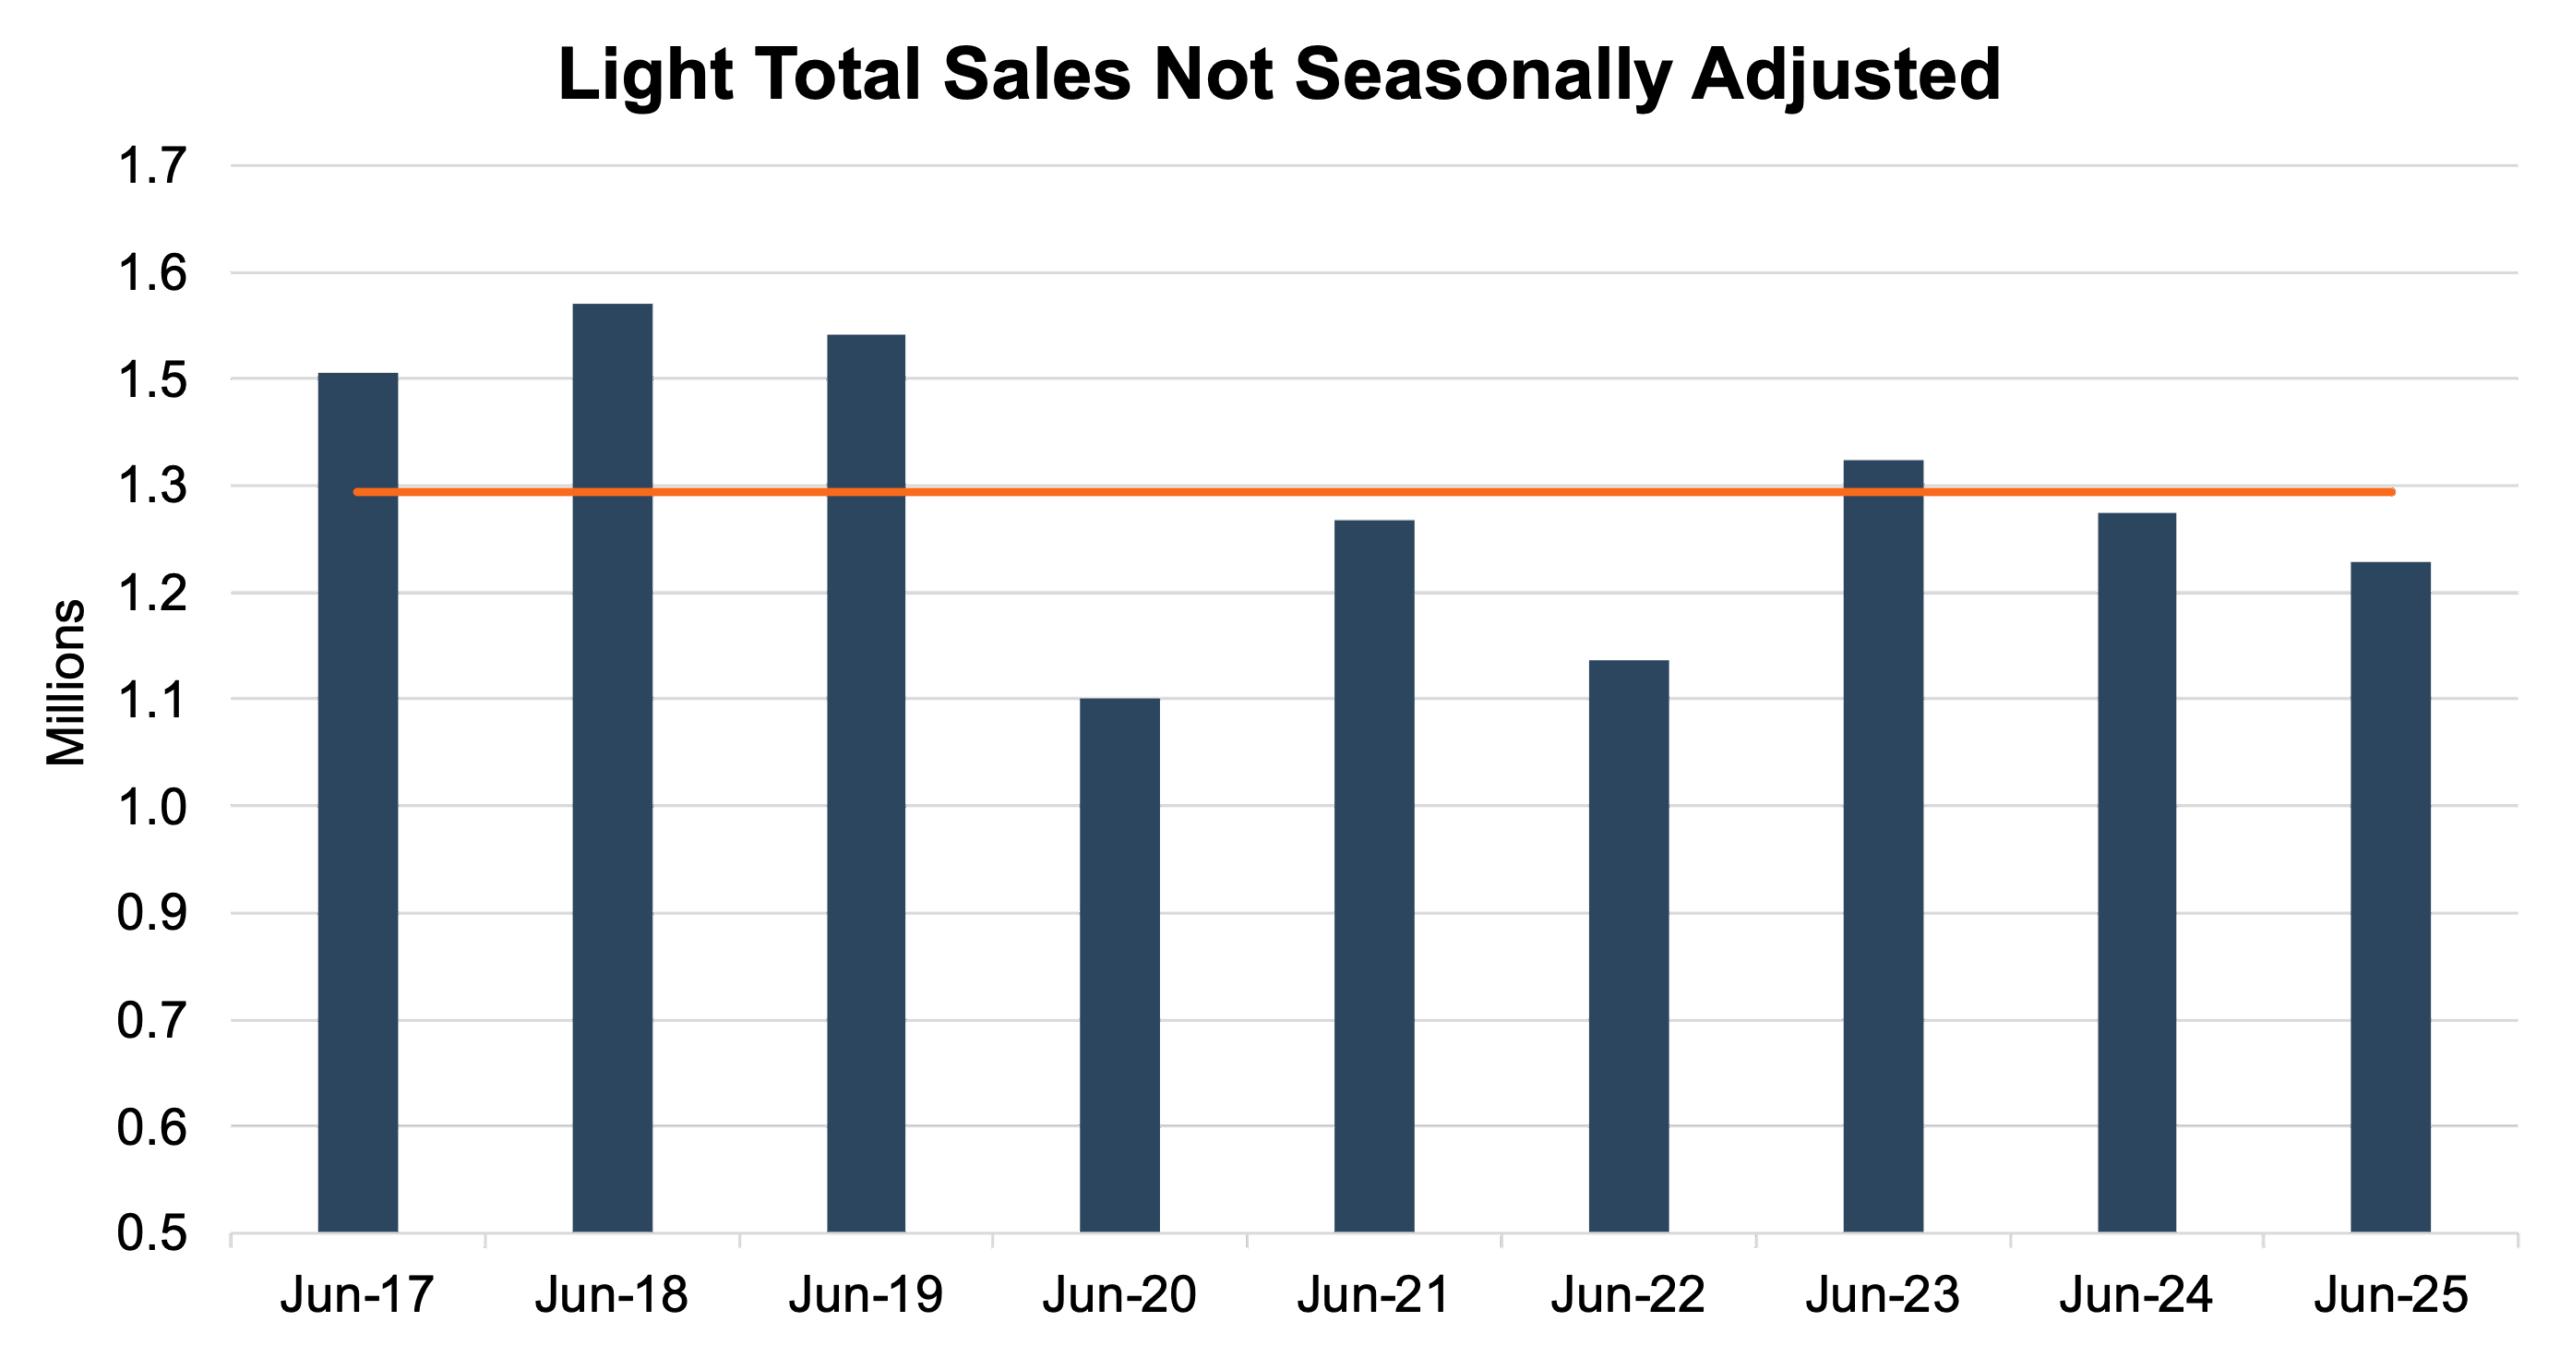
On an unadjusted basis, June 2025 industry sales finished at 1.25 million units, a 14.2% decrease from last month and a 4.2% decrease from June 2024. This can be partially attributed to two fewer selling days compared to June 2024, as well as the affordability factors discussed previously in this blog. This month’s unadjusted sales fell short of the nine-year June average of 1.33 million units (2017 – 2025) by approximately 79 thousand units. See the chart below for a look at unadjusted sales over the last nine Junes.
Inventory Metrics
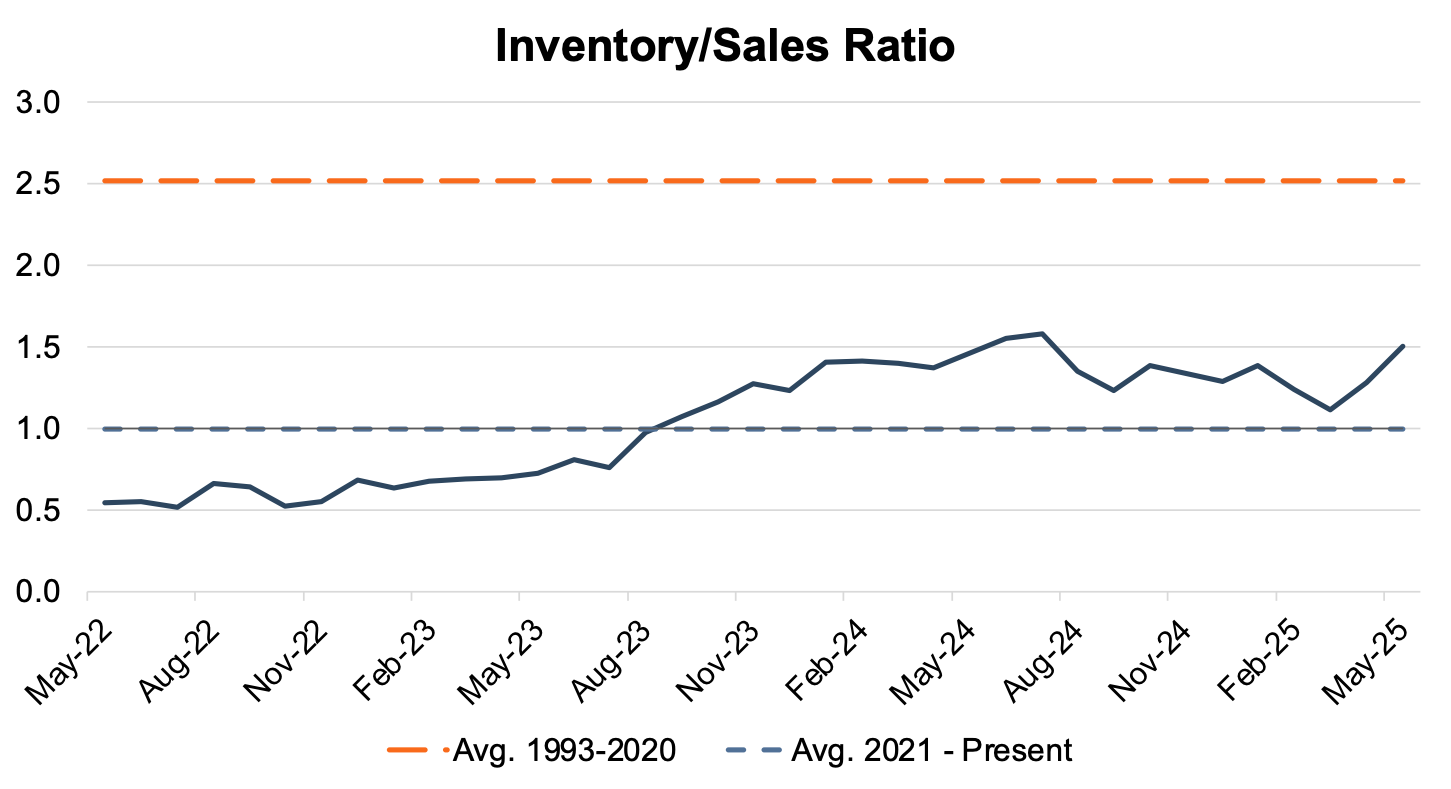
The industry’s inventory-to-sales ratio increased to 1.50x in May 2025 from 1.28x in April 2025. In the coming months, we expect the ratio to remain above 1.0x due to a slower sales pace across the country once higher-priced inventory starts hitting lots. The chart below presents the industry’s inventory-to-sales ratio over the last three years.
This month marks a shift in our inventory coverage. We are now using brand-level days’ supply data from Cox Automotive, which provides more granular insight into how manufacturers are managing their pipelines. While we’ll continue tracking industry-wide trends, this move allows us to explore the increasingly important reality that not all brands are operating in the same inventory environment, and those differences are influencing dealership profitability and valuations.
See the chart below for a look at days’ supply by brand in June 2025.
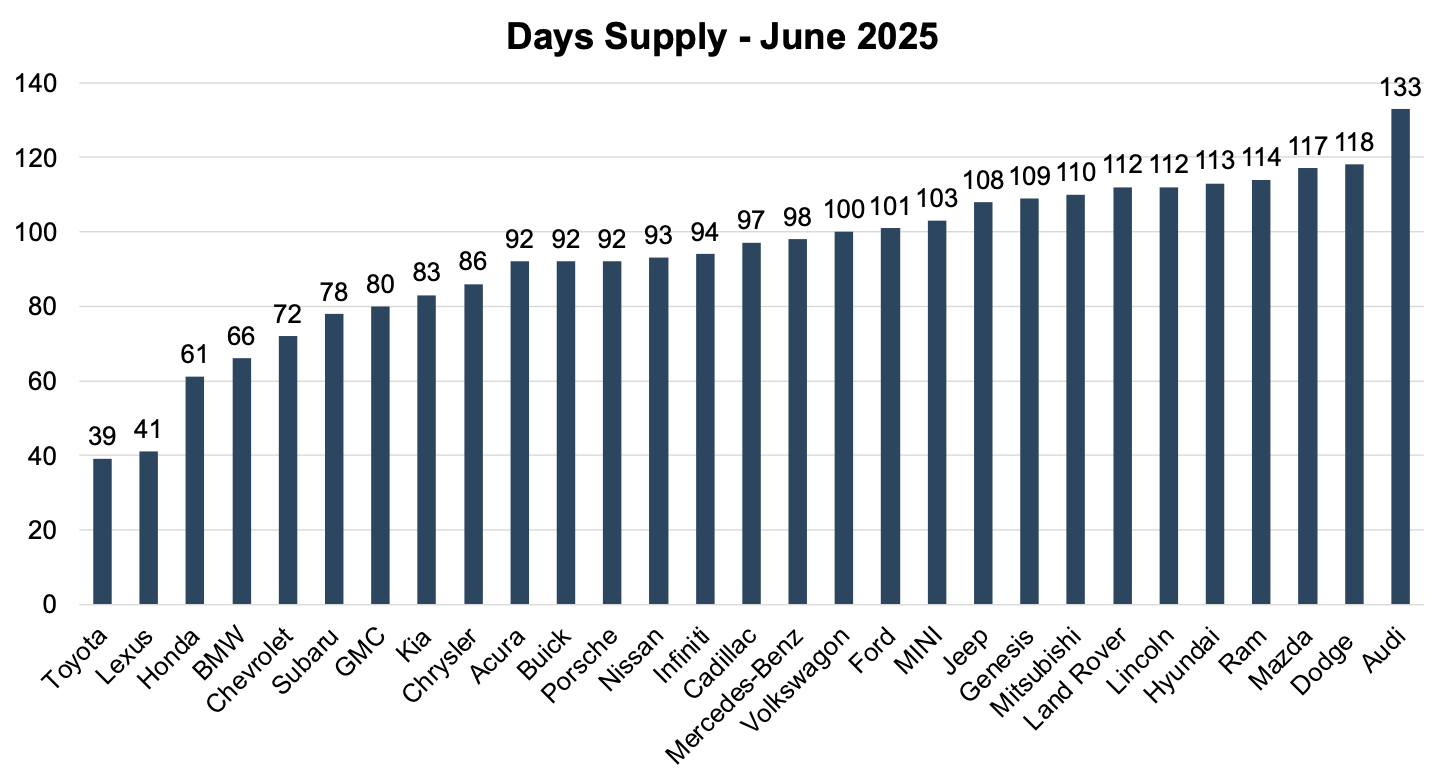
Toyota (39 days) and Lexus (41 days) continue to stand out for their disciplined approach to inventory management. These low days’ supply levels reflect faster retail turnover and tighter alignment between shipments and consumer demand.
In contrast, brands like Audi (133 days), Dodge (118), Mazda (117), and Ram (114) are sitting on much higher levels of inventory. Whether due to sluggish demand, aggressive production targets, or weak incentives, these elevated days’ supply figures can be a drag on dealership performance.
As the market remains in flux and tariffs loom in the background, how each OEM manages inventory is becoming a key differentiator. For dealers and investors, evaluating franchise value in the current environment requires a closer examination of how well a brand is supporting operational health.
Transaction Prices
Thomas King, the president of data and analytics at J.D. Power, discussed the factors impacting average transaction prices for new vehicles in June:
“…there has yet to be a material increase in new-vehicle MSRPs due to tariffs. While exceptions exist, MSRPs are generally remaining stable. Changes in the average transaction price of new vehicles are driven by the combination of manufacturer discounts, retailer profitability, and the mix of new vehicles being sold.
The average new-vehicle retail transaction price in June is expected to reach $46,233, up $1,400 or 3.1% from June 2024, but up only $77 or 0.2% from May.”
Incentive Spending and Profitability
J.D. Power notes that average incentive spending per unit in June 2025 is expected to be $2,727, up 3.5% from last month but up 1.5% from June 2024. Incentive spending as a percentage of the average MSRP is expected to come in at 5.4% for June 2025, a decrease of 0.1 percentage points from this time last year. This increase in incentive spending from the prior month marks a break from the years-long trend of declining incentives after the COVID-19 pandemic. The recent increase in incentives can be tied to manufacturers’ response to weakening sales numbers across the country, as the OEMs are trying to spur more consumer activity.
In this context, if dealers can maintain their volumes at a healthy level, then the unit-level economics remain strong. J.D. Power notes that the June 2025 total retailer profit per unit (includes vehicle gross plus finance and insurance income) is estimated to rise to $2,380, a $45 increase from June 2024.
July 2025 Outlook
Mercer Capital expects the July 2025 SAAR to end up near the June 2025 SAAR — above the 15 million mark — but perhaps a bit muted from the trendline we observed at the beginning of 2025. While tariff-related uncertainty persists, it is likely that supply chain, sales volumes, profits, and blue sky multiples will remain under pressure in the coming months. Subscribe to our Auto Dealer Valuation Insights blog to stay up to date on tariffs and other industry-relevant news updates.
Mercer Capital provides business valuation and financial advisory services, and our auto team helps dealers, their partners, and family members understand the value of their business. Contact a member of the Mercer Capital auto dealer team today to learn more about the value of your dealership.