In August 2016, we discussed bankruptcy and valuation issues related to royalty interest owners. We mentioned using the publicly traded market as one method to value royalty interests, specifically observing royalty trusts. As a primer for O&G royalty trusts, these trusts hold various royalty and net profit interests in wells operated by large exploration & production companies. These trusts have little in the way of operating expenses, have defined termination dates and can serve as an investment opportunity that provides exposure to oil and gas prices. This Motley Fool article, from 2014, explains the pros and cons of investing in this sort of vehicle.
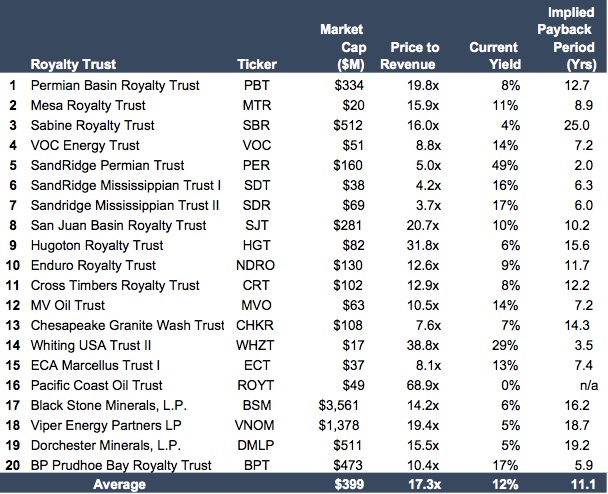
Market indications are available in the form of publicly traded oil & gas (“O&G”) royalty trusts. There are approximately 20 oil and gas focused royalty trusts publicly traded, as of the date of this article.1
Market Observations
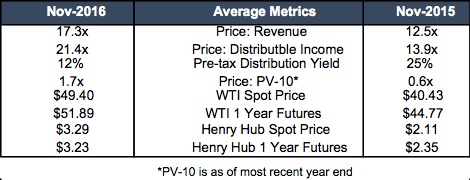
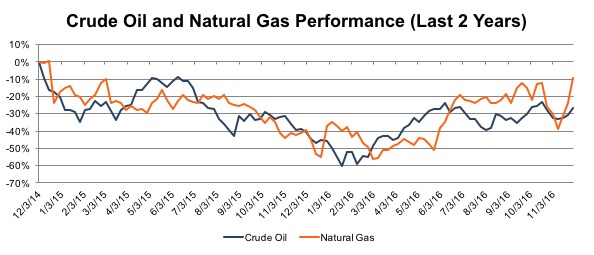
Royalty trusts, like the rest of the oil and gas industry, have been hit hard over the previous 29 months. Before the bottom fell out, oil traded as high as $106.86 in June of 2014 and plunged to a low of $29.05 in February of 2016. Since February, the price of oil appears to have found a new home around $50 / barrel. Here is a comparison of the 20 publicly traded royalty trusts’ metrics today versus one year ago.
Observations and Disclaimers:
- Price to revenue and price to distributable income indicate, on average, the trusts are more expensive now than a year ago. This is a flip from our August 2016 blog post when multiples were lower in July 2016 than July 2015.
- Yields were higher last year as trailing yields did not reflect the quickly falling market price.
- As of today, market prices have leveled off and annual distributions are comprised of a full year of lower royalty payments, resulting in lower yields compared to a year ago.
- Price to PV 10 is higher this year compared to last. The remaining observations are for commodity prices, both current and futures price for the 12 month contract.
- Disclaimer: no two of the above royalty trusts are alike. Differences abound in asset mix, asset location, term, and resource mix, just to name a few. In future blog posts, we will explore each trust individually and discuss their uniqueness.
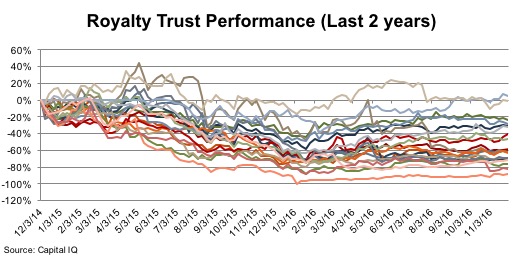 The above chart looks very similar to the performance of the price of oil and gas over the same time period. Royalty interest owners have seen their monthly payments move in the same manner, and possibly have not experienced the small rebound during 2016.
 Uncertainty is high as some operators have been forced to file bankruptcy after commodity prices have remained low for too long for them to survive. Three of the above 20 royalty trusts are tied to SandRidge Energy. In May 2016, SandRidge Filed for Bankruptcy Reorganization and Emerged from Bankruptcy in October 2016. During this time, the three royalty trusts: (1) SandRidge Mississippian Trust 12, (2) SandRidge Mississippian Trust II3 and (3) SandRidge Permian Trust4 experienced the following performance:
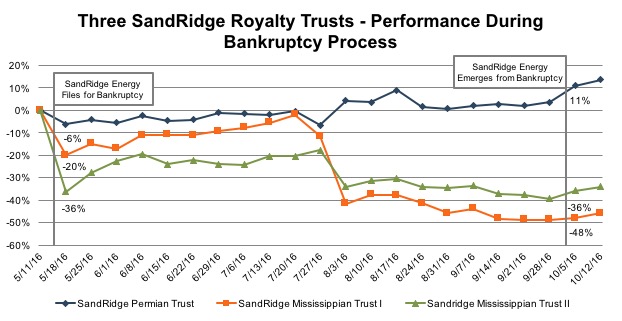 The popularity of the Permian Basin is nothing new this year. In oil and gas, location is key when trying to generate returns on invested capital. Even as the price of oil is near three year lows, transaction activity is high in this area of the country. Royalty Trusts appear to support the trend to try to get a piece of the very hot Permian Basin. Add on the reserve discovery in the Wolfcamp formation by the United States Geological Survey last month and it is clear that there is no other place to be drilling for oil right now. This attention appears to have spread into the royalty trusts. As the publicly traded price indicates, after SandRidge Energy files for bankruptcy, albeit “pre-arranged reorganization,” each of the three related royalty trusts decline. The price of the two trusts which do not own properties in the Permian Basin decline more than 20% initially after the bankruptcy filing while the SandRidge Permian Trust’s price declines only 6%. Upon emergence from bankruptcy, the trust with Permian related assets was up 11% while the two non-Permian related trusts were down more than 35%.
Depending on your situation, the current pricing environment may provide excellent planning opportunities as market prices are relatively low. With the Treasury Department attempting to change the way gift and estate planning can be performed, it is even more timely to execute a transfer plan. Contact Mercer Capital to discuss your needs in confidence and learn more about how we can help you succeed.
The popularity of the Permian Basin is nothing new this year. In oil and gas, location is key when trying to generate returns on invested capital. Even as the price of oil is near three year lows, transaction activity is high in this area of the country. Royalty Trusts appear to support the trend to try to get a piece of the very hot Permian Basin. Add on the reserve discovery in the Wolfcamp formation by the United States Geological Survey last month and it is clear that there is no other place to be drilling for oil right now. This attention appears to have spread into the royalty trusts. As the publicly traded price indicates, after SandRidge Energy files for bankruptcy, albeit “pre-arranged reorganization,” each of the three related royalty trusts decline. The price of the two trusts which do not own properties in the Permian Basin decline more than 20% initially after the bankruptcy filing while the SandRidge Permian Trust’s price declines only 6%. Upon emergence from bankruptcy, the trust with Permian related assets was up 11% while the two non-Permian related trusts were down more than 35%.
Depending on your situation, the current pricing environment may provide excellent planning opportunities as market prices are relatively low. With the Treasury Department attempting to change the way gift and estate planning can be performed, it is even more timely to execute a transfer plan. Contact Mercer Capital to discuss your needs in confidence and learn more about how we can help you succeed.


