Differing Perspectives on the Used Vehicle Market
Feast or Famine?
With Thanksgiving around the corner next week, we hope that everyone will be able to visit with family, share a meal with loved ones, and rekindle old traditions from holidays past. All of us are not immune from the headlines that speak to disruptions in the global supply chain on a daily basis. Undoubtedly, each of us has been inconvenienced with those supply shortages with consumer products, food, and essential goods that impact our daily lives. The automobile market is no different.
In a previous blog, we examined several key indicators for the entire automobile market incorporating the first six months of data. In this weeks’ blog, we offer commentary on the status of the used vehicle market and re-examine some of those metrics through third quarter data. Headlines persist describing inventory shortages, record transaction prices, record profitability and predictions for when conditions will return to normal. How do we make sense of all of it? What factors are contributing to the current conditions? Like the larger automotive industry as a whole, conditions can be described as the best of times and the worst of times, or feast or famine. Interpretation of the conditions can differ depending on the perspective of the consumer or the auto dealer. We examine some of the key used vehicle metrics and indicators and then discuss how we got here and where we are headed.
Prices
Feast for the Auto Dealers, Famine for the Consumer
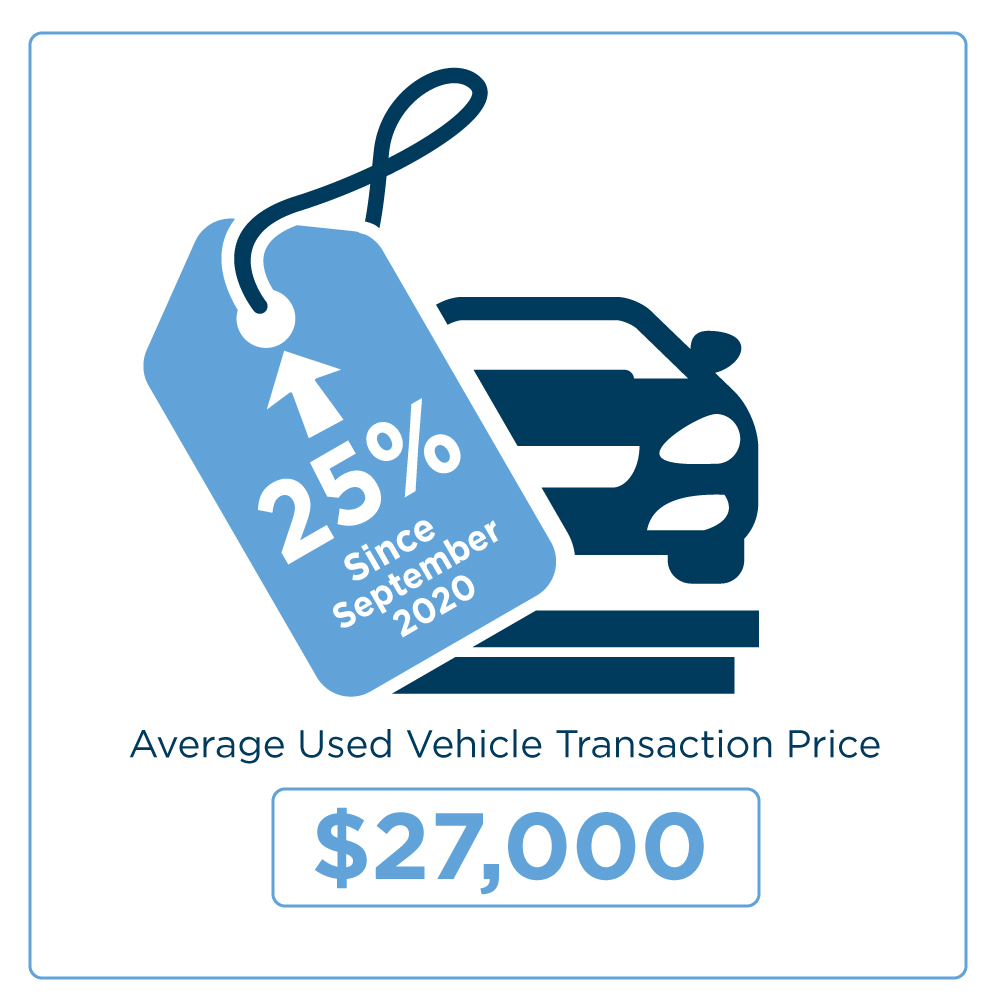
According to Cox Automotive, the average transaction price for a used vehicle topped $27,000 for the month of September. This figure represents the largest average transaction price for used vehicles on record and indicates a 25% increase from the average price of used vehicles just one year ago in September 2020. Most car buyers understand the historical notion that the value of a car depreciates immediately after you drive it off of the dealership lot. In 2021, this notion simply isn’t true for the time being. There are plenty of examples in the marketplace of used vehicles that are 1-2 years old with minimal miles (25-30K) that are selling for prices higher than the original sticker price of the new vehicle!
Gross Profit Per Unit Used Vehicle
Feast for the Auto Dealers, Famine for the Consumer
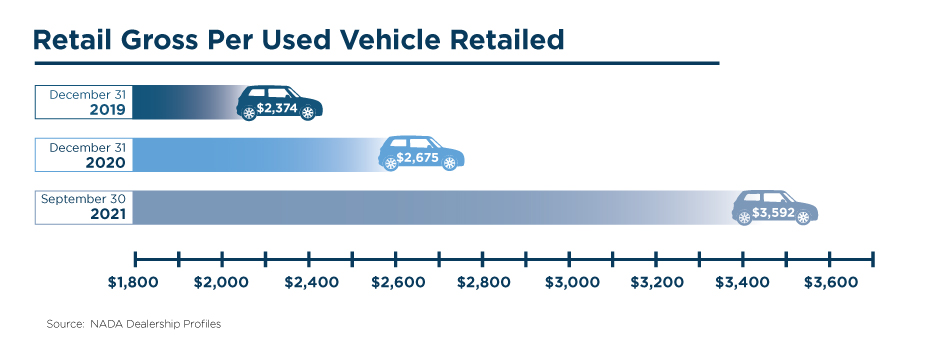
Of the department/profit centers for an auto dealership, historically, the new and used vehicle departments accounted for the largest contribution to revenue, but a substantially lower contribution to overall gross profit. According to the Average Dealership Profile from NADA, these departments typically comprised approximately 88-90% of revenues and approximately 52% of gross profits, with the remainder coming from fixed operations. Currently, these departments still comprise a similar percentage of total revenues but now comprise 60% of gross profits. This figure continues to climb as of September 2021 as reported by NADA. What is driving this increase? Rising transaction prices for used vehicles and, in turn, increased gross profit per unit (GPU). The graphic below details the current used vehicle GPU and the corresponding figures from the prior two year-ends.
Average Days’ Supply Used Vehicles
Famine for Auto Dealers and the Consumer
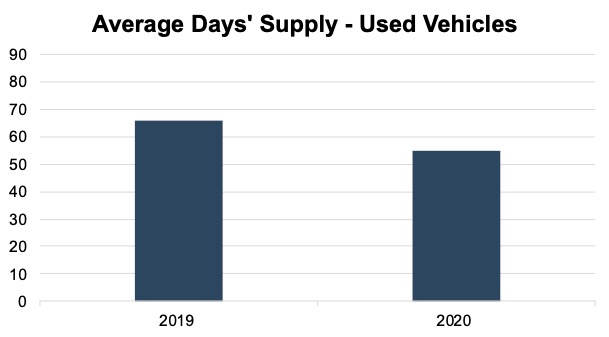
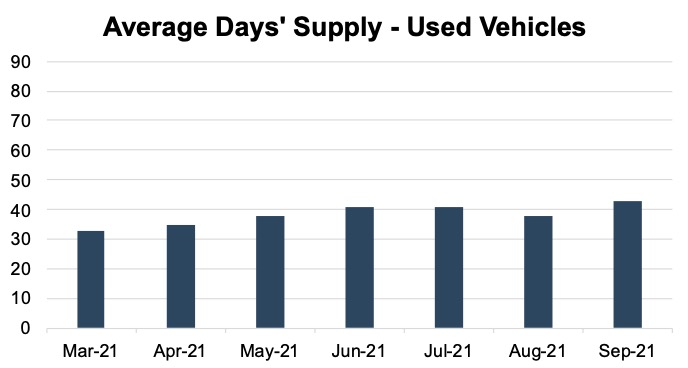
We’ve written about average days’ supply previously in this blog, but it serves as a key indicator of the level of supply, or in this case, the shortage of used vehicles in the market. Average days’ supply is calculated as the number of used vehicles in inventory or in the market divided by the average daily number of used vehicles sold. Historically, this figure ranged between 55 and 66 for 2019 and 2020, as seen in the graphic below. The average days’ supply for used vehicles has not slumped nearly as bad as the same metric for new vehicles and has shown signs of steadying to slight improvement.
Source: Cox Automotive
Through the early spring of 2021 and through September, this same metric cratered at 33 and has steadily maintained or slightly improved to 43.
Source: Cox Automotive
Sourcing – Where do Used Vehicles Come From?
To help explain the forces behind these metrics, let’s examine where used vehicles are sourced. Historically, used vehicles from an auto dealer were purchased from one of four areas: customer trade-ins, off-lease vehicles, fleet cars, and auctions.
Trade-Ins – With plant shutdowns, microchip shortages, and supply chain issues, the supply of new vehicle inventory has been more adversely affected than its used vehicle counterpart. Average days’ supply for new vehicles dipped into the low 20s and dropped even lower for many local auto dealers. With fewer new vehicles to purchase, the number of customer trade-ins are also lower simply due to transaction volume and inventory availability.
Off-Lease – Off-lease vehicles refer to a vehicle returned to a dealer at the end of its lease. Generally, off-lease vehicles have been gently used and tend to have lower mileage. Why are less leased cars being returned to the dealer? Most lease contracts have a clause where the consumer can purchase the vehicle at the end of the lease for a residual value. In most cases, the residual value is lower than the original value of the vehicle to reflect the depreciation of value.
As discussed earlier, the value of used vehicles is at/near record highs. Many vehicles have a current value greater than the anticipated residual value stated in the original lease contract. Customers with leases face two choices: purchasing their vehicle for the residual value or returning the vehicle to the dealer at the end of the lease. Facing the inventory shortage conditions on both new and used vehicles and the prospect that the current value of their vehicle is greater than the residual value, most consumers are choosing to purchase the vehicle at the end of the lease. While others may purchase their leased vehicle and sell immediately to realize the arbitrage opportunity between the current value and residual value, most then face the prospect of locating and purchasing a more expensive vehicle. In either case, fewer off-lease vehicles are re-entering the used vehicle market.
Fleet Cars – Fleet cars represent those vehicles sold to rental car companies, government agencies, or larger customer accounts. The trends affecting the current condition and the overall life cycle of these cars date back to the early days of the pandemic. In the Spring of 2020 with the advent of lockdowns and travel restrictions, rental car companies sold off much of their inventory which hit the used vehicle market at that time. Flash forward to the next 18 months that were characterized by plant shutdowns and lower sales by the OEMs in 2020, and then further inventory shortage issues caused by the lack of microchips and other factors in 2021.
Historically, OEMs and the industry operated on an average days’ supply of new vehicles between 60-75. OEMs and auto dealers prioritized fleet sales with the extra inventory, as these contracts typically consisted of lower margins despite higher volumes. With the excess inventory being removed from the market, OEMs and auto dealers are now prioritizing direct consumers with the available inventory because they can achieve higher margins and offer fewer incentives. Fleet sales, and specifically rental car companies, have never been able to fully replenish their inventories. In turn, rental car companies no longer possess aging inventory that generally would get replaced and sold back into the used vehicle market. As a consequence, some rental companies are seeking to source their own used vehicles from auto auctions.
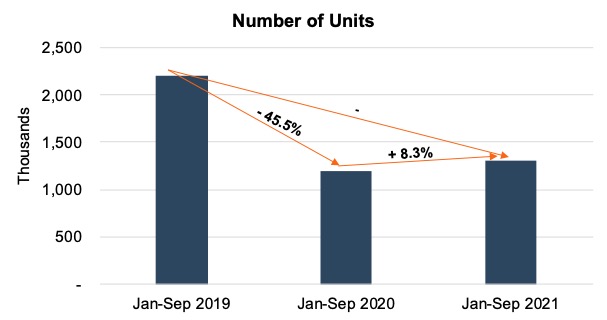
The graphic below depicts total fleet sales from January through September for 2019, 2020, and 2021 as reported by Cox Automotive. While total fleet units are up slightly in 2021 from the same period in 2020, this figure is misleading when viewed in the context of more normal fleet sales in 2019. In fact, current year-to-date fleet sales are down nearly 41% over 2019 figures.
Source: Cox Automotive
Auto Auctions – Auto auctions are another source of used vehicles. The presence of auto auctions is also circular to the life cycle of the automobile. Auction cars come from various sources, including local car dealers, private sellers, police impounds, and bank repossessions. As detailed earlier in this post, the volume derived from the first two events has decreased simply due to the lack of overall transactions. Current economic conditions and forgiveness or grace periods have also led to fewer vehicles from the latter two events. If auto auctions are obtaining fewer cars, then auto dealers have fewer cars to potentially source from the auto auctions and the cycle and shortages continue.
Predictions and Conclusion
How long can the good times (record profitability and margins) continue for the auto dealers and when will the bad times end for the consumer (high transaction prices and inventory shortages)? The simple answer is that they won’t continue like this forever, but no one knows when they will end. Many industry experts predict that the prevailing inventory and microchip shortages on the new vehicle side could last well into the first half or for the entire year in 2022 and beyond and will impact the used vehicle market for much of that time.
For the used vehicle market, analysts at Black Book are predicting retail sales for the remainder of 2021 will equal or eclipse the levels for the same time period in 2019. Some analysts believe profit margins and transaction prices for used vehicles are already showing signs of moderating, despite some of those metrics still peaking. As a backdrop, 2019 is often considered by many as the best year ever for retail sales of used vehicles.
For an understanding of how your dealership is performing along with an indication of what your dealership is worth amidst all of the noise, contact a professional at Mercer Capital to perform a valuation or analysis. Mercer Capital provides business valuation and financial advisory services, and our auto team helps dealers, their partners, and family members understand the value of their business and how it is impacted by economic, industry, and financial performance factors.
 Auto Dealer Valuation Insights


