First Half 2021 Review of the Auto Dealer Industry
What Are Key Statistics Saying?


As we enter into the second half of 2021, first half statistics are being released and second quarter earnings calls are on the horizon for the public auto companies. We’ve all read the headlines of the auto dealer industry in 2021: heightened profitability, historic gross profits per unit and soaring retail sales prices for new and used vehicles, and inventory shortages and challenges caused by plant shutdowns and the microchip shortage. What are some of the key statistics saying about the current and future health of the auto dealer industry? Have they peaked, are they continuing to increase or beginning to decline, and/or how long will the current conditions hold?
Back in December, we analyzed the state of the auto dealer industry through the use of various statistics/metrics: Retail Gross Profit Per Unit – New Vehicles, Retail Gross Profit Per Unit – Used Vehicles, and Used to New Vehicle Sales Unit Ratio. In this post, we revisit and examine those statistics through the first half of 2021 and discuss other key statistics including Average Days’ Supply, Fleet Sales, and Vehicle Miles Traveled.
According to Dealership Profiles reported by NADA, average dealerships have posted pre-tax earnings at 5.1% of revenues as of May 2021 (most recently published data at the timing of this post). This figure has climbed through the start of 2021 and is higher than any reported annual figure since 2010, (when the NADA began publishing the data). How long can this continue and what are the key drivers of the historic profitability?
New Vehicles
The sale of new vehicles continue to be impacted by imbalances between supply and demand. While auto dealers are selling fewer new vehicles, the average selling price and the retail gross profit per unit (“GPU”) are at all-time highs.
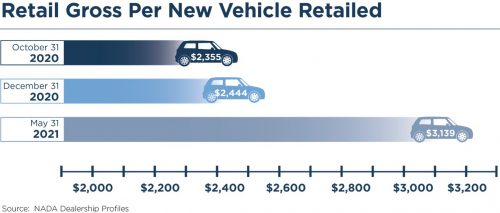
Let’s revisit retail gross profit per new vehicle: the numerator is gross profit achieved on the retail sale of new vehicles (as measured by the retail selling price less the cost paid to the manufacturer to acquire the vehicle) and the denominator is the total number of new vehicles retailed (fleet sales are excluded).
As seen in the graphic below, the new vehicle GPU rose throughout late 2020 and has continued that rise through May 2021, to a total of $3,139 per unit.
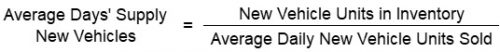
New vehicle GPU has risen every month in 2021, but will/can it continue? To answer that question, let’s start with the average days’ supply of the new vehicle equation.
Average days’ supply is a metric used to measure the amount/supply of new vehicles that either an auto dealership or the auto dealer industry as a whole holds in relation to the average daily demand. The ratio is calculated by first determining the average monthly daily units of new vehicles by taking the prior month’s or average month’s unit sales divided by 30 days to arrive at average daily units. Finally, the number of new units in inventory at any given point in time is divided by the average daily units to determine the average days’ supply. This ratio is tracked on both new vehicles and used vehicles.
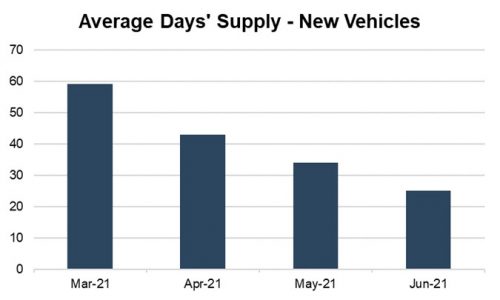
Historically, the auto industry operated at an average days’ supply for new vehicles around 60 days. Average days’ supply on new inventory continues to plummet in 2021, reaching a low of 25 days’ supply as of June 2021. At the two state auto conventions that we attended last month, every auto dealer that we spoke with reiterated these conditions. It was very common to hear dealers state inventory unit numbers in the single digits for most of their franchise’s best models.
Industry experts are predicting that July numbers will continue to follow these trends. July sales are expected to decline due to a lack of inventory, putting downward pressure on both the numerator and denominator.
If the average days’ supply for new vehicles continues to fall, that means supply is falling faster than demand. Some early highlights from the Q2 earnings calls from the public auto companies indicate that they are experiencing average days’ supply less than 20 days and in some extreme cases, less than 10 days.
New vehicle production and inventories are not anticipated to stabilize until the latter part of 2021 or perhaps not until 2022.
In the next few months, the lack of supply will eventually cut into the heightened profitability that auto dealers have experienced for the first half of 2021.
Even if GPUs are high, eventually such a decline in volume will necessitate a decline in overall gross profit levels, even if margins remain solid.
It will be interesting to see how the OEMs respond to new vehicle production and average days’ supply when plants and conditions return to normal. The industry has proven it can operate more efficiently at leaner levels of inventory, but will the OEMs return production to the historical levels of 60 average days’ supply? While profits are higher, consumers are unlikely to be as understanding to the lack of inventory after the difficulty of reopening post-pandemic is solved.
Used Vehicles
Like new vehicles, used vehicles have also been impacted by supply and demand. Demand for used vehicles has increased rapidly due to shortages of new vehicle inventory and also changing consumer preference for those impacted financially by the pandemic.
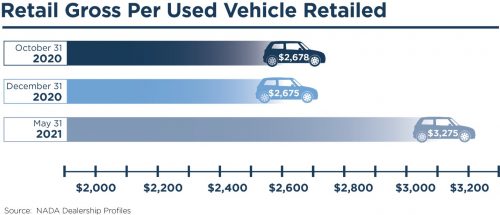
According to Cox Automotive, the average retail price of a used vehicle climbed to an all-time high above $25,000 for June 2021. As a result, auto dealers are experiencing record highs for retail gross profit per used vehicle.
GPU for used vehicles is calculated the same as new vehicles discussed earlier, just for used vehicles. As seen in the graphic below, the used vehicle GPU rose in late 2020 and continued to rise through May 2021, to a total of $3,275 per unit.
Used vehicle GPU has also risen every month in 2021, but will/can it continue? To answer, we again turn to average days’ supply.
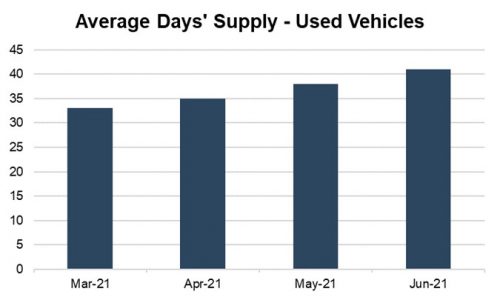
According to data published by Cox Automotive, the average days’ supply of used vehicles ranged between 55-66 as seen by actual data from November 2019 (pre-pandemic) and December 2020 (during the pandemic). Average days’ supply on used inventory has shown signs of improvement from a low of 33 units in March 2021. June 2021 levels have risen to 41 days supply as seen below.
The bigger impact for auto dealers continues to revolve around sourcing for used vehicle units.
Historically, auto dealers have sourced used vehicles from trade-ins, purchasing wholesale units at auction, buying back rental car fleets, and purchasing off-lease vehicles.
With fewer new vehicle sales, there are fewer trade-ins. Sourcing vehicles at auction can be tricky for auto dealers in a market where used vehicle prices are at all-time highs and will likely revert back to normal at some point. Dealers must be cautious not to purchase large amounts of used vehicles at these elevated prices for the fear that they won’t be able to sell all of those units before prices return to more normal levels.
As we will discuss later, the number of used vehicles available from rental car fleets has been drastically reduced from historical levels. Finally, there are fewer off-lease vehicles available for repurchase as customers are choosing to purchase those vehicles outright once the lease term ends.
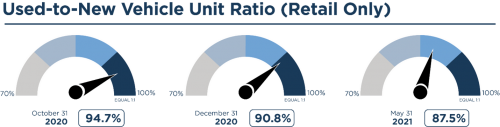
As discussed in our December post, the ratio of used vehicles to new vehicles sold approached 1:1 as dealers experienced heightened GPUs on both sides. That ratio continued to climb in the early part of 2021 topping out at 98.2% in January but has declined slightly to 87.5% in May 2021.
Historically, the gap between GPU earned on used vehicles to new vehicles was wider than it has been in recent months. Now auto dealers are seeing margins nearly as high on new vehicles. This ratio continues to be impacted by shortages in inventory supply, increased retail prices, and uncertainty of financial constraints caused by the pandemic.
We can think of two potential demand-related reasons GPUs earned by dealers on new vehicles are catching up to used vehicles. Surging auto prices have made it into the headlines; consumers continuing to shop likely have some level of inelastic demand and if they have to pay heightened prices, they may as well pay a little more to get a new vehicle. Also, with the “K-shaped recovery” we’ve seen during the pandemic, it’s possible those with more disposable income, who may be more likely to buy a new vehicle than a used vehicle, are composing a greater percentage of buyers, tilting demand and thus profits, towards new.
Fleet Sales
Fleet sales consist of sales to large rental car companies, commercial users and government agencies.
Historically, fleet sales allowed auto dealers to sell surplus inventory and to sell larger blocks of units at one time. While fleet sales typically occurred at reduced margins compared to retail sales, they allowed auto dealers to put more vehicles in service to hopefully benefit the fixed operations of an auto dealer as those vehicles will eventually require service maintenance and parts. Auto dealers anticipate that buyers of new vehicles will continue to return to the same dealership for those services during the lifetime of the warranty period and hopefully beyond.
During the height of the pandemic, fleet sales declined significantly. Rental car companies weren’t just canceling orders, they actively sold off their existing fleet to build up cash as cities endured temporary shutdowns and much of domestic travel was halted or significantly curbed. While travel has returned in the second quarter of 2021, overall fleet sales remain depressed.
As discussed earlier, auto dealers no longer have excess inventory, and so OEMs are prioritizing all the vehicles they can produce to be sold at heightened retail prices and gross profit margins to individuals.
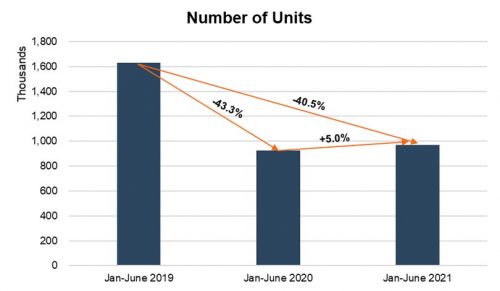
Fleet sales for the first half of the year totaled 969,751 units according to Cox Automotive. This figure represents an increase of nearly 5% compared to the same period in 2020 as demand has increased. However, comparisons to 2020 are not as meaningful due to the interruptions in the auto dealer industry caused by the pandemic. For a truer comparison, 2021 fleet sales represent a decline of over 40% from the same six month period in 2019 as seen below.
So far, auto dealers have not been fazed by the lack of fleet sales. Perhaps the biggest impact of fleet sales has been felt by consumers.
If anyone has traveled recently and tried to obtain a rental car, you likely have experienced an overall lack of supply and a dramatic increase in rental car prices.
The impact felt by the fleet market on auto dealers has been on the used vehicle side of operations. While rental car companies sold off large portions of their fleets in 2020 with the lack of travel, they have not been able to replace that inventory as travel demands have increased. In turn, rental car companies are currently no longer a source of used vehicle units for auto dealers since those purchases were pulled forward in 2020.
It will be interesting to see how these conditions evolve over the latter half of 2021 and 2o22 as manufacturing begins to return to normal from the OEMs.
Vehicle Miles Traveled
Another key indicator that portrays the health of the automotive industry is the number of miles driven or vehicle miles traveled (“VMT”). As with the number of vehicles in service, the number of miles driven contributes to the fixed operations of an auto dealer as vehicles require more parts and service as they are driven more frequently or for longer distances. Increased miles will also lead to the eventual purchase of a new vehicle either from new or used vehicle inventory.
VMT has been tracked since 1971, and a graphical view of the rolling 12-month average can be seen below.
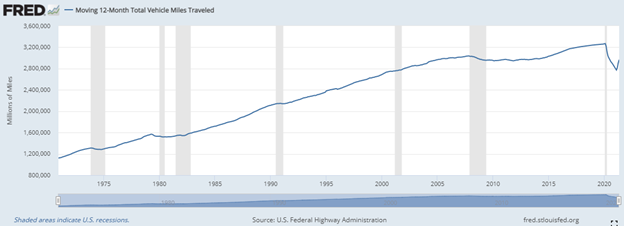
Over time, VMT has generally increased as the population has grown and more vehicles have been put in service. Since 1971, there have only been a few occasions where the rolling-12 month average has declined, which as noted above, tend to correlate with recessions: 1974, brief periods in the late 1970s and the early 1980s, the Great Recession in 2008 and 2009, and the pandemic in 2020.
During the height of the pandemic, the rolling-12 month VMT average dropped below 3 trillion miles for the first time since mid-2014 and even below 2.8 trillion for the first time since the early 2000s. The rolling-12 month average bottomed out in February 2021 at approximately 2.77 trillion miles and has steadily climbed back up to 2.97 trillion miles as of May 2021.
During the pandemic, a report from KPMG highlighted some of the factors impacting the VMT and also hinted at longer-term trends that could eventually push that figure back up to historical levels. Obvious factors from COVID-19 included temporary stay-at-home orders and restricted travel. As the pandemic continued, work and commute habits also changed as more individuals either worked from home initially, or others have continued to work from home in some capacity. These behaviors drastically contributed to fewer and shorter work commutes. An additional factor impacting VMT was fewer shopping trips. Digital platforms and e-commerce continue to grab market share from traditional shopping trips to the store. This phenomenon was already occurring prior to the pandemic but continues to persist as some consumer behaviors may have been permanently altered due to long-term health and safety concerns.
Is it all bad news as far as VMT is concerned? As mentioned above, the rolling-12 month average has been steadily climbing since January 2021. Shutdowns and stay-at-home orders have all mostly expired and there is pent-up demand in domestic travel.
As a result of the pandemic, more people could eventually decide to move out of larger metropolis areas into smaller suburbs. Moving out of the city could create longer commute times and miles driven. Additionally, people may continue to avoid public transportation and rideshare services due to the health impact scares of the pandemic. Both of these trends could lead to more individuals purchasing vehicles, which would eventually contribute to more miles driven.
Conclusions
The first half of 2021 has been a memorable one for auto dealers highlighted by all-time profitability, heightened gross margins on new and used vehicles, and shortages of new and used inventory. How long will these trends continue and have some trends already shown reversion back to normal levels?
As we’ve discussed, certain metrics such as gross margins per unit continue to rise, while others such as average days’ supply of used vehicles, overall auto sales, and vehicle miles traveled appear to be trending toward historical levels. Industry experts are mixed on predicting when inventory conditions stabilize; some indicate later this year, while others indicate it could be 2022 before inventory/supply issues return to normal.
For an understanding of how your dealership is performing along with an indication of what your dealership is worth amidst the noise, contact a professional at Mercer Capital to perform a valuation or analysis.