Measuring Up: Evaluating Your Auto Dealership Against Benchmark Metrics


In a strange year of oddities, 2020 has all of us constantly evaluating life’s basic truths. Market conditions vary drastically across all industries and even geographically within the same industry due to local government restrictions. It’s critical for auto dealers to continually analyze all aspects of their business and be ready to capitalize on industry trends. We previously discussed the use of the NADA dealership profiles as a useful tool to examine timely monthly data based on averages or dealership type. Three specific metrics in the data have reached their highest level since the data was originally published in 2012: new vehicle retail gross profit per unit, used vehicle retail gross profit per unit, and used-to-new vehicle unit ratio.
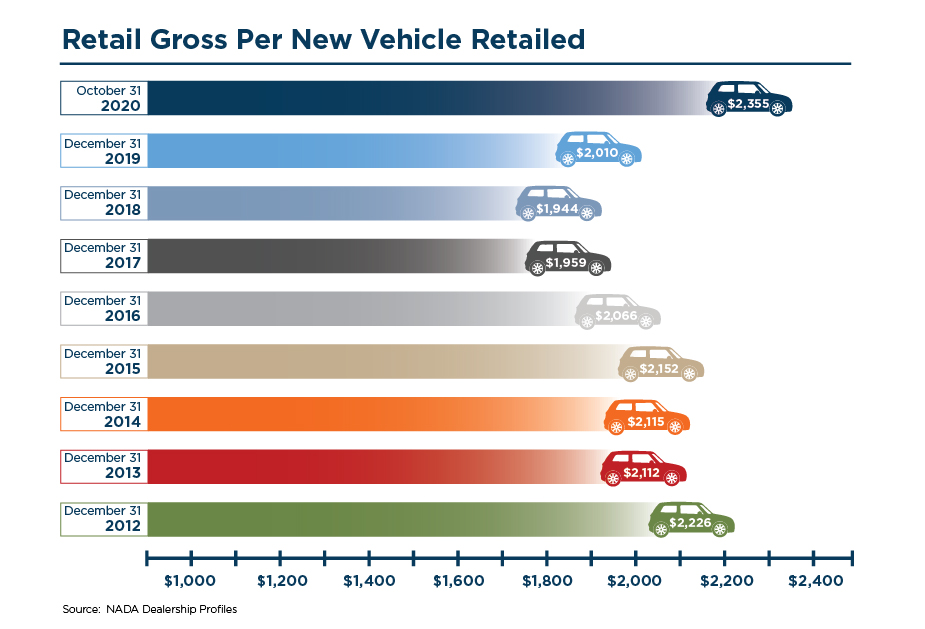
Retail Gross Profit Per New Vehicle
This metric considers numerous factors. The numerator is gross profit achieved on the retail sale of new vehicles and is measured by the retail selling price less the cost paid to the manufacturer for the dealership to acquire the vehicle. Industry professionals also often refer to this metric as “front-end margin” meaning front of the showroom and not including elements of fixed operations. The denominator is the total number of vehicles retailed, or new vehicles sold less fleet sales which, as we’ll discuss in a future post, is subject to different operating environments. Over time, auto dealers’ new vehicle gross margins have been compressed as a percentage of retail sales price as consumers have become more knowledgeable about manufacturer costs and sticker prices in the information age. Dealerships aim to create long-term value by placing more new vehicle units on the road in hopes of the continuing service revenue that results from miles driven. These fixed operations tend to be higher margin, which aids the overall gross margin of the dealership. Though as noted above, this is not captured in new vehicle gross margin.
As of October 2020, retail gross profit per new vehicle or new vehicle gross profit per unit (“GPU”) climbed to $2,355 for the average dealerships as defined by NADA. This eclipses a previous high of $2,226 achieved in 2012. The year-to-date figure represents a nearly $280/unit increase over the average figure of $2,076 from 2012 through 2019. The chart below displays the annual new vehicle gross margin from 2012 through the current year-to-date.
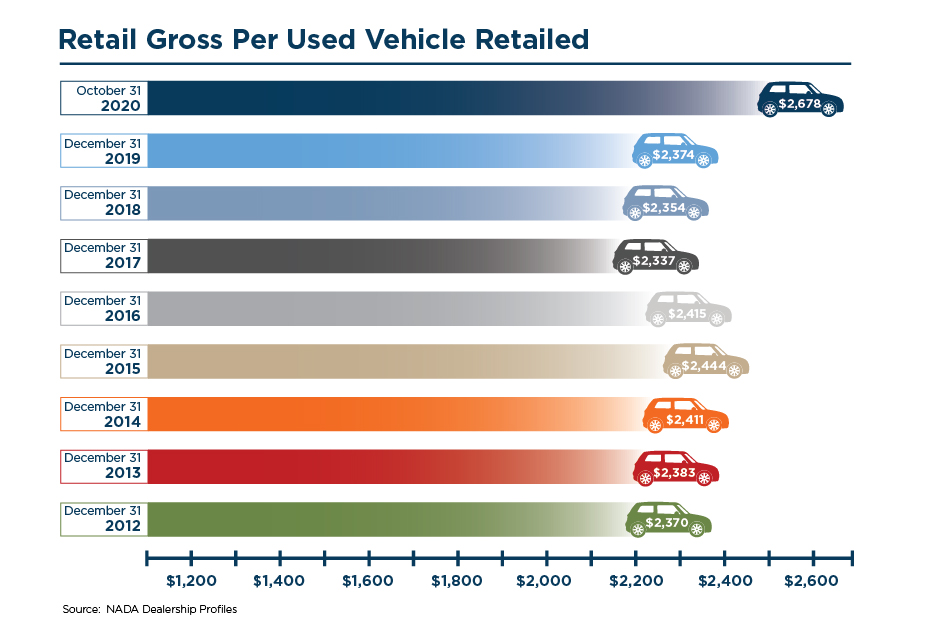
Retail Gross Profit Per Used Vehicle
Like new vehicle GPU, this metric refers to the gross margin achieved on the retail sale of a used vehicle and is measured by the retail selling price less the cost paid to acquire the vehicle divided by total units retailed. Similar to the new vehicles retailed which excludes fleet sales, it should be noted that this metric refers to retail sales only and does not include used vehicles for wholesale. Like its new vehicle gross profit counterpart, this metric has also climbed to its highest point in the observed period, currently at $2,678 per unit. We have previously written about several factors driving this metric including the heightened performance of the used vehicle market in the pandemic due to production shortages and shipment delays for new vehicles as manufacturers have experienced partial shutdowns. Low supply leads to higher prices, and dealers have been able to capture their share of this margin. The year-to-date figure represents a nearly $300/unit increase over the average figure of $2,386 from 2012 through 2019. With rising profitability over lower volumes, it’s clear why this figure is reaching all-time highs. The chart below displays the annual used vehicle gross margin from 2012 through the current year-to-date.
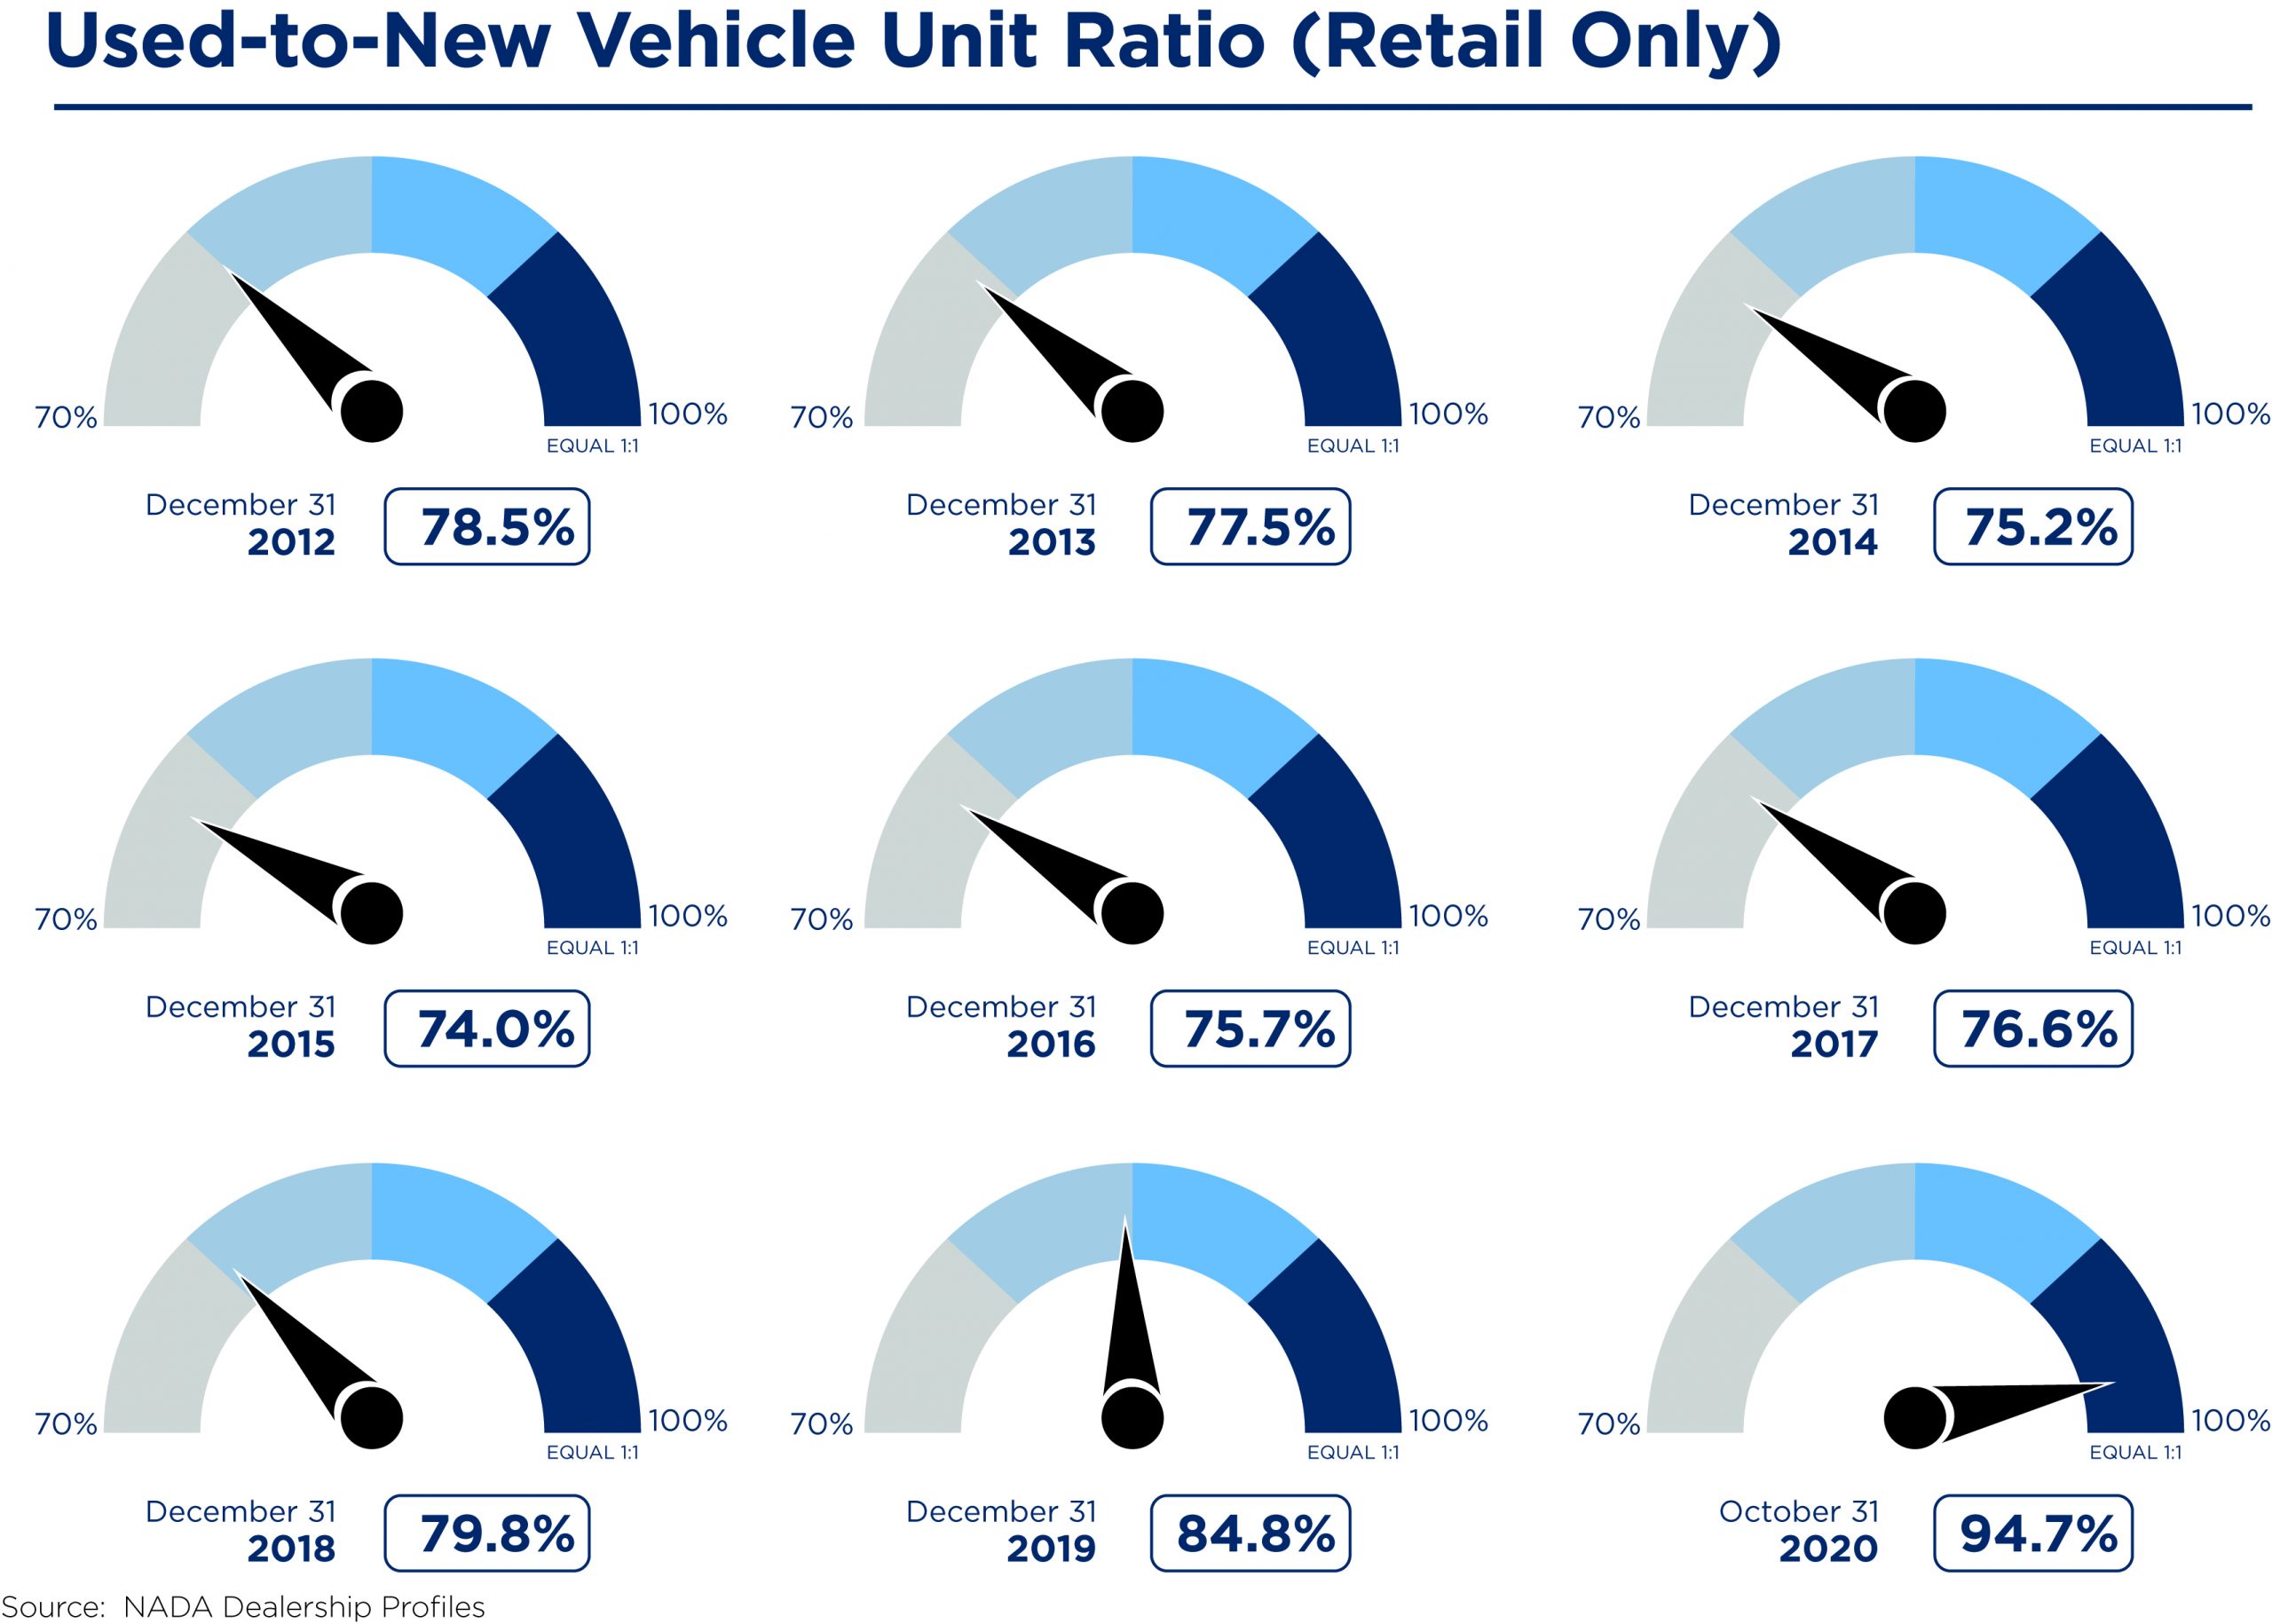
Used-to-New Vehicle Unit Ratio
With near-record levels of gross profit per new and used vehicles, how has that affected the product mix of vehicles sold by dealerships? The used-to-new vehicle unit ratio measures the amount of used retail units divided by new retail units. This ratio or product mix held fairly stable from 2012 through 2018 ranging from approximately 75% – 80%. Over the last year and a half, this ratio has climbed to 84.8% at the end of 2019 and peaked at 96.3% for October 2020. Used vehicles have become more profitable and have been more available to dealers at times in 2020. This ratio has reached an almost 1:1 relationship. The figure below displays the annual used-to-new vehicle unit ratio from 2012 through the current year-to-date.
There are elements of both supply and demand in this figure. As noted in the previous charts, dealers earn more gross profit per used vehicle retailed than new vehicles. That means dealers get more bang for their buck when the used-to-new ratio approaches 1:1. However, customers are historically attracted to franchised dealerships because they want a specific make or model. With the reduction in new vehicle supply, it appears dealers have effectively pivoted their customers from new vehicles to used vehicles rather than losing the sale when their preferred option isn’t in stock.
Another factor is likely in play, however. While supply is shifting towards used, demand is as well. With spikes in unemployment this year and the uncertainty surrounding job security for many, consumers are less likely to be able to afford the higher sticker prices of new vehicles, substituting to used as a more reasonable alternative.
Potential Impacts and Conclusion
How is your dealership measuring up to these metrics and what impact could they have on the value of your dealership? As always, comparison with industry data should be viewed with some caution as it may not pertain directly to your dealership or the economic conditions experienced in your area. Nonetheless, the levels of these three metrics reflect the auto dealer industry’s ability to adapt to the challenges of 2020.
The more important question for these metrics and for the valuation of your dealership, is how sustainable are these metrics for the long-term? The historical graphical information for each suggests that these figures will revert back to previous levels at some point. A majority of our projects for litigation and corporate valuations involve evaluating the expected annual earnings of the dealership for the future. Often, we examine these various metrics and the overall profitability and performance of the dealership over a longer historical period of time than just the latest year to determine the sustainability and future expectation. Just like dealers wouldn’t want to sell their business after a down year, valuations can become too lofty if an outlier year is effectively forecasted as the new normal.
For an understanding of how your dealership is performing along with an indication of what your dealership is worth, contact a professional at Mercer Capital to perform a valuation or analysis.


