January 2023 SAAR


The January 2022 SAAR was 15.7 million units, which is 18% higher than December 2022 and 4% higher than this time last year. This month’s data release revealed the fifth straight month of year-over-year improvements in the SAAR, supporting that inventory levels are actually recovering from the throws of persistent supply chain disruptions.
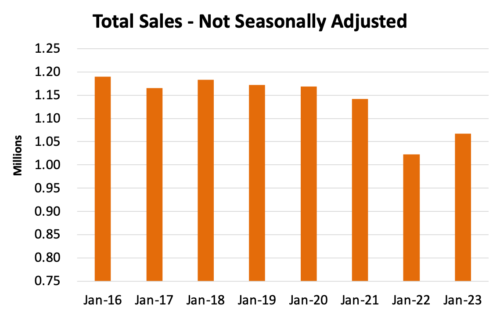
On a month-over-month basis, an 18% increase in the SAAR from December may seem sudden, but December is typically the highest-selling month of the year (with the smallest seasonal adjustment), and January is typically one of the lowest-selling months of the year (with one of the largest seasonal adjustments). When you strip out the seasonal factor to the SAAR, January’s unadjusted sales (1,066,000 units) were well below December’s (1,319,000 units).
However, despite January’s position as a low-selling month, the last month’s data certainly supports the sales recovery narrative when compared to January 2022 and pre-supply chain disrupted figures. In order to compare the last several Januarys, see the chart below for a look at the previous eight years of unadjusted sales:
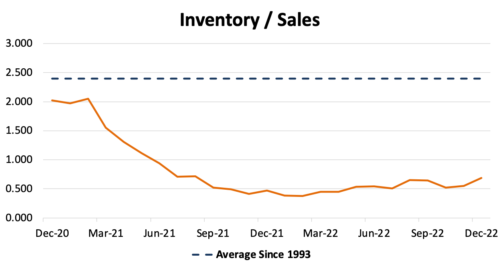
Inventory to Sales – Pent-Up Demand Showing Its Face?
As we have already hinted, the health of the automotive supply chain has been improving for months now and is approaching a more robust recovery over the next year. However, despite increasing units on the ground, the industry’s inventory to sales ratio remains well below the long-run average of 2.4x.
Thomas King, president of the data and analytics division at J.D. Power, posits that fleet sales could cause persistently low inventory on the lot as a percent of sales. In the most recent LMC Automotive Forecast, King says:
“While retail inventory levels are generally rising, several manufacturers are directing a larger portion of their increased production towards fleet customers. Fleet sales have been more heavily inventory constrained than retail sales during the past several years, resulting in significant pent-up demand. Rising production levels now allow manufacturers to better support their fleet customers while maintaining retail inventory levels.”
Perhaps pent-up demand, the magnitude of which has been somewhat of a mystery throughout 2022, will become more apparent as it plays itself out in the coming year. While we discussed the possibility that pent-up demand is not as strong as many experts predicted last July, fleet sales were not an area expected to make a large difference at this point in the recovery timeline. How long will it be before fleet sales’ pent-up demand is satisfied? Is there additional pent-up demand from consumers baked into the market, or have deteriorating economic conditions temporarily eliminated consumers at the margins? The longer that the industry’s inventory to sales ratio remains depressed, there is support for the idea that pent-up demand is still playing itself out.
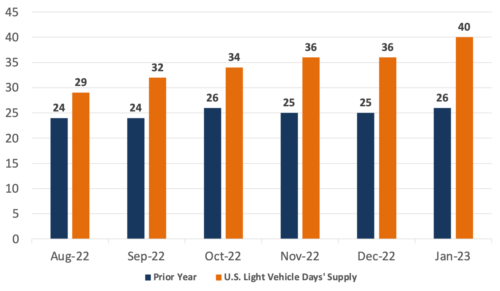
Domestic Days’ Supply of Inventory
If we take fluctuating sales out of the equation, raw inventory numbers tell the recovery story more clearly. In fact, January 2023 marks the first time in recent memory that Days’ Supply reached 40. While this is certainly noteworthy, it is important to mention that the pre-pandemic average days’ supply averaged around 70. See the graphic below for a look at domestic light vehicle days’ supply for the last several months (sourced from Wards Intelligence):
Transaction Prices and Incentive Spending
The average new vehicle transaction price over the last month is expected to be $46,437, which is 4.2% higher than this time last year and an all-time January record. According to J.D. Power, record transaction prices mean buyers are on track to spend nearly $39.9 billion on new vehicles this month—the highest level ever for January and an increase of 2.4% from January 2022. Looking ahead, we do not expect new vehicle transaction prices to fall anytime soon, but we do expect the rate of increases to slow down in 2023.
One reason for this prediction is the expensive models that manufacturers have chosen to prioritize throughout 2021 and 2022. SUVs and trucks have been consumers’ most desired vehicle classes over the last few years and a production concentration in these vehicles has been a major reason for elevated transaction prices. As more lower-cost models are produced throughout 2023, perhaps the average transaction price for a new vehicle will cool off as consumers trade down.
Average incentive spending per unit is expected to total $1,260, up modestly from December 2022. This marks the third month in a row where incentive spending per unit has come in over $1,000 after six straight months of sub-$1,000 incentive spending per unit. This trend will likely continue, but we can expect this number to stagnate or even modestly fall if a material change in the sales mix takes hold. Incentive spending per unit can be measured as a percentage of MSRP, which means that a larger number of lower-cost models will likely be accompanied by lower incentive spending per unit.
February 2023 Outlook
Mercer Capital’s outlook for the February 2023 SAAR continues to be optimistic. Industry supply chain conditions are improving. However, sales volumes will likely continue to be closely tied to production volumes, although less so than a few months ago. High profitability across the entire industry will likely continue as high prices boost margins on vehicle sales. Consumer activity may begin to cool off as affordability becomes an issue for many prospective buyers, but we’ll have to see it to believe it.
Mercer Capital provides business valuation and financial advisory services, and our auto team helps dealers, their partners, and family members understand the value of their business. Contact a member of the Mercer Capital auto dealer team today to learn more about the value of your dealership.