June 2022 SAAR
Quantifying Pent-Up Demand


The June SAAR was 13 million units, up 2.3% from last month but down 16% compared to June 2021. This month’s release closes out the second quarter of this year, bringing the total Q2 2022 SAAR to 13.4 million units. Q1 2022 SAAR of 14.1 million units was already considered low compared to pre-pandemic, and the last few months have analysts wondering if the total 2022 SAAR will manage to exceed the first quarter’s sales pace at all. It would certainly take a major turnaround in the second half of this year for the 2022 SAAR to normalize by the time it is all said and done.
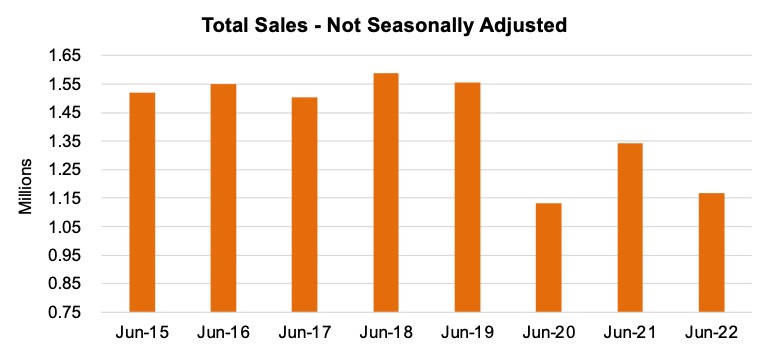
As far as unadjusted sales figures are concerned, June 2022’s performance can be put in a more appropriate perspective when compared to the last seven years of June releases (See the chart below). June 2022’s unadjusted sales pace narrowly outpaced June 2020, but compared to 2015-19, the unadjusted sales pace over the last month is significantly depressed. Even when compared to June 2021, a month where high demand intersects with dwindling supply for only the second month in a row, the June 2022 SAAR still comes up short.
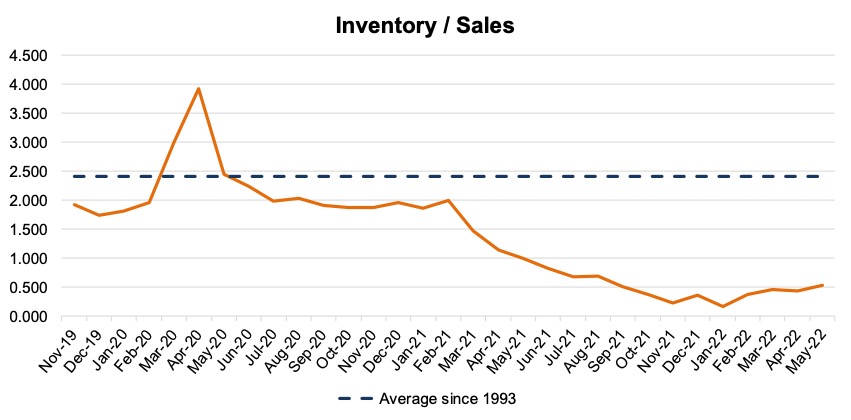
The story behind the slow sales pace remains the same in 2022 as it was this time last year, but to a magnitude that no one expected when we wrote our June 2021 SAAR blog. A lack of available inventory continues to be the largest factor limiting sales. According to Wards Intelligence, inventory at the beginning of June was down 25% from this time last year and was less than a third of pre-pandemic levels. See the chart below for a look at the industry inventory to sales ratio, which has been trending lower and lower since the inventory shortage began to take hold around March 2021.
Alongside inventory tightening, other recent trends in the auto industry have also intensified. For example, incentive spending per unit continues to fall, reaching $930 this month (59.4% lower than this time last year). As incentive spending per unit falls, sticker prices have risen. According to J.D. Power, the average transaction price per vehicle was $45,844 over the last month, an increase of 14.5% from June 2021. Furthermore, as a result of climbing sticker prices and rising interest rates, the average monthly payment that consumers are paying for new vehicles has climbed to$686, an all-time high.
While almost all consumers that are financing vehicles are feeling the sting of high monthly payments, a growing share of new car buyers are now paying over $1,000 per month. According to a recent WSJ article, over 12% of new car buyers are signing up for monthly payments in excess of $1,000, a much larger proportion of buyers than many would guess. Due to this shift in the environment for the auto consumer, the relative inelasticity of purchasing a new vehicle is being highlighted now more than ever.
Pent-Up Demand – What Does That Really Mean During the Auto Inventory Crunch?
In several of Mercer Capital’s auto blogs (most recently last week’s blog) as well as other industry commentaries, there have been references to the idea of “pent-up demand.” Pent-up demand has become commonly accepted as a reason for the relative price inelasticity of new vehicles. Inelasticity is the economic concept that a large change in the price of a good, results in a small change in the demand for that good. Pent-up demand can also be predictive. For example, many people following the auto industry have been predicting that once sticker prices eventually “normalize”, then many folks that would have bought a vehicle in a more price-friendly environment will finally pull the trigger and make that new vehicle purchase. With prices still climbing and dealers still selling through most all of the inventory they get immediately, we’re seeing that some consumers aren’t able to wait for a more favorable buying environment.
What will “normalized” volumes look like after supply chains recover? From 2015-2018, light vehicle sales in the U.S. exceeded the threshold of 17 million, which has been bandied about as the new normal. Expanding the lookback to 2014-2019, average annual light vehicle sales were 17.1 million, and it has become common within the industry to assume that a return to normal after the pandemic and chip shortage will carry the SAAR back to those levels, if not higher (due to the pent-up demand mentioned earlier).
However, is a speedy return to a 17 million unit SAAR a reasonable expectation? And is 17 million even the correct number?
We can look at the historical volumes to answer these questions. See below for a chart of the SAAR from 1976 to the first half of 2022. We have included a trend line to show the overall trend of upward movement during this period.
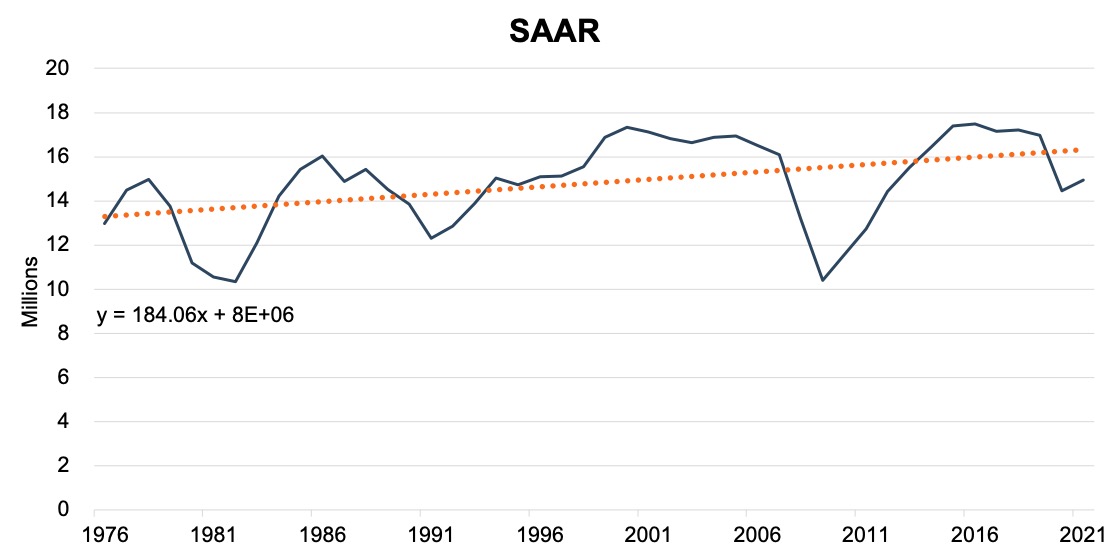
It is easy to see that the market for new vehicles has been increasing over time. Population growth and the shift from 1 car households to 2+ car households are two obvious reasons to explain the upward growth of new vehicle sales. It is also easy to see that the market for new vehicles is cyclical. A period of elevated sales is typically followed by a down period where the demand for autos dips due to an economic recession or just general softening of demand. The last period where we saw this occur was centered around the credit crisis in the late 2000’s where OEMs particularly struggled. This recovery was also compounded by storms in Asia in 2011.
From 2013 to early 2020, the new vehicle market could be characterized as being in an up-cycle. SAAR figures being reported during that period may not have been unsustainable from the perspective of OEMs or dealers. Still, a general softening of demand was bound to happen at some point. While population growth and more vehicles per household lead to a general uptick, OEMs have improved the useful lives of new vehicles as well. However, an organic softening of demand was not allowed to take its natural course due to the COVID-19 pandemic and the resulting supply chain disruptions associated with it.
The 17 million units sold prior to the pandemic are above the line of best fit in the data set. With population growth and increases in the number of new vehicles per family, we believe a linear line of best fit is appropriate for the data set. The formula on the graph shows each year, 184 thousand more vehicles are sold than the previous year. It also estimates volumes of about 16.6 million in 2022, which looks very unlikely at this point.
While this long-term view is not a good predictor for sales next month, particularly in light of supply chain constraints, we believe it reasonably supports that sustainable sales levels may be lower than the 17 million achieved pre-pandemic. Extrapolating forward with current data, 17 million in annualized volumes wouldn’t be anticipated until April 2025. It will be interesting to see how this data changes in the coming months if/when supply constraints are removed.
All that being said, perhaps a return to the long-term trend is the most reasonable assumption that industry experts can make. Based on the trend line in the chart above, a normalized SAAR of 16.5 million seems to make sense. While the difference between a predicted 17.5 million unit SAAR and a 16.5 million unit SAAR certainly does not make the largest difference in the grand scheme, it is important to have a more nuanced discussion around what “normalized” sales are going to look like in the wake of the inventory crunch that is gripping the industry in 2022.
July 2022 Outlook
Mercer Capital’s outlook for the July 2022 SAAR is consistent with the status quo. Industry supply chain conditions continue to stagnate. Sales volumes will likely continue to be closely tied to production volumes as vehicles leave lots within days of arriving. Elevated profitability across the entire industry will likely continue as high prices boost margins on vehicle sales. Stay tuned for more updates on next month’s SAAR blog.
Mercer Capital provides business valuation and financial advisory services, and our auto team helps dealers, their partners, and family members understand the value of their business. Contact a Mercer Capital auto dealer team member today to learn more about the value of your dealership.