July 2023 SAAR


The July 2023 SAAR was 15.7 million units, almost exactly in line with last month’s SAAR but 18.2% higher than July 2022’s figure. This month’s data holds true to the ongoing trend of considerable year-over-year improvements that have remained strong as the year goes on. In fact, this month is the twelfth straight month of year-over-year improvements in the SAAR, marking a full year of rising tides in auto sales volumes.
To remind our readers of recent history, the SAAR reported three straight months below 13.3 million units during June, July, and August of 2022. Inventory balances started to improve during August, and sales volumes followed suit in September, sending the industry on a long-awaited path to recovery. With this context in mind, we expect to see significant year-over-year increases in the SAAR for at least the next month or two, with subsequent improvements of a lesser magnitude over five or six months.
As we look through the windshield toward October 2023 and beyond, there is some uncertainty surrounding how much longer industry sales growth will persist. Will an economic recession slow the industry down? Or will sales volumes continue to grow as inventory improves and prices normalize even further? We think that the latter is more likely for the remainder of 2023. Still, the auto industry has been notoriously volatile during the last three years, and industry stakeholders should be prepared for a range of possible outcomes.
Unadjusted Sales Data and Revised 2023 Total Sales Predictions
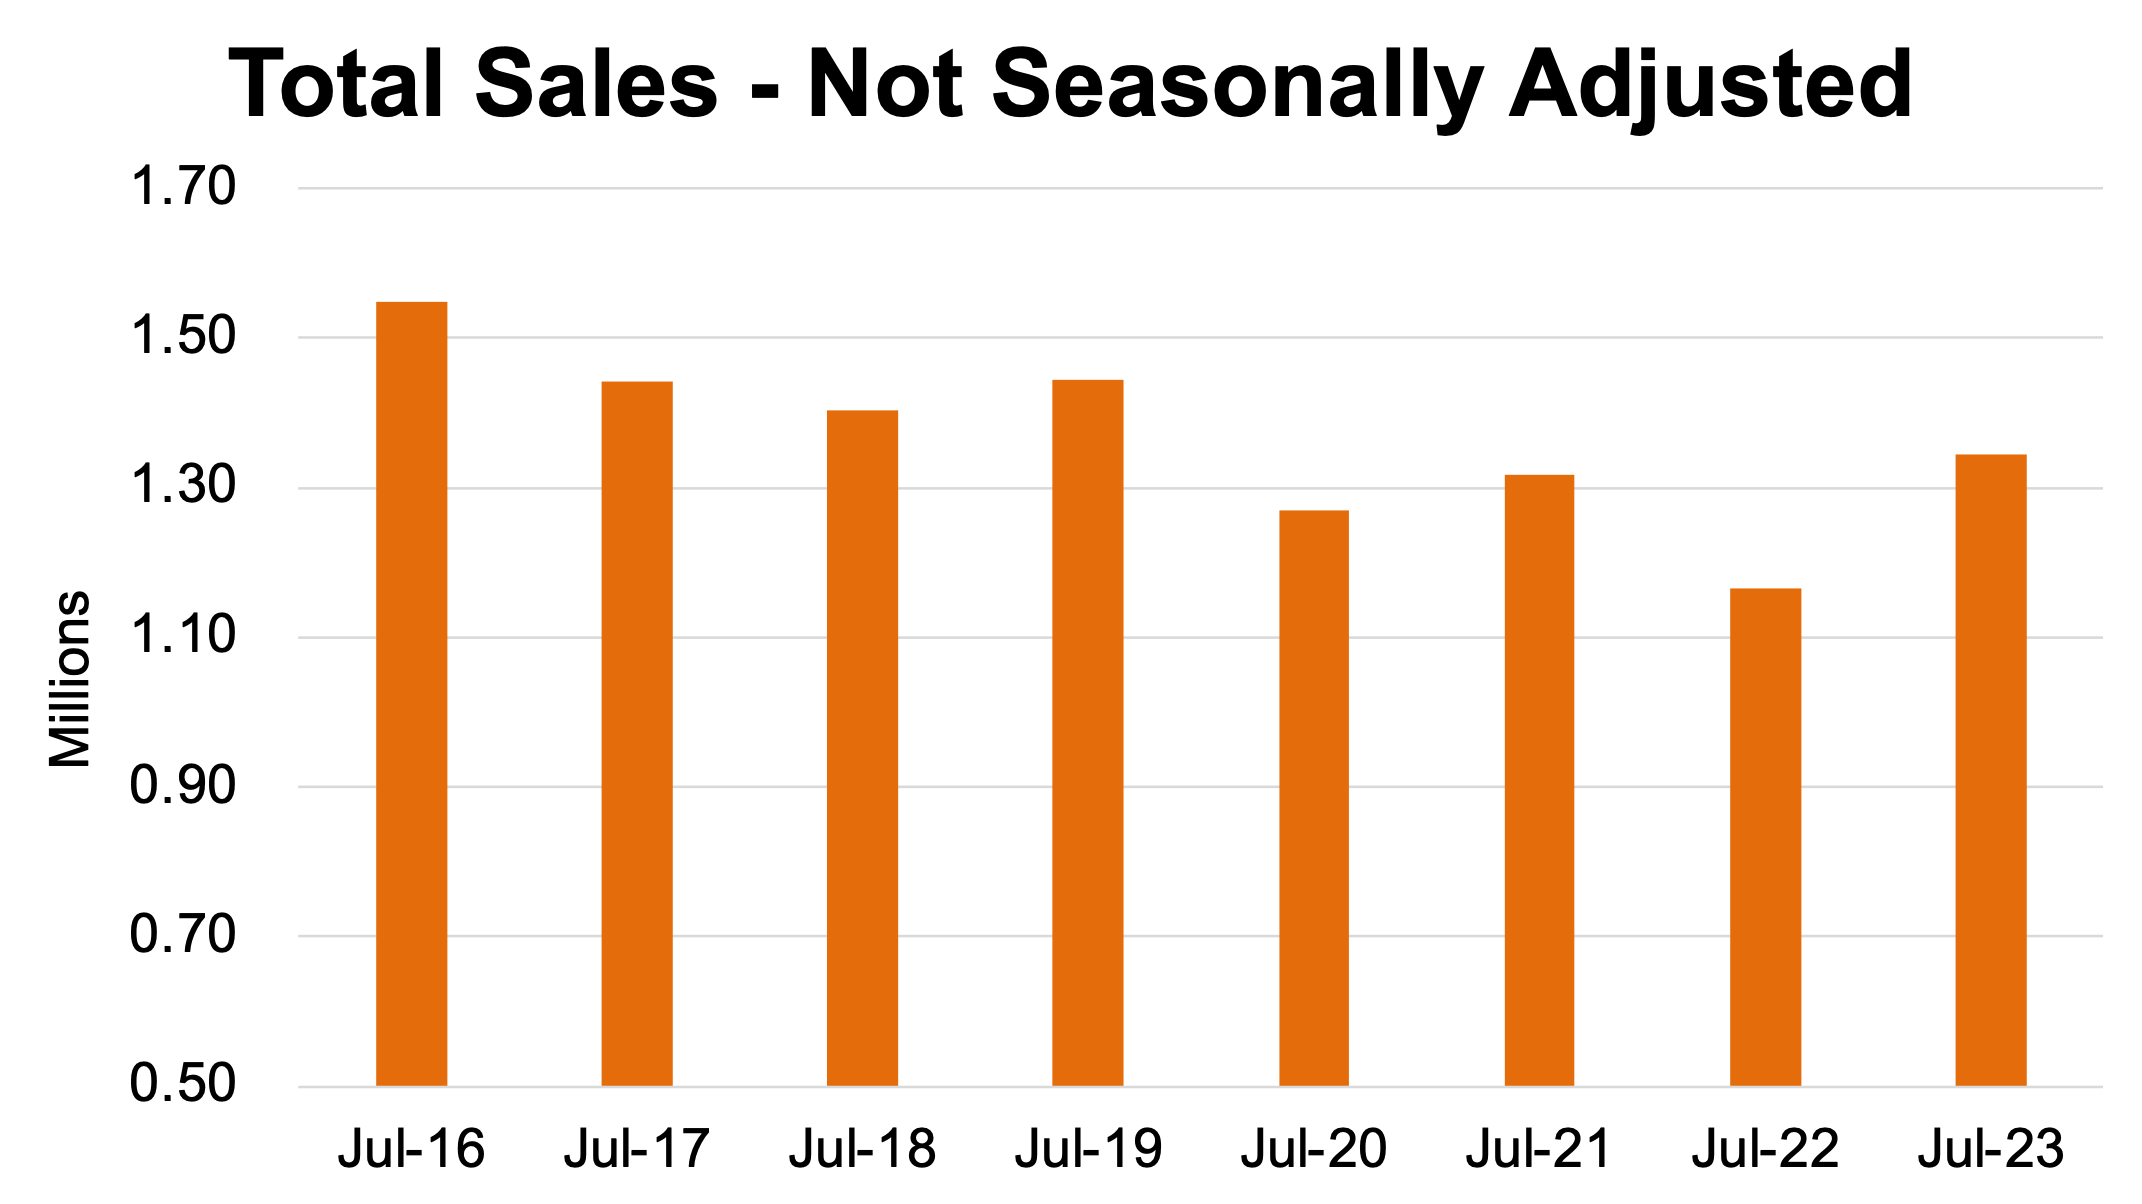
Take a look at the chart below that shows unadjusted sales volumes for the last eight Julys:
In our May 2023 SAAR blog, we predicted that 2023 total auto sales would come in between 14.5 million units and 15.0 million units, which still seems reasonable. At that time, two months ago, the industry had already sold around 6.5 million units in the first five months of the year (1.29 million units per month), and the runway for continued inventory improvements still seemed pretty long.
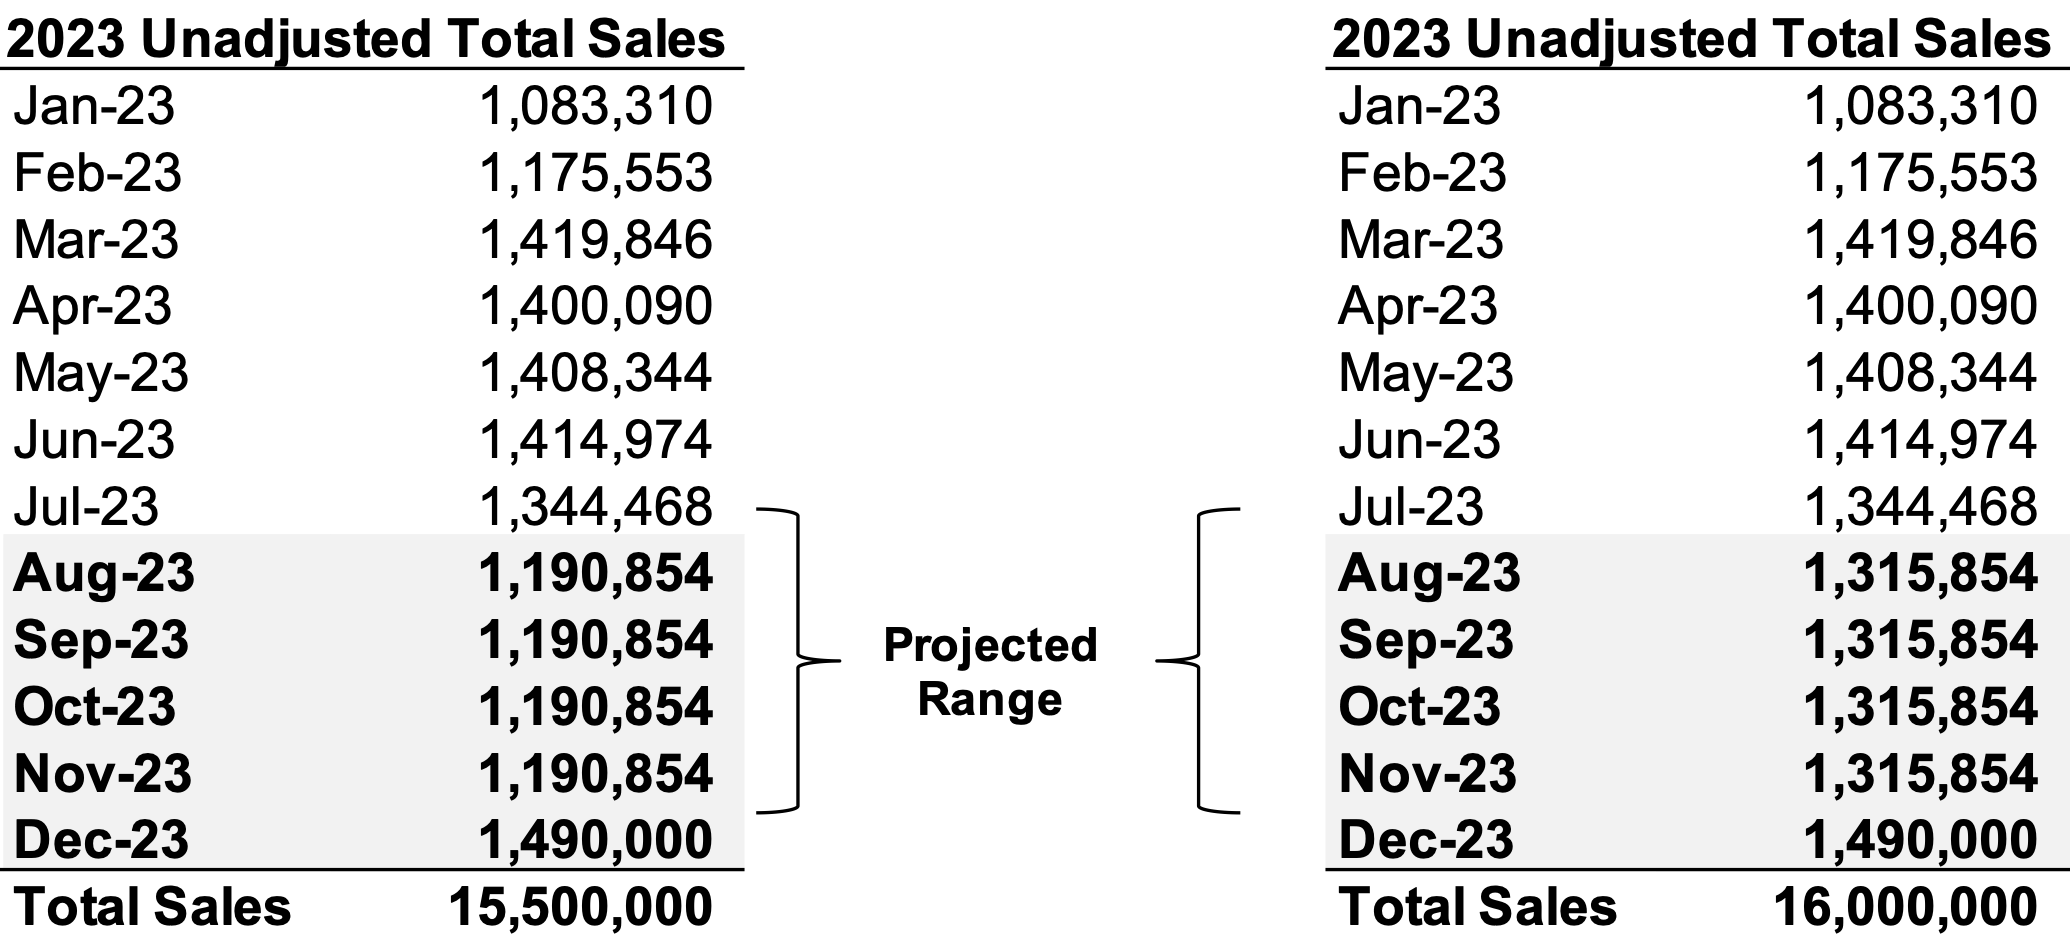
Two months and 2.75 million sold units later, the industry has maintained stronger-than-expected sales throughout the high-selling summer months, bringing total 2023 sales to 9.2 million units through July (1.32 million units per month). With more data available today, we would like to revise our total sales expectations to 15.5 – 16.0 million units in 2023.
In order for total sales to reach 15.5 – 16.0 million units, the industry needs to achieve anywhere from 1.25 – 1.35 million units per month. Last year during the final five months of 2022, total unadjusted sales averaged 1.21 million units per month, which makes 1.25 million units per month seem like a low bar to clear in a much-improved 2023 environment. This is especially true because December is typically the highest-selling month of the year and has not yet contributed to the 2023 total. Reported sales in December 2022 were 1.32 million units, and the last five Decembers have averaged 1.49 million units per month.
The tables below indicate average unadjusted projected monthly sales for August to November if total sales reach 15.5 – 16.0 million units and December reverts to historical averages.
Inventory and Days’ Supply
According to NADA, new light-vehicle inventory on the ground and in transit totaled 1.9 million units at the start of July 2023, roughly flat from a month ago. Likewise, inventory on the ground didn’t change much from the month before, declining slightly to 1.79 million units. Overall, the story has not changed much on a macro scale: domestic and international production reports have continued to improve, and no major production setbacks have been reported.
Looking closely at differences between inventory balances by vehicle segment, Cox Automotive compiled some data on the topic. According to Cox:
“The inventory of luxury vehicles (excluding ultra-luxury ones) stood at 310,304 at the end of June for a 62 days’ supply. Luxury vehicle supply has been mounting for the past few months. […] Luxury brands at the low end were Lexus at under 30 days of supply, followed by BMW, Cadillac, and Land Rover, all below industry average.”
“Non-luxury vehicle inventory totaled 1.64 million vehicles for a 52 days’ supply, about even with the end of May. Import non-luxury and luxury brands had the lowest inventories. With under 30 days’ supply, Toyota, Honda, and Kia had the lowest supply in the industry, followed by Subaru, Volkswagen, Hyundai, and Chevrolet, all with below-industry average supply.”
There are numerous potential takeaways here. First, it is unsurprising that non-luxury imports had the lowest inventory, given the supply chain challenges coupled with demand. Also, luxury vehicles having low inventory and a higher days’ supply is unsurprising given the surge in vehicle prices, which can crimp demand, particularly at the upper end of the price scale.
See the chart below for a close look at Days’ Supply for the entire industry (per Wards Intelligence):
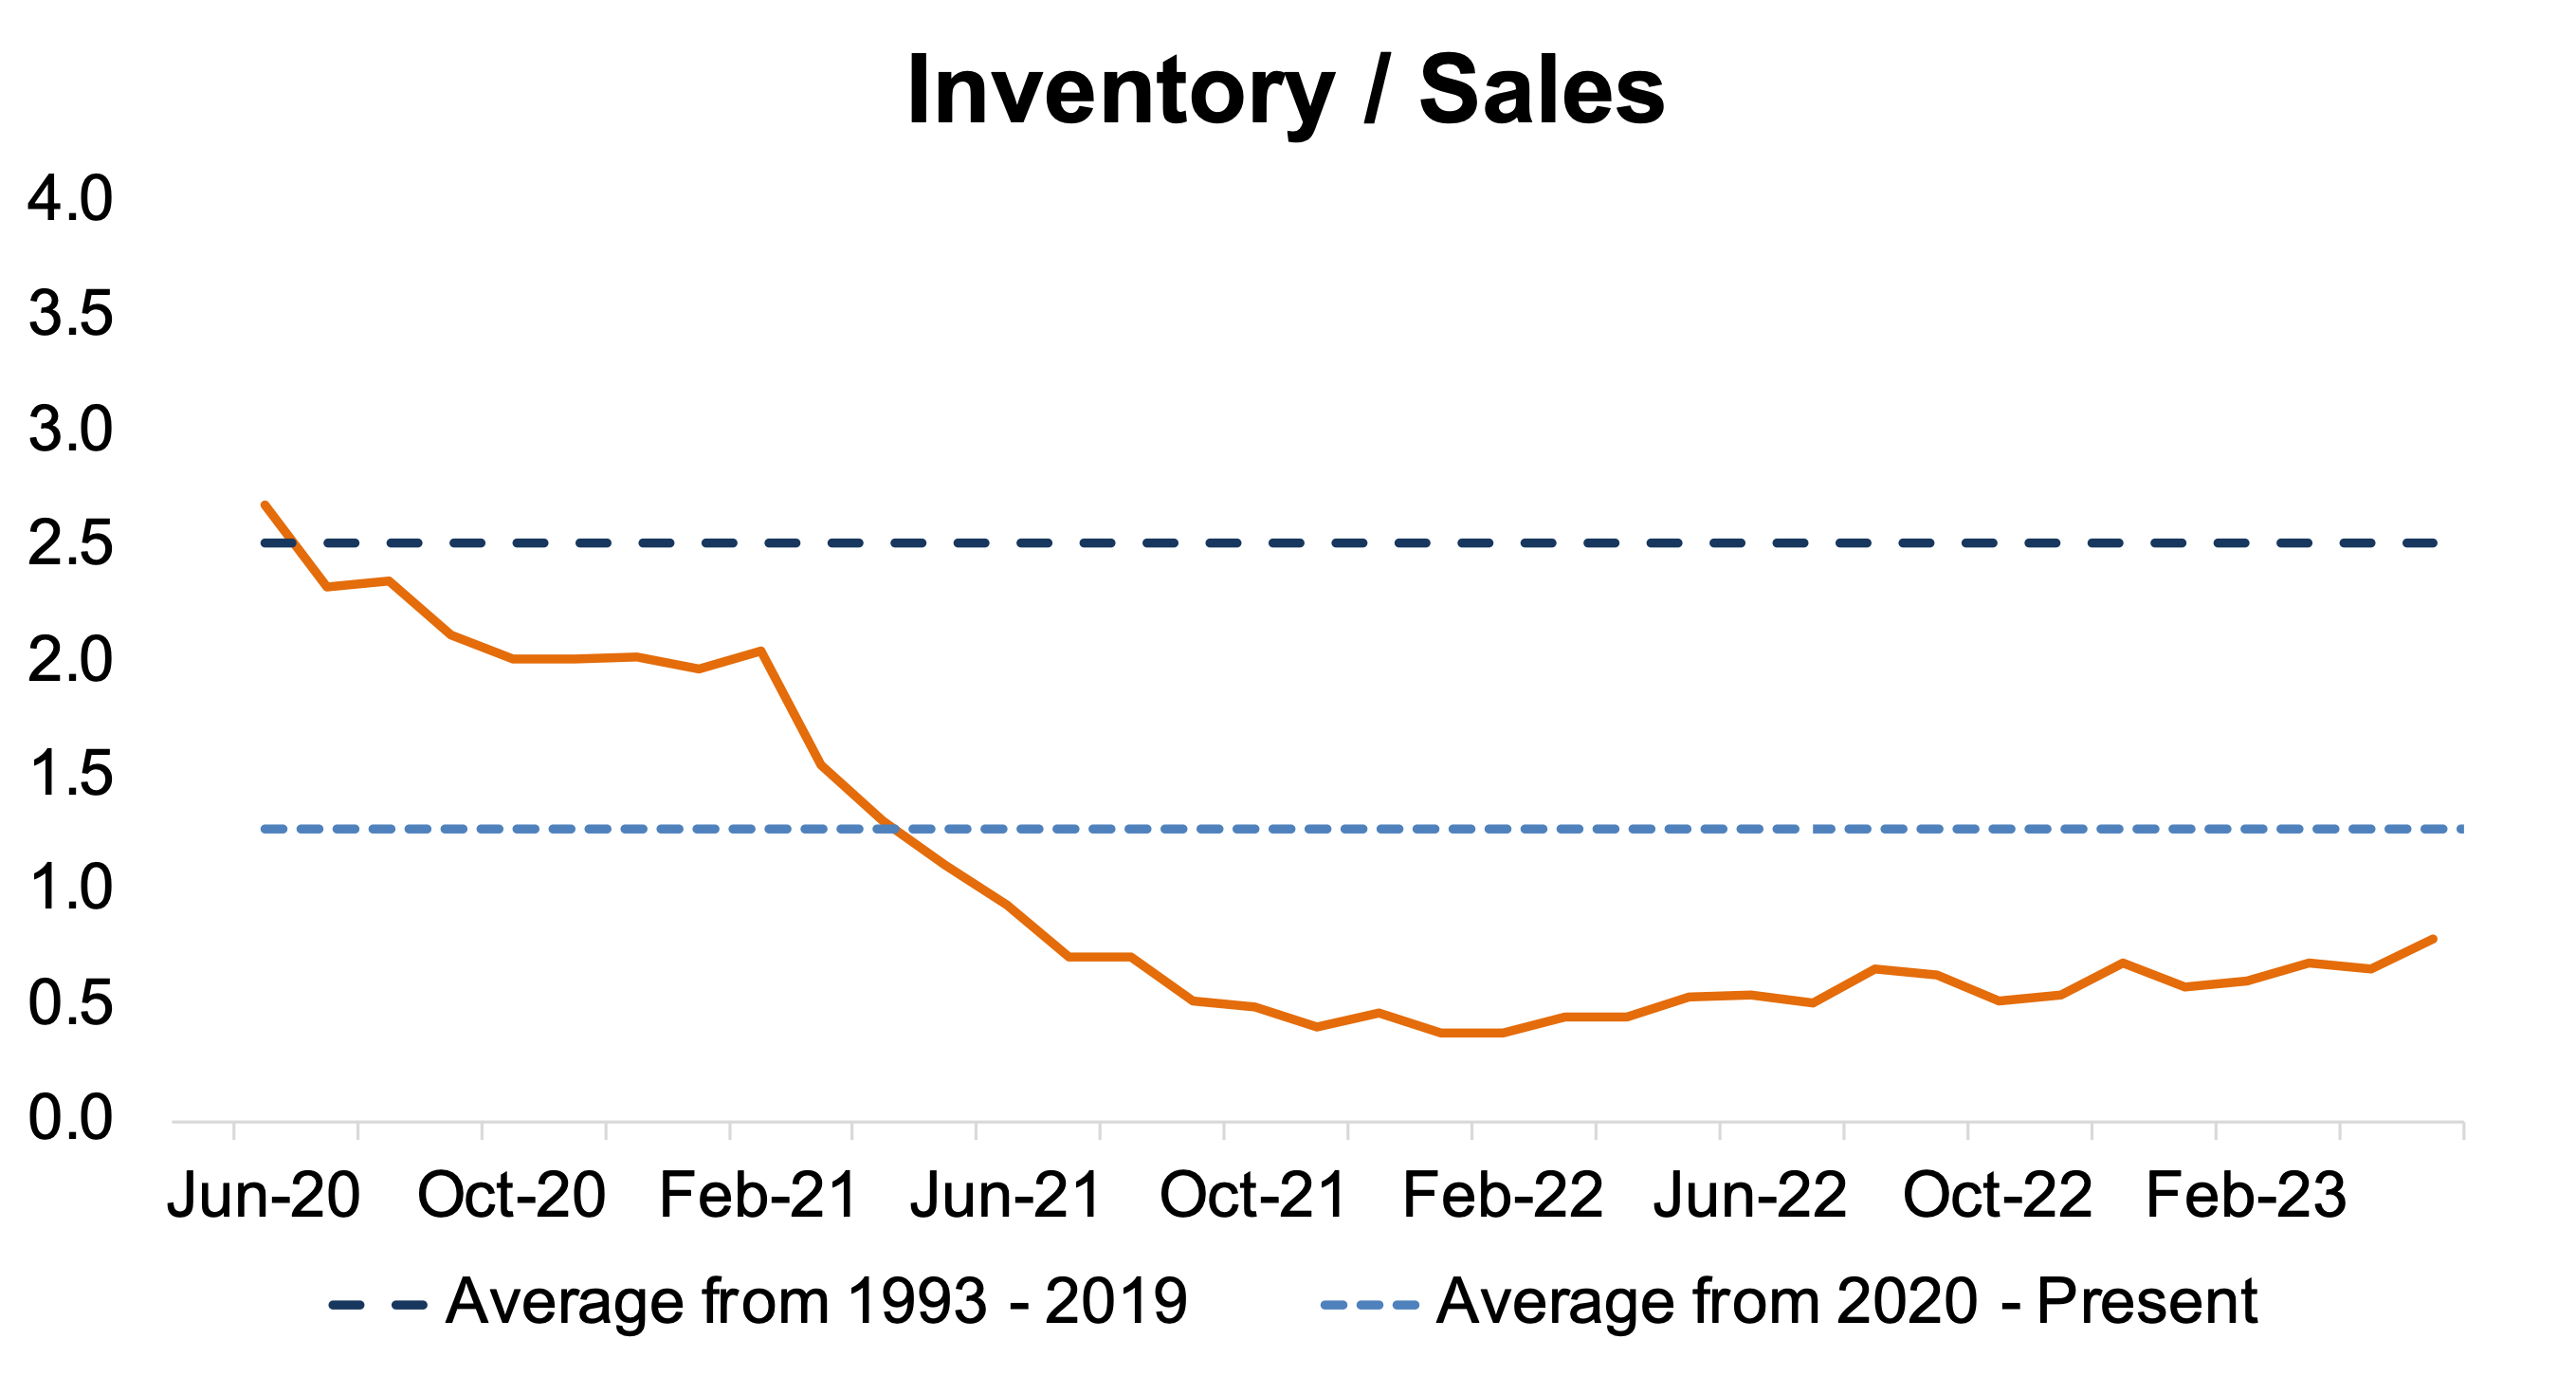
While it is clear that production volumes are still improving, elevated sales volumes have pressured inventory balances over the last year due to 1.) pent-up demand from fleet customers and 2.) retail consumers on the margins waiting to purchase a vehicle during the pandemic. If the demand side of the equation meaningfully cools off sometime soon, we may see an industry inventory-to-sales ratio in excess of 1.0x. However, incremental increases approaching 1.0x are likely the rest of the way through 2023. See the chart below for a look at the industry inventory-to-sales ratio:
Transaction Prices
Transaction prices, while still elevated, have continued to cool off. According to Cox Automotive, Americans’ average price paid for a new vehicle in July 2023 was $48,344, or only 0.34% higher than a year ago. This year-over-year increase was the smallest since the start of the global pandemic in early 2020, as inventories have improved and interest rates have exploded. Compared to the start of the year, however, transaction prices are down $1,044, or 2.1%. This contraction is the largest January to July decrease in the past decade, partly due to a reversion of the run-up over the past few years.
See the chart below for a context around the monthly average transaction price from January 2019 to July 2023:
![]()
Incentive Spending
Incentive spending has continued to increase, balancing affordability issues for consumers. According to J.D. Power, average incentive spending per unit is expected to total $1,888 in July 2023, up 107% from July 2022. Not only is incentive spending up on a dollar basis, but spending is up as a percentage of MSRP. Expressed as a percentage of MSRP, incentive spending is currently trending at 3.7%, an increase of 1.7 percentage points from July 2022. While many models still see “dealer adjustments,” this has become less pervasive industry-wide.
August 2023 Outlook
Mercer Capital’s outlook for the August 2023 SAAR continues to be optimistic. Industry supply chain conditions are improving. Sales volumes have continued to improve as dealers are seeing better inventory availability. However, with concerns of a recession looming, it will be important to monitor consumer activity which may begin to cool off as affordability becomes an issue, as evidenced by falling transaction prices and rising incentives.
Mercer Capital provides business valuation and financial advisory services, and our auto team helps dealers, their partners, and family members understand the value of their business. Contact a member of the Mercer Capital auto dealer team today to learn more about the value of your dealership.