
Auto dealers that sell new vehicles nationwide rely on their Finance and Insurance (F&I) departments as an important source of earnings. While top-line department revenue is typically a small portion of a new car dealership’s total revenue mix, these departments have much more favorable margins than their counterparts in the selling division. For used dealers without subsidiary captive finance operations, third-party lenders take a larger role in the financing process, and the economics tend to be different from their new vehicle-selling counterparts.
Last June, we released a 2022 Overview of Auto Finance. In this blog post, we review these themes and layout new developments and changes in the state of auto finance since this time last year.
What Is the Layout of the Auto Finance Industry
The auto finance industry includes establishments that provide financing for both sales and leasing of automobiles. Sales financing establishments primarily lend money to provide vehicles through a contractual-installment sales agreement, either directly from or through arrangements with auto dealers. Industry participants generate revenue through the interest and fees included in borrowers’ installment payments.
There are two major types of auto finance operators: captive finance companies and third-party lenders.
Some examples of captive finance companies are Toyota Financial Services, General Motors Financial Company, Honda Financial Services, and BMW Group Financial Services. These companies are “captive” to the larger OEM’s leadership and have less decision-making autonomy. The purpose of these captives is to provide the parent company with a substantial profit source and limit the company’s risk exposure. Captive finance lender loans are typically exclusive to new vehicles.
Third-party lenders like Ally Bank, Capital One, Chase, Wells Fargo, and Truist provide insurance and financing to dealerships and their customers that primarily sell used vehicles or new vehicle dealerships without a captive finance subsidiary. Consumers can also decide to use a third-party lender in place of a captive finance company on new vehicle purchases. Banks are not the only entities that participate in the auto lending industry. Credit Unions, Specialty Finance companies, and “Buy Here, Pay Here” (BHPH) companies also lend to car buyers. (It is important to note that BHPH companies may hold the consumer’s loan on their balance sheet or sell the loan in the open market. Thus, these companies have attributes of captive finance subsidiaries and third-party lenders.)
See the graphic below (source: Piper Sandler) featuring auto finance lenders in different industry classifications.
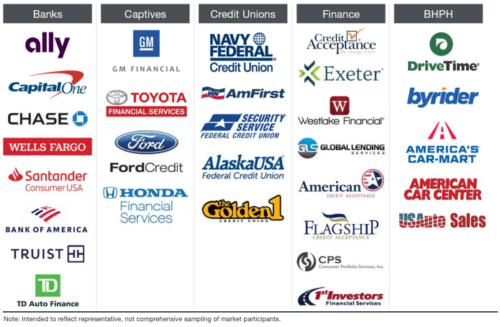
It is easy to see how the different classes of lenders outlined in the graphic above might have different risk tolerances and return targets. For example, the “Buy Here, Pay Here” companies are more likely to lend to subprime borrowers. While these companies have taken scrutiny for charging higher interest rates on said borrowers, they are undoubtedly taking on more risk while demanding a higher return in response. Additionally, the cost of repossessing vehicles is endemic to their operations, not a “normalization” adjustment that one might consider in the valuation of a new vehicle dealership.
State of the Auto Finance Industry
Experian releases a “State of the Automotive Finance Market” webinar every quarter. The information in the most recently released webinar outlines origination, portfolio balances, and delinquency trends observed in the first quarter of 2023. A summary of these trends follows.
How Are Consumers Purchasing Their Vehicles?
Total financing has fallen for the second straight year. In the first quarter of 2023, the percentage of vehicles purchased using financing (79%) dropped from this time last year (85%) and from the first quarter of 2021 (86%). This move toward cash purchases has an inverse relationship with rising interest rates as consumers try to avoid pricey debt that comes from a higher monthly payment. The magnitude of this year’s drop illustrates this relationship well.
Who is Financing These Purchases?
Captives moved to the largest share of total financing
Captives moved to the largest share of total financing (27%) in the first quarter of the year, just edging out banks (26%) for the top spot. This move goes hand in hand with banks’ recent retreat from the auto space in floor plan lending and a tightening of their position in consumer auto lending. Credit unions’ share of the auto lending market has climbed to 25%, compared to 22% last year and 19% in 2021.
Captives make up 54% of the market share for new vehicles specifically. While captives remain at the top of the ladder, banks have also clawed back their position in the new vehicle lending space, decreasing to 23% of total loans from 29% last year.
The profile of used vehicle financing usually takes a different shape, and the first quarter of 2023 was no exception. For franchise dealers, 36% of total loans came from banks in the first quarter, and 33% came from credit unions, with the remaining purchases financed by other means. However, purchases from independent used vehicle dealers were mostly financed by BHPH companies (40% of total loans) and finance companies (26% of total loans).
Credit Scores and Credit Quality
Auto consumers’ credit scores have continued to climb. Over the last five years, the average new vehicle purchaser’s credit score rose 15 points, and the average used vehicle score rose 30 points. In comparison, the average credit score for a new vehicle purchase was 742 in Q1 2023 and 736 and 734 over the last two Q1s. The average credit score on used vehicles has also risen, with the previous three first-quarter averages being 677, 669, and 663, respectively.
For new vehicle financing, the prime and super prime segments have grown to 82% of total new vehicle loans, compared to 81% last year and 78% in 2021. These loans have cemented themselves as premier products, with the most growth occurring in the super prime segment year after year.
Used vehicle financing has also experienced an increase in credit quality. Subprime loans were recorded near record lows in the first quarter of 2023, and the prime and super prime segments grew to 56% of total used vehicle loans compared to 52% last year and in 2021.
Interest Rates and Term Lengths
For new vehicle loans, the average interest rate was 6.6%, up significantly from 4.1% in Q1 2022. This jump aligns with the broad market trend set in motion by the Federal Reserve over the last year. The average interest rate on used vehicles purchased was 11.2%, much higher than last year (8.7%) and the first quarter of 2021 (8.8%).
The average loan term on new vehicles was 69 months, remaining elevated from decades past with only a slight decrease over the last year. This tick down has come from significant growth in the 1-month-48-month loan term segment, which increased to 12% of total loans in Q1 2023 from 7% in Q1 2021.
Therefore, despite the lower overall balance of financing in the market, more and more consumers choosing to finance vehicles are opting for shorter loan terms and, therefore, higher monthly payments. In other words, a subset of total consumers is paying cash for vehicle purchases, while others seem less concerned about high monthly payments.
Similar to new vehicle loans, the average loan term for used vehicles has hovered around 67 months over the last three years. However, unlike new vehicle loans, there was no pronounced increase in shorter-term loans, which kept the average term relatively more stable. This observation is compatible with the idea that younger, lower-income consumers would be more likely to avoid higher monthly payments.
Portfolio Balances and Delinquency
Overall loan balances grew 8.4% over the last year from $1.32 trillion to $1.43 trillion. The auto loan balance by credit band has not changed much in the previous five years, but growth areas include the super prime (29% of total loans) and deep subprime (2% of total loans) segments.
Delinquencies are up across the board
Delinquencies are up across the board. Thirty-day delinquencies grew to 2.2% in Q1 2023 from 1.8% this time last year. However, thirty-day delinquencies are not quite up to pre-COVID levels. On the other hand, sixty-day delinquencies are up to 0.9% from 0.7% during the same period. Sixty-day delinquencies have now surpassed pre-COVID levels. We believe that rising delinquencies will persist into the near term.
Conclusion
As dealers across the country begin navigating an environment where more vehicles are available, sticker prices are below MSRP, and the level of consumer demand is uncertain, all of the dealership’s profit centers will be very important to the overall profitability of the dealership. Perhaps it could benefit dealers nationwide to look at their finance and insurance departments as an area of opportunity instead of uncertainty.
Mercer Capital provides business valuation and financial advisory services, and our auto team helps dealers, their partners, and family members understand the value of their business. Contact a member of the Mercer Capital auto dealer team today to learn more about the value of your dealership.