
Pre-COVID and chip shortage, it would be no surprise if Blue Sky multiples remained stable over numerous quarters for many brands. As seen in the charts later in this post, multiples normally don’t tend to shift dramatically on a quarterly basis. Multiples are dependent on numerous factors, though brand desirability is chief among them. This is usually tied to product lineup and the overall effectiveness of the OEM.
In 2020, the economic shock to the economy borne by the COVID-19 pandemic caused Blue Sky multiples to oscillate in near lockstep, regardless of brand. While multiples changed on a quarterly basis throughout 2020, notably, so did the earnings stream to which buyers applied the Blue Sky multiples. As the chip shortage and lack of inventory have persisted into 2022, auto dealers are getting more credit for recent outperformance as earnings rise steadily.
According to Haig Partners, buyers have historically focused on adjusted profits from the last twelve months, which has been viewed as the best indication of expectations for the following year. Since the onset of the pandemic, as expectations have been much more dynamic, the earnings stream to determine ongoing expectations has shifted.
Throughout most of 2020, Haig’s Blue Sky multiples were applied to 2019 earnings as these were viewed as the best indication of a dealership’s “run rate” prior to any negative COVID impact. When profitability improved and uncertainty began to decline around June 2020, multiples applied on these 2019 earnings rebounded. Throughout the latter half of 2020, it became clear that the pandemic positively impacted earnings. Most dealers significantly outpaced pre-COVID results, despite a month or two of nearly stand-still operations.
In late 2020 and into 2021, Haig reports that buyers were using a three-year average of adjusted profits from 2018, 2019, and LTM ’20 or ’21, or two years of pre-pandemic results and one year of outperformance. The prevailing thought was that the outperformance due to COVID would eventually normalize, and buyers didn’t want to overpay for dealerships that may not be able to repeat these earnings in the future.
Now in 2022, Haig reports that buyers are ready to acknowledge that not only have earnings continuously increased, but the inventory shortages show no signs of abating. As we’ve noted for months, industry players have continuously said the situation should normalize in the next 6-9 months. But they’ve been saying that since about February 2021, or 14 months ago.
If you only look at the Blue Sky multiples from the Haig reports, you’re missing the bigger picture because valuations (multiples) may be flat, but values are up.
As we sit here today, the outlook is still uncertain, but I personally wouldn’t have extreme confidence to say operating conditions or earnings will normalize in 2022. The lead time to meaningfully increase microchip production is clearly long, and with record profits for dealers and manufacturers, OEMs aren’t necessarily incentivized to change the status quo. Demand for personal vehicles is certainly more inelastic than the market previously indicated.
If you only look at the Blue Sky multiples from the Haig reports, you’re missing the bigger picture because valuations (multiples) may be flat, but values are up. With earnings steadily increasing, Blue Sky values have followed the same path. That’s why it’s important to understand what level of earnings are being applied to the multiple.
Illustrative Example: Honda
To show the path of Blue Sky values since the onset of the pandemic, we’re going to take pre-tax earnings for average import dealerships as reported by NADA and apply them to the appropriate multiple. Last year, we did this analysis for Lexus, so we’re switching from Luxury to Mid-Line Import. We also thought earnings would normalize, yet it has gone the opposite direction in the past year. Unfortunately, due to licensing issues, NADA no longer posts monthly dealer financial data on its website, so our analysis is only based on what we had previously saved, and we must use some extrapolations.
In Q4 2019, Haig Partners reported a Blue Sky multiple range of 5.5x to 6.5x for Honda dealerships (tied with Toyota for the highest multiple for import dealerships). With 2019 pre-tax earnings of $1.66 million for the average import dealership, the implied Blue Sky value for the average Honda franchise would range between $9.1 million and $10.8 million. In Q1 2020, the multiple declined by 0.50x on the top and bottom end, dropping implied Blue Sky values to a range of $8.3 million to $9.9 million.
By year-end 2020, multiples and earnings each increased significantly, and Honda was up to a range of 6x-7x, or $11.1 million to $12.9 million based on a 3-year average pre-tax earnings of $1.84 million. Through a tumultuous year, the multiple landed a half-turn higher than Q4 2019, and earnings were up 39.9%. Even using the 3-year average, “ongoing” earnings at year-end 2020 were up 11.2% from 2019.
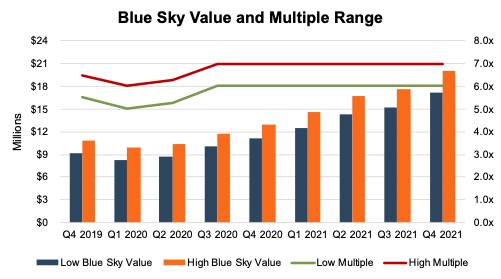 As seen on the chart above, Honda’s reported Blue Sky multiples have been unchanged since Q3 2020 at a range of 6x-7x. But from Q3 2020 to Q3 2021, earnings more than doubled, and 3-year average earnings increased 51% from $1.67 million to $2.52 million. Multiplying by the mid-point of the range, Blue Sky values increased from $10.9 million to $16.4 million. In Haig’s Q4 2021 report, ongoing earnings are now expected to be based on 2019, 2020, and 2021 earnings. With 2021 performance more than double 2018 earnings for import dealerships, this change in methodology further increases ongoing earnings. Based on our estimate of 2021 earnings, the average Honda dealership would fetch $18.6 million in Blue Sky or double its value from Q1 2020. While the mid-point multiple has only increased from 5.5x to 6.5x, ongoing earnings increased from $1.66 million to $2.86 million.
Even in what has been perceived as a seller’s market, buyers of auto dealerships have likely done pretty well in their first year of ownership.
We consider a hypothetical transaction to further illustrate how Blue Sky values have exploded. If a Honda dealership was sold in January 2021 at the prevailing mid-point Blue Sky multiple of 6.5x applied to 3-year average earnings of 2018, 2019, and 2020, the seller would’ve received just under $12.0 million in Blue Sky. The buyer’s first year of earnings in 2021 would be an estimated $4.44 million, way above the “ongoing” expectation. While nobody expects 2021 performance to be earnings into perpetuity, the implied Blue Sky multiple of that transaction was only 2.7x, or lower than any reported Blue Sky multiple range.

While few could predict what would happen in 2021, the hypothetical buyer above was a clear winner. While there are numerous doomsday scenarios for dealers these days about longer-term perspectives, I would think twice before selling my largest investment while at peak cash flows that I felt I had some control over if I wasn’t getting well compensated. Even in what has been perceived as a seller’s market, buyers of auto dealerships have likely done pretty well in their first year of ownership. Below, we observe how Blue Sky multiples have changed over the past five years. However, as we’ve illustrated above, the recent lack of movement is not indicative of stagnant Blue Sky values.
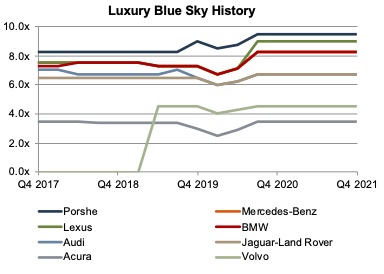
Blue Sky Multiples: Luxury Brands
After three straight quarters of changes in 2020, not a single luxury dealership saw a change in its multiple range, though as highlighted above with imports, dealership values have taken off. After years of only reporting a value range due to a lack of profitability, Cadillac dealerships are now reported at a range of 3x-4x and will be included in future graphs. This multiple range is in line with Acura as the lowest for luxury dealerships. Despite being luxury brands, 3-4x is the lowest reported multiple range, in line with VW and Mazda, which have had their fair share of struggles in recent years.
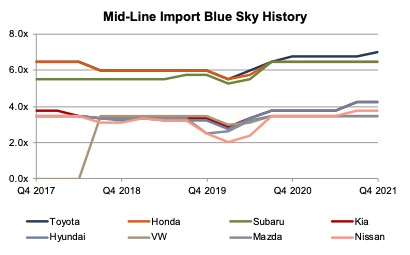
Blue Sky Multiples: Mid-Line Import Brands
Four of the eight Mid-Line Imports multiples improved in the second half of 2021. In Q3 2021, Kia and Hyundai multiples increased 0.5x to 3.75x-4.75x, further distancing these dealerships from the lower half of the mid-line imports (VW, Mazda, and Nissan) though as seen in the graph below, still well below Toyota, Honda, and Subaru. Nissan’s multiple also ticked up 0.25x in Q3 2021, making it slightly more desirable than VW and Mazda.
Toyota was the only brand to see a change in its multiple in Q4 2021, modestly increasing its lead at the top of the group at 6.5x-7.5x. Toyota dealerships now fetch just higher valuations than Audi and Jaguar-Land Rover dealerships. While they don’t sell luxury vehicles, Toyotas are definitely viewed as dependable vehicles which consumers can appreciate. Toyota has also taken a balanced approach in terms of EV adoption, which makes sense for the company that really pioneered the hybrid approach with its Prius in the early 2000’s.
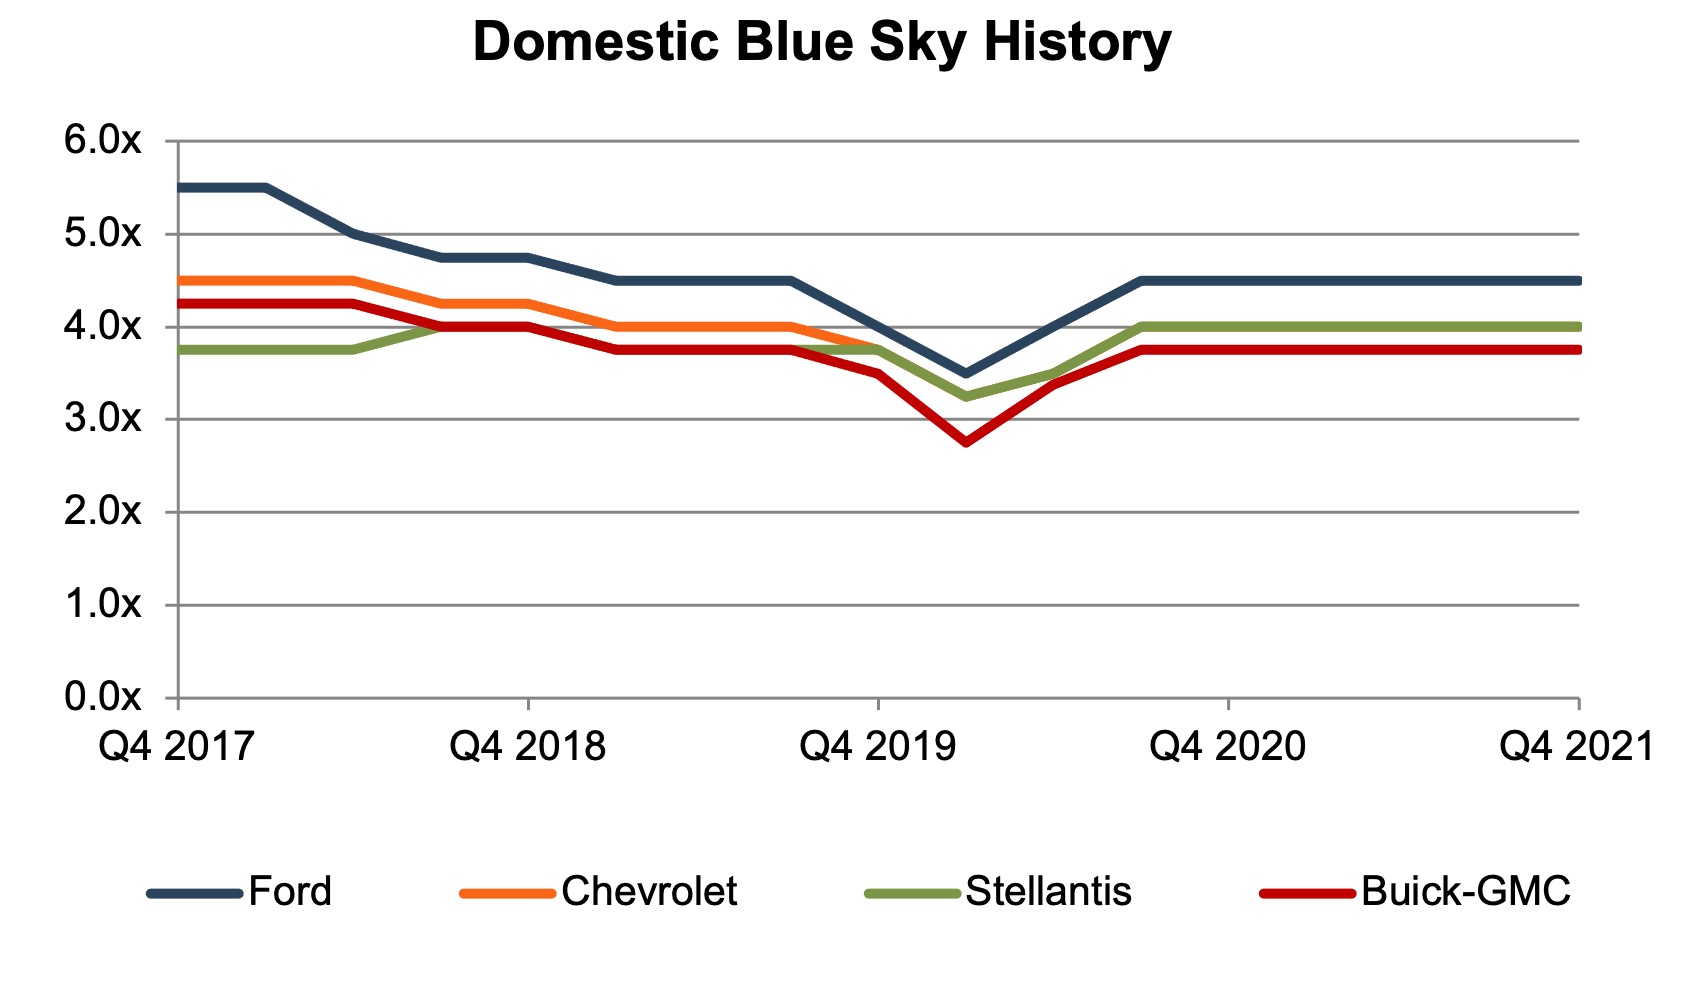
Blue Sky Multiples: Domestic Brands
Domestic franchise multiples have not changed in the past year, all generally above the lackluster mid-line imports but well below other players. One would think that supply chain constraints would negatively impact import brands more than their domestic counterparts. However, the past year has demonstrated that even domestic brands rely heavily on the global supply chain for their inputs, particularly microchips.
In the last five years, Stellantis dealerships have seen their multiples modestly improve, while Ford, Chevy, and Buick-GMC are all down. Only Audi shows a decline in the past five years while Acura, Honda, and Mazda are unchanged and everyone else has seen their multiples increase. While domestic dealerships have not received high Blue Sky multiples, they have been well positioned for the shift from cars to trucks, and heightened earnings across the board is likely to lead to greater return on investment for dealerships that trade at lower multiples.
Conclusion
Blue Sky multiples provide a useful way to understand the intangible value of a dealership. These multiples provide context for someone familiar with the auto dealer space but perhaps not the specific dealership in question. Buyers don’t directly determine the price they are willing to pay based on Blue Sky multiples; they analyze the dealership and determine their expectation for future earnings capacity (perhaps within the context of a pre-existing dealership where synergies may be present) as well as the risk and growth potential of said earnings stream. The resulting price they are willing to pay can then be communicated and evaluated through a Blue Sky multiple. If a dealer feels they are being reasonably compensated, they may choose to sell. As demonstrated in this post, earnings expectations can be significantly different from actual results.
For dealers not yet looking to sell, Mercer Capital provides valuation services (for tax, estate, gifting, and many other purposes) that analyze these key value drivers. We also help our dealer clients understand how their dealership may or may not fit within the published ranges of Blue Sky multiples. Contact a Mercer Capital professional today to learn more about the value of your dealership.