Does Fair Market Value (and its Associated Discounts) Avoid the Intent of 2704 and Thus “Undervalue” Certain Types of Transferred Interests?
[August 2016] The IRS released its long expected proposed regulations in regards to Section 2704 on August 2. The substance of this proposal, according to the IRS, is to regulate treatment of entities for estate and gift tax purposes. According to the summary the proposal is:
“…concerning the valuation of interests in corporations and partnerships for estate, gift, and generation-skipping transfer (GST) tax purposes. Specifically, these proposed regulations concern the treatment of certain lapsing rights and restrictions on liquidation in determining the value of the transferred interests. These proposed regulations affect certain transferors of interests in corporations and partnerships and are necessary to prevent the undervaluation of such transferred interests.”
Before we delve any deeper on this article, let’s clarify a few things up front:
- We are appraisers, not lawyers and we are neither qualified nor particularly interested in dissecting the proposal from a legal perspective. Our friends in the legal community can address that.
- This is a proposal that, as of the writing of this article, is not in effect, could change, or might never go into effect. (Nonetheless we aim to comment from a valuation perspective as if it does).
With that said – what we hope to do in this post is to (i) give readers some context about the impetus of these proposed Section 2704 changes, (ii) share what these proposed changes are, and (iii) share what this might mean from a valuation standpoint.
Background of the Proposal
According to the IRS, treatment by taxpayers in regards to certain rights and transfers, as well as rulings of the Tax Court in regards to these rights and transfers have allowed taxpayers to avoid application of Section 2704. Representative of this sentiment, Page 6 of the proposal puts it this way when referencing Section 2704(b):
“The Treasury Department and the IRS have determined that the current regulations have been rendered substantially ineffective in implementing the purpose and intent of the statute by changes in state laws and by other subsequent developments.”
The areas that the IRS cites as no longer ineffective fall into three primary areas:
- 2704(a). Specifically the area covering so-called “Deathbed Transfers” – whereby liquidation rights lapse upon death. The IRS cites Estate of Harrison v. Commissioner as an example of this. The IRS claims that such transfers generally have minimal economic effects, but result in a transfer tax value that is based on less than the value of the interest.
- 2704(b). Inter-family transfers and specifically restrictions on liquidation for family interest transfers. Reasons for this include that courts have concluded that Section 2704 applies to restrictions on the ability to liquidate an entire entity, and not on the ability to liquidate a transferred interest in that entity. Also the IRS says state laws and utilization of “assignees” have allowed taxpayers avoid 2704.
- 2704(b). Granting of insubstantial interests to non-family members (such as a charity or employee) to avoid application of the statute. The IRS says this needs to be changed, because, in reality, such non-family interests generally do not constrain a family’s ability to remove a restriction on an individual interest.
Proposed Changes and Amendments
In light of this perceived avoidance and ineffectiveness of certain provisions in 2704, the IRS has proposed a number of new regulations including:
- Change the definition of a “controlled entity” to be viewed through the lens of an entire family including lineal descendants as opposed to individual(s).
- Amend the regulations to address what constitutes control of an LLC or other entity that is not a corporation, partnership, or limited partnership.
- Amend the regulations to limit the use of eliminating or lapsing rights (voting or liquidation rights) and limit the exception to transfers occurring three (3) years or more before death.
- Ignore transfer restrictions for minority interests and thus assume that they would be marketable, regardless of governing documents and/or state laws.
- Ignore the presence of non-family members with less than 10% of the overall equity value.
Valuation Impact
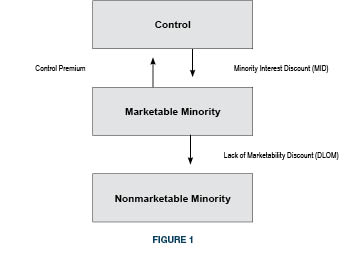
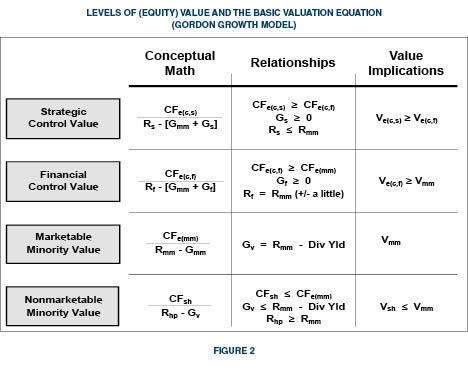
The IRS is not proposing changing the definition of fair market value. However, when applying fair market value under the constructs as contemplated in the proposed 2704 changes, there would be a smaller (or perhaps no) value delineation for minority interests as compared to enterprise value of an entity. According to the IRS’s position, this would prevent taxpayers from “undervaluing” transferred interests among family members. This, of course, runs in stark contrast to the marketplace, of which fair market value is supposed to be a reflection. The marketplace’s long track record on this is abundantly clear – it differentiates for minority interests as compared to the value of entire enterprises. Thus the proposed regulations essentially circumvent the levels of value for family members as defined in a “controlled entity.”
If the proposal is adopted as contemplated, there will be a powerful incentive for families with businesses and investment holding entities to initiate or complete transfers before these regulations take effect (which is thought to be December 2016). If Mercer Capital can be of any assistance in light of this development, please contact us.
Fairness Considerations for Mergers of Equals
When asked about his view of a tie years before the NCAA instituted the playoff format in the 1990s, Coach Bear Bryant famously described the outcome as “kissing your sister.” If he were a portfolio manager holding a position in a company that entered into a merger of equals (MOE), his response might be the same. Wall Street generally does not like MOEs unless the benefits are utterly obvious and/or one or both parties had no other path to create shareholder value. In some instances, MOEs may be an intermediate step to a larger transaction that unlocks value. National Commerce Financial Corporation CEO Tom Garrott once told me that part of his rationale for entering into a $1.6 billion MOE with CCB Financial Corp. in 2000 that resulted in CCB owning 47% of the company was because bankers told him he needed a bigger retail footprint to elicit top dollar in a sale. It worked. National Commerce agreed to be acquired by SunTrust Banks, Inc. in 2004 in a deal that was valued at $7 billion.
Kissing Your Sister?
MOEs, like acquisitions, typically look good in a PowerPoint presentation, but can be tough to execute. Busts from the past include Daimler-Benz/Chrysler Corporation and AOL/Time Warner. Among banks the 1994 combination of Cleveland-based Society Corporation and Albany-based KeyCorp was considered to be a struggle for several years, while the 1995 combination of North Carolina-based Southern National Corp. and BB&T Financial Corporation was deemed a success.
The arbiter between success and failure for MOEs typically is culture, unless the combination was just a triumph of investment banking and hubris, as was the case with AOL/Time Warner. The post-merger KeyCorp struggled because Society was a centralized, commercial-lending powerhouse compared to the decentralized, retail-focused KeyCorp. Elements of both executive management teams stuck around. Southern National, which took the BB&T name, paid the then legacy BB&T management to go away. At the time there was outrage expressed among investors at the amount, but CEO John Allison noted it was necessary to ensure success with one management team in charge. Likewise, National Commerce’s Garrott as Executive Chairman retained the exclusive option to oust CCB’s Ernie Roessler, who became CEO of the combined company, at the cost of $10 million if he chose to do so. Garrett exercised the option and cut the check in mid-2003 three years after the MOE was consummated.
Fairness Opinions for MOEs
MOEs represent a different proposition for the financial advisor in terms of rendering advice to the Board. An MOE is not the same transaction as advising a would-be seller about how a take-out price will compare to other transactions or the company’s potential value based upon management’s projections. The same applies to advising a buyer regarding the pricing of a target. In an MOE (or quasi-MOE) both parties give up 40-50% ownership for future benefits with typically little premium if one or both are publicly traded. Plus there are the social issues to navigate.
While much of an advisor’s role will be focused on providing analysis and advice to the Board leading up to a meaningful corporate decision, the fairness opinion issued by the advisor (and/or second advisor) has a narrow scope. Among other things a fairness opinion does not opine:
- The course of action the Board should take;
- The contemplated transaction represents the highest obtainable value;
- Where a security will trade in the future; and
- How shareholders should vote.
What is opined is the fairness of the transaction from a financial point of view of the company’s shareholders as of a specific date and subject to certain assumptions. If the opinion is a sell-side opinion, the advisor will opine as to the fairness of the consideration received. The buy-side opinion will opine as to the fairness of the consideration paid. A fairness opinion for each respective party to an MOE will opine as to the fairness of the exchange ratio because MOEs largely entail stock-for-stock structures.
Explaining the benefits of an MOE and why ultimately the transaction is deemed to be fair in the absence of a market premium can be challenging. The pending MOE among Talmer Bancorp Inc. (45%) and Chemical Financial Corp. (55%) is an example. When the merger was announced on January 26, the implied value for Talmer was $15.64 per share based upon the exchange ratio for Chemical shares (plus a small amount of cash). Talmer’s shares closed on January 25, 2016 at $16.00 per share. During the call to discuss the transaction, one analyst described the deal as a “take under” while a large institutional investor said he was “incredibly disappointed” and accused the Board of not upholding its fiduciary duty. The shares dropped 5% on the day of the announcement to close at $15.19 per share.
Was the transaction unfair and did the Board breach its fiduciary duties (care, loyalty and good faith) as the institutional shareholder claimed? It appears not. The S-4 notes Talmer had exploratory discussions with other institutions, including one that was “substantially larger”; yet none were willing to move forward. As a result an MOE with Chemical was crafted, which includes projected EPS accretion of 19% for Talmer, 8% for Chemical, and a 100%+ increase in the cash dividend to Talmer shareholders. Although the fairness opinions did not opine where Chemical’s shares will trade in the future, the bankers’ analyses noted sizable upside if the company achieves various peer-level P/Es. (As of mid-July 2016, Talmer’s shares were trading around $20 per share.)
Fairness is not defined legally. The Merriam-Webster dictionary defines “fair” as “just, equitable and agreeing with what is thought to be right or acceptable.” Fairness when judging a corporate transaction is a range concept. Some transactions are not fair, some are in the range—reasonable, and others are very fair.
The concept of “fairness” is especially well-suited for MOEs. MOEs represent a combination of two companies in which both shareholders will benefit from expense savings, revenue synergies and sometimes qualitative attributes. Value is an element of the fairness analysis, but the relative analysis takes on more importance based upon a comparison of contributions of revenues, earnings, capital and the like compared to pro forma ownership.
Investment Merits to Consider
A key question to ask as part of the fairness analysis: are shareholders better off or at least no worse for exchanging their shares for shares in the new company and accepting the execution risks? In order to answer the question, the investment merits of the pro forma company have to be weighed relative to each partner’s attributes.
- Profitability and Revenue Trends. The analysis should consider each party’s historical and projected revenues, margins, operating earnings, dividends and other financial metrics. Issues to be vetted include customer concentrations, the source of growth, the source of any margin pressure and the like. The quality of earnings and a comparison of core vs. reported earnings over a multi-year period should be evaluated.
- Expense Savings. How much and when are the savings expected to be realized. Do the savings come disproportionately from one party? Are the execution risks high? How does the present value of the after-tax expense savings compare to the pre-merger value of the two companies on a combined basis?
- Pro Forma Projected Performance. How do the pro forma projections compare with each party’s stand-alone projections? Does one party sacrifice growth or margins by partnering with a slower growing and/or lower margin company?
- Per Share Accretion. Both parties of an MOE face ownership dilution. What is obtained in return in terms of accretion (or dilution) in EBITDA per share (for non-banks), tangible BVPS, EPS, dividends and the like?
- Distribution Capacity. One of the benefits of a more profitable company should be (all else equal) the capacity to return a greater percentage of earnings (or cash flow) to shareholders in the form of dividends and buybacks.
- Capital Structure. Does the pro forma company operate with an appropriate capital structure given industry norms, cyclicality of the business and investment needs to sustain operations? Is there an issue if one party to an MOE is less levered and the other is highly levered?
- Balance Sheet Flexibility. Related to the capital structure should be a detailed review of the pro forma company’s balance sheet that examines such areas as liquidity, funding sources, and the carrying value of assets such as deferred tax assets.
- Consensus Analyst Estimates. This can be a big consideration in terms of Street reaction to an MOE for public companies. If pro forma EPS estimates for both parties comfortably exceed Street estimates, then the chances for a favorable reaction to an MOE announcement improve. If accretion is deemed to be marginal for the risk assumed or the projections are not viewed as credible, then reaction may be negative.
- Valuation. The valuation of the combined company based upon pro forma per share metrics should be compared with each company’s current and historical valuations and a relevant peer group. Also, while no opinion is expressed about where the pro forma company’s shares will trade in the future, the historical valuation metrics provide a context to analyze a range of shareholder returns if earning targets are met under various valuation scenarios. This is particularly useful when comparing the analysis with each company on a stand-alone basis.
- Share Performance. Both parties should understand the source of their shares and the other party’s share performance over multi-year holding periods. For example, if the shares have significantly outperformed an index over a given holding period, is it because earnings growth accelerated? Or, is it because the shares were depressed at the beginning of the measurement period? Likewise, underperformance may signal disappointing earnings, or it may reflect a starting point valuation that was unusually high.
- Liquidity of the Shares. How much is liquidity expected to improve because of the MOE? What is the capacity to sell shares issued in the merger? SEC registration and even NASADQ and NYSE listings do not guarantee that large blocks can be liquidated efficiently.
- Strategic Position. Does the pro forma company have greater strategic value as an acquisition candidate (or an acquirer) than the merger partners individually?
Conclusion
The list does not encompass every question that should be asked as part of the fairness analysis for an MOE, but it points to the importance of vetting the combined company’s investment attributes as part of addressing what shareholders stand to gain relative to what is relinquished. We at Mercer Capital have over 30 years of experience helping companies and financial institutions assess significant transactions, including MOEs. Do not hesitate to contact us to discuss a transaction or valuation issue in confidence.
Analyzing Financial Projections as Part of the ESOP Fiduciary Process | Appraisal Review Practice Aid for ESOP Trustees
This article first appeared as a whitepaper in a series of reports titled Appraisal Review Practice Aid for ESOP Trustees. To view or download the original report as a PDF, click here.
This publication provides general insight about emerging issues and topics discussed in recent forums and events sponsored by the ESOP Association (“EA”), The National Center for Employee Ownership (“NCEO”) and elsewhere. Much of the current discussion is related to general valuation discipline, but none are new to a longstanding agenda within the ESOP community. Heightened Department of Labor (“DOL”) attention and the recent settlement agreement concerning the Sierra Aluminum case are driving renewed discussion of numerous critical topics within the ESOP fiduciary domain.
All guidance, perspective and other information contained in this publication is provided for information purposes only. The issues and treatments highlighted in this publication do not produce the same response from all ESOP professionals and valuation practitioners. Certain treatments and perspectives contained herein lack consensus in the valuation profession and may be addressed or treated using alternative rationales. This publication is not held out as being the position of or recommended treatment endorsed by the EA or the NCEO. The purpose of this publication is to alert and inform ESOP stakeholders and fiduciaries regarding the rising standards of practice and prudence in the valuation of ESOP owned entities.
Introduction
In recent years there has been increasing concern among ESOP sponsors and professional advisors (trustees, TPAs, business appraisers, legal counsel) regarding the scrutiny of the DOL, the Employee Benefits Security Administration (“EBSA”), and the Internal Revenue Service (“IRS”). These entities (and agencies thereof) are tasked with ensuring that ESOPs comply with the Employee Retirement Income Security Act (“ERISA”) as well as with various provisions of the federal income tax code concerning qualified retirement plans (including ESOPs). Citing concerns for poor quality and inconsistency in business appraisals, the DOL has sought in recent years to expand the meaning of “fiduciary” under ERISA to include business appraisers. In the most recent forums of exchange and deriving from various court actions, there are numerous areas of concern that DOL/EBSA appear to have regarding ESOP valuations. These areas of focus include but are not limited to:
Valuation Issues Receiving Recent Attention and Scrutiny
- The use of financial projections in ESOP valuation
- The prevalence and manifestation of conflicts of interest concerning pre- and post-transaction advisory services
- The use and application of control premiums in ESOP valuation
- The valuation of and implications stemming from seller financing used in a great many transactions now coming under review
- The poor quality of ESOP valuation reports and the attending inconsistencies between narrative explanations and methodological execution; and,
- The lack of or inconsistent consideration of ESOP repurchase obligation and how it interacts with ESOP valuation
These topics have received heightened attention from numerous committees of the ESOP Association including the Advisory Committees on Valuation, Administration, Fiduciary Issues, Finance, and Legislative & Regulatory. This paper will focus on the use of financial projections in ESOP valuations. While all of the cited issues are of importance, the use (or misuse) of financial projections is often the most direct cause of over- or under-valuation in ESOPs. Other Mercer Capital publications provide insight regarding control premiums, the market approach, and other important ESOP valuation topics.
Projections Used In ESOP Valuations: Assessing Growth Rate Assumptions In Valuation
Business appraisers who practice valuation using one or more credentials in the field are required to adhere to their respective practice standards (ASA, AICPA, NACVA, CFAI). Additionally, there are overarching standards and guidance that generally dictate to and govern the valuation profession and the general considerations and content of a business valuation. The Appraisal Standards Board of The Appraisal Foundation promulgates the Uniform Standards of Professional Appraisal Practice (“USPAP”) and the IRS issued Revenue Ruling 59-60 (“RR59-60”) more than 50 years ago.
Collectively, these standards and protocols provide a basic outline for procedural disciplines, analytical methodologies, and reporting conventions. Specificity on the disciplines and procedures for vetting a financial projection (and growth rates in general) are generally lacking in the body of valuation standards, but that does not exempt appraisers and trustees from the core principle that a valuation must collectively (and in its constituent parts) constitute informed judgment, reasonableness and common sense.
Traditional financial and economic comparative analysis suggest vetting a projection by way of studying it from numerous perspectives:
- How do the projections compare to the historical and prevailing financial performance of the subject enterprise being valued (“relative to itself over time”)?
- How do the forecasted results compare to the past and expected performance of peers, competitors, the industry, and the marketplace in general (“relative to others over time”)?
- How do the projections reflect the specific outlook and capacity of the subject enterprise (“relative to its specific opportunity”)?
The answers to these questions provide the appraiser a foundation upon which to construct the other required modeling elements in the valuation. An appraiser may elect to disregard projections in the valuation process in situations where forecasted outcomes are deemed beyond the organic and/or funded capacities, competence, and/or opportunity of the subject enterprise. An appraiser may elect to consider justifiable risk and/or probability assessments, among other adjustments, that serve to hedge the projections and their respective influence on the conclusions of the valuation report.
Regarding valuation and the general concern for rendering valuations that heighten an ESOP trustee’s anxiety for a sustainable ESOP benefit over time, many appraisers elect to capture only proven performance capacity, avoiding the counting of eggs with questionable fertility. If today’s projection proves excessive in the light of future days (when the DOL/EBSA comes calling), the concern for a prohibited transaction rises and poses significant risk and potentially fatal consequences for the plan and the parties involved.
Discrete Projections versus Implied Projections
A complete, formal appraisal opinion requires the consideration of three core valuation approaches. These approaches are the Cost, Income, and Market Approaches. Generally speaking, valuations of business enterprises using the Income or Market Approaches contain either an explicit projection in the methodology or capture an underlying implicit projection embedded in (or implied by) a singular perpetual growth rate assumption or in a singular capitalization metric. Appraisers and reviewers that fail to recognize this are simply blind to the basic financial mechanics of income capitalization. Accordingly, the concern for projections, in the view of this practitioner, extends beyond the discrete modeling of cash flow to the broader domain of growth in general. For the sake of further discussion, assume the following comments relate specifically and only to the Income Approach and its underlying methods.
Discounted Cash Flow Method versus Single-Period Capitalization
The size and sophistication of the subject enterprise often dictates whether or not an appraiser will enjoy the benefit of management-prepared projections. Projections are often crafted for purposes of promoting operational and marketing outcomes, or for satisfying the reporting requirements that many companies have with their lenders, shareholders, suppliers and other stakeholders. In cases where the subject enterprise is small and its performance subject to unpredictable patterns, appraisers commonly employ a single period capitalization of cash flow or earnings. In lieu of a series of discrete cash flows projected over the typical five-year future time horizon, the appraiser simply employs a measure of current or average performance and applies a single-period capitalization rate (or capitalization multiple as the case may be) in order to convert a base measure of cash flow directly into an indication of value. Seeking not to speculate on a finite sequence of future growth rates, many appraisers employ a rule-of-thumb mentality by correlating cash flow growth to a macroeconomic, inflationary, or industry-motivated rate, often ranging from 3% to 5%. In many instances this could be appropriate; in others it could reflect surprisingly little attention regarding the most basic long-term market externalities and/or internal opportunities of the subject company.
The veil of a single-period capitalization approach does not relieve the appraiser from examining the various combinations of growth that could reasonably apply to the base measure of cash flow assumed in an appraisal. Many appraisers are of the mind that in the absence of management-prepared projections, no discrete projection can be developed and thus no Discounted Cash Flow Method can be employed. In lieu of fleshing out the dynamics of operational cash flow, the required capital investments, working capital needs, or the cash flow benefits deriving therefrom, the appraiser simply defaults to the time-honored single period capitalization of cash flow and calls it a day. The binary position that an appraiser cannot prepare cash flow projections lacks credibility and in some cases is simply flawed thinking. Furthermore, any appraiser that applies a perpetual growth rate assumption to develop a capitalization rate is, in fact, asserting a projection over some projection horizon. This is the simple and inescapable mathematical construct that is the Gordon Growth Rate Model. With all due respect and concern about projections – appraisers, trustees and regulators must recognize the inherent projection represented by a perpetual growth rate assumption in a single-period capitalization method. In essence, there is no income approach without either an explicit or implicit projection of future cash flows.
Performing Due Diligence On Company Issued Projections
Imagine you are a trustee tasked with reviewing an ESOP valuation prepared by the plan’s “financial advisor.” Business appraisers in their role as the trustee’s financial advisor issue opinions of value they believe to be supported by the facts and circumstances, but ultimately the appraisal of the plan assets is the trustee’s responsibility. How can the stakeholders and fiduciaries of an ESOP gain understanding and comfort in projections prepared by the Company and employed by the appraiser?
The foundation begins with the general process of examining historic and prospective growth. Company projections must make sense to gain inclusion in the valuation of an ESOPowned company. A disconnect or sudden shift (whether in magnitude, trend or directionality) in expected performance is a red flag that requires specific explanation. Absent a sound rationale for a significant change in the pattern of future performance, projections that seem too good (or too bad) to be true must be reconciled with management and potentially disregarded in the appraisal process.
Not all projections are created equally. Some are prepared for budgetary purposes and are constrained to a single year of outlook. Projections may be prepared for many reasons including the study of operational capacity, financial feasibility concerning capital investments, debt servicing and lender requirements, sales force management, incentive compensation, and many other reasons. Projections may be the product of a bottom-up process (originating in the operational ranks of the business) or may originate as a top-down exercise (descending from the C suite).
Business appraisers cannot be indiscriminate in their employment of forward-looking financial information. Understanding the goals, intentions, motivations, and possible shortcomings of a budget or projection is vital to assessing the viability of a direct or supporting role for the projections in the valuation modeling. The nature and maturity of the business are also significant to understanding and troubleshooting a projection. For the sake of further commentary we will assume that most ESOP companies are relatively mature and not subject to the intricacies and uncertainties of valuing a start-up business (albeit, even mature business can experience significant swings in business activity).
Projection Due Diligence Inquiries
- Who prepared the projections?
- What is the functional use or purpose of the projection?
- How experienced is the Company in preparing projections?
- When were the projections prepared?
- Do the projections incorporate increased (new) business, and if so, in what manner is the new business being generated?
- Do the projections reflect the discontinuation of specific segments of the revenue stream?
- Are the financial projections reconciled to or generated from a meaningful expression of unit volume and pricing?
- Does the company operate as the exclusive or concentrated agent for certain suppliers and/or customers?
- How does the company’s current projection reconcile to past projections?
- How closely does the company’s most recent actual performance compare to the prior year’s projection?
- Does the projection depict a transition in industry or economic cycles that may justify near-term abrupt shifts in expected outcomes?
- How comprehensive are the projections and the supporting documentation?
- What are some typical warning signs that a projection may be too aggressive or pessimistic?
Who prepared the projections?
A bottom-up process whereby front-line managers project their respective business results, which are then combined to create a consolidated projection, is often the most informative projection. Motivation mindset can be important as many projections are designed to “under-promise” results. Conversely, some projections are deliberately overstated to impart a mission of growth or goal-oriented outcomes. Projections that emanate and evolve through multiple levels of an organization are typically subject to more checks and balances than projections that originate in the vacuum of a single executive’s office. Conversely, such a process can also depict an organizational mob mentality that could distort reasonable expectations.
A CFO’s budget may vary significantly from the sales projection of a sales manager or the projections of a senior executive. In some cases, an appraiser may review projections prepared for a lender that vary from a strategic plan projection. Often the differences can be reconciled. Projections prepared for external stakeholders such as lenders and as communicated to shareholders and possibly endorsed by a board of directors are likely to be the most relevant and appropriate for the valuation.
If numerous projections exist, the trustee and appraiser are best advised to inquire about the outlook that best reflects a consensus of the most likely outcome as opposed to aspirational projections that are tied to new and/or speculative changes in the business model. In a recent engagement, a client was deploying significant capital to extend core competencies into adjacent markets. Rather than the hockey stick of growth most typical of such projections, this client’s net cash flows were relatively neutral in the foreseeable future because they included significant capital and working capital investment, which effectively paid for increased business volume. The premise behind their strategy was simply one of being larger and more diverse under the assumption that size and diversity facilitated a less risky business proposition and a broader range of potential long-term outcomes for the business.
What is the functional use or purpose of the projection?
Functional use is often linked to who prepares the projection. Be wary of projections that may intentionally (or as a byproduct of purpose) under or over shoot actual expected forecast results. In many cases a bottom-up projection process receives the review of senior management before becoming a functional element of business planning and accountability.
How experienced is the Company in preparing projections?
Are past projections reconciled to actual results with adequate explanation for variances? Firms with consistent and organized processes often produce more informative projections. Granted, a company may consistently under or over perform their projection. The quality of a projection may be better measured by its consistency over time than by its ultimate accuracy in a given year. One clue to the experience and care taken in the projection process is the model underlying the projection itself. For example, was the forecast model developed using numerous discrete modeling assumptions (such as year-to-year growth, and year-to-year margin) or from more global assumptions that are carried across all years in the projections? While modeling complexity can serve to obscure and is not automatically a sign of a well-developed projection, the inability of a projection model to be adapted quickly to alternative scenarios and assumptions may be a sign that the model was not studied for its sensitivity and reasonableness. A projection that appears to be “living” and easily modified could be a sign that the company actually uses the projection and modifies it in real time to assess variance and to modify assumptions as business conditions evolve and change. Appraisers and trustees should empower themselves with the ability to study the sensitivity and outcomes of a projection. Projections that lack detailed growth and margin details (year-to-year and CAG) should be replicated and/or reverse engineered in some fashion to facilitate basic stress testing and/or sensitivity analysis before the appraiser simply accepts the projections.
When were the projections prepared?
In general, valuation standards call for the consideration of all known or reasonably knowable information (financial, operational, strategically or otherwise) as of the effective date of the appraisal, which for most ESOPs is the end of the plan year. As a matter of practicality, financial statements (audits and tax returns) are not prepared for many months subsequent to the plan year end. Likewise, projections are often compiled in the first few months of the following year and may be influenced by the momentum of activity after the valuation date.
Appraisers typically cite financial information delivered after the valuation date to be known or knowable and projections, while potentially exposed to a hint of subsequent influence, are often integrated without much question regarding their timeliness to the valuation date. In many cases, clients struggle to get information to us in order for their 5500s to be filed in a timely fashion (typically July 31st). In most cases we find that projections prepared after the end of the plan year are perfectly fine to employ. We inquire with management if there are aspects of the projection that were influenced by subsequent events and if so, with what degree of certainty could the subsequent event or activity have been expected at the valuation date. In some situations it may be advisable or reasonable to alter a projection’s initial year due to subsequent influences; typically the more distant years of a projection follow a pattern of knowable expectation unless there has been a material subsequent event that alters the global posture of the business. If a material subsequent event occurs that is not factored into the projections, then as a matter of common sense, the appraiser may elect not to perform a DCF, or better yet, may request that the projections be modified to take the event into financial consideration so that a DCF can be more accurately informed regarding changes in business posture.
Do the projections incorporate increased (new) business, and if so, in what manner is the new business being generated?
If a projection reflects a pattern of significant change in business activity, it is vital to consider whether new business represents an extension or replication of past expansions. If the company has proven the ability to expand and absorb new business (territory, staffing, productive capacity, etc.) then a projection depicting such an increase is likely reasonable, but should be gauged by past similar experiences whenever possible. And, any business expansion must be reflected in the investment and working capital charges applied to develop net cash flows. We refer to this as “buying the growth” – remember there is no free lunch.
Projections with significant topline and profit growth must reflect adequate investment. This investment may take the form of the organic investment in the existing business lines or strategically by way of acquisition. If the projections include a speculative expansion into new revenue areas, the appraiser should properly assess the likelihood of successfully achieving the projection. Business extensions into logical adjacencies which leverage pre-existing supply and customer relationships may be more believable than the widget company whose projections include entry into the healthcare industry.
In cases where projections include speculative ventures, the appraiser has numerous potential treatments that can temper speculative (high-risk) contributions, essentially replicating the framework applied in the valuation and capital raising processes for start-ups or early-stage companies. In some cases the appraiser may request the projection be revised to eliminate contributions from new growth projects that lack adequate investment or are simply too speculative to consider until they become observable in the reported financial results of the business. In some rare cases, not only is the projection hard to believe, but concerns are compounded by the risky and foolish deployment of capital. Betting the farm on the next reinvention of the wheel is not the making of a sustainable ESOP company.
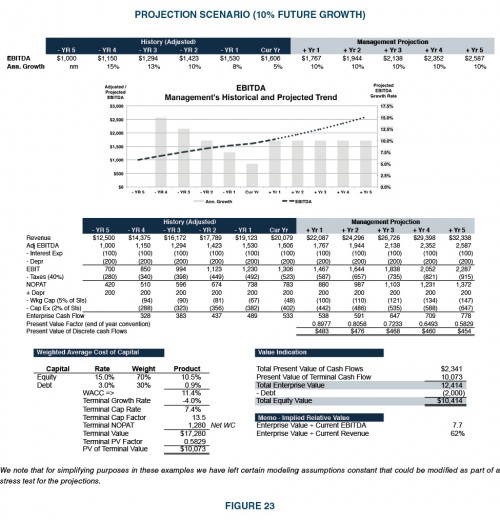
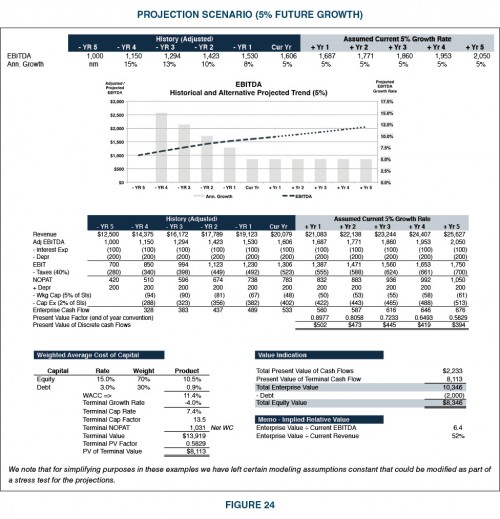
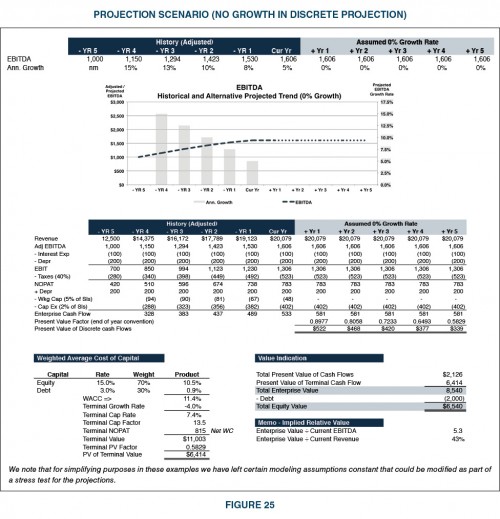
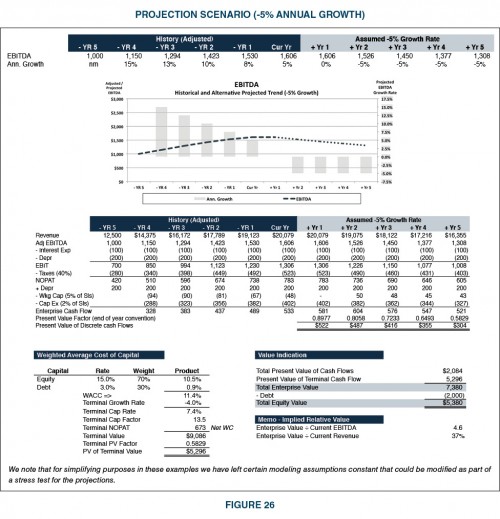
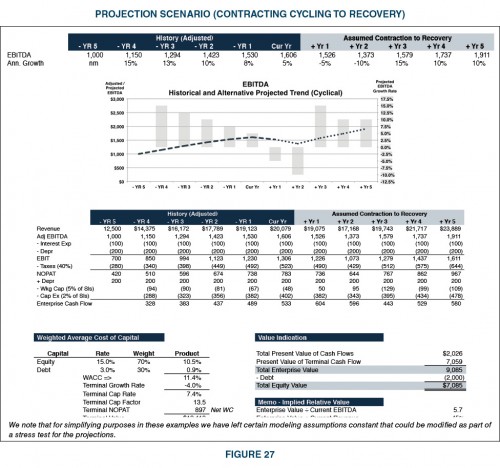
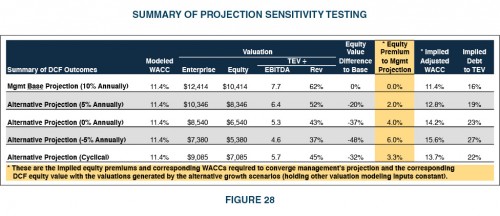
Perhaps it’s a dirty little secret in the hard-to-value world of closely held equity, but valuations using the standard of fair market value (as called for under DOL guidance) are inherently lagging in nature and typically less volatile than is the stock market or the public peers to which a company may be benchmarked. This is generally a function of regression to the mean captured in virtually every conservatively constructed projection and DCF model. The terminal value of a DCF is effectively a deferred single period capitalization using the Gordon Growth Model and often comprises 50% or more of the total value indicated under the method. Near-term performance swings (whether favorable or not) get smoothed out in the math of the terminal value calculation. As depicted in the appended growth scenarios and projection modifications, the regression of future performance to a targeted benchmark can have a similar influence on valuation as the old-guard habit of using historical averages in a single period capitalization method. The primary valuation differences between such a DCF and single period capitalization stem from the specific cash flows during the discrete projection period (years one through five).
Do the projections reflect the discontinuation of specific segments of the revenue stream?
A sound reason for employing a DCF model is to capture the pro forma performance of a business based on its going-forward revenue base. Most mid to large sized businesses, particularly mature ESOP companies, experience contraction and rationalization of business lines and markets over time. In many cases, the valuation might reasonably improve based on the discontinuation of unprofitable operations and the recapturing of poorly deployed capital. However, care must be taken to understand how all P&L accounts from revenue down to profit are affected by changes in facilities, products, services, staffing, etc. Projections that pretend unsupportable improvement by way of the deletion of a relatively small portion of the business lines are inclined to excessive optimism and may suggest the belief in bigger issues that management deems too daunting to fix. Regarding profitability, so-called “addition through subtraction” is similar to the concern public market investors have with public companies that cut expense merely to manufacture earnings in the near term. As the maxim goes, you can’t cut your way to success in the business world.
Are the financial projections reconciled to or generated from a meaningful expression of unit volume and pricing?
Financial projections that lack an operational perspective can be difficult to assess. Not all business are margin based, many are spread based – meaning that profits are more of a function of a nominal spread over cost as opposed to some percentage of sales. This is particularly true of service businesses, financial services entities, and commodity driven operations. Accordingly, neither past nor future performance can be properly understood without some idea of how much stuff is getting sold and at what price. In many cases, the required comfort level of a projection simply cannot be reached without it. Breaking revenue into primary volume and price components, as well as further into its departmental or categorical groupings, allows appraisers and trustees a better understanding of the projection and its relation to past performance and market expectations. Revenue per full-time equivalent employee, units produced per labor hour and many other performance metrics are helpful in teasing out reality from a potentially fictional projection.
Does the company operate as the exclusive or concentrated agent for certain suppliers and/or customers?
Our comments here exclude the consideration of risk associated with high levels of concentration on the rain-making parts of a business – such considerations are often tackled in the appraiser’s assessment of the cost of capital by way of firm-specific risk.
Many dealerships, distributors, parts manufacturers, fabricators and service companies owe their existence to market demand created by their suppliers and customers. Many companies service the needs of customers and suppliers by effectively outsourcing some aspect of their respective industry model to an external provider. For example, a producer of value-added materials may use an external company to provide sales and logistical support to get product to its end users (i.e. classic bulk breaking, repacking and transportation). Regardless of which leg of the multi-leg industry the subject business may represent, the assessment of projected growth should include a consideration of what is happening to suppliers and customers (the other legs of a common stool). This same path of inquiry serves the dual purpose of understanding the risk side of the valuation equation. If these multiple legs of consideration don’t reconcile, the projection could prove too unstable for use in the valuation.
How does the company’s current projection reconcile to past projections? How closely does the company’s most recent actual performance compare to the prior year’s projection?
Studying projection variance can be a highly useful tool in communicating about value and in assessing the correlation between expectations and actual results. Let’s face it – we all like it when people do what they say they are going to do. But the first thing we know about any projection today is that it will be wrong tomorrow. Variances need to be explained and reconciled against the continuing willingness of the appraiser (and the trustee) to employ projections moving forward. Providing financial feedback to management and the trustee during the process of due diligence and in the form of a valuation can help refine the projection process over time. Just as we reserve the right to improve how we do things in the valuation world, so too must our clients have the leeway to refine and improve their processes.
Valuation is a forward looking (ex-ante) discipline. History can be highly instructive regarding how projections are scrutinized in real time. Projections that under-promise and over-deliver tend to undervalue companies in real time. Conversely, projections that over-promise and under-deliver can lead to an over-statement of value. In the case of the later occurrence, most appraisers operate under the axiom of “fool me once shame on you, fool me twice shame on me.” Ultimately, attempts at value engineering via optimistic projections need to be balanced with an equal measure of devil’s advocacy from both appraiser and trustee. Ultimately, a DCF model views the impact of any projection through a risk-adjusted lens. The process of hedging a projection generally begins with an observation of historical variances in projected performance and actual results over time, with the primary emphasis place on most recent periods. Projections that appear to overshoot are often hedged either through risk assessment, probability factoring, or a more exotic multi-outcome analysis.
Does the projection depict a transition in industry or economic cycles that may justify near-term abrupt shifts in expected outcomes?
In recent decades the concept of the traditional five-year business cycle lost favor in some circles. Thought evolution evolved to encompass a lengthier cycle of ten years, mitigated volatility (not so high and not so low as in the past), higher fundamental causation (such as globalization) versus the classical cyclical drivers (such as swings in productivity), continuing evolution of the information sector, disruptive technologies, and since the early 2000s, the persistence of and sensitivity to geopolitical and terrorist events. Then along came the debt crisis followed by the great recession. Lessons of business cycles past have now garnered renewed attention and distant economic history seemed more relevant despite the modernization, globalization and regulation of the economy.
Presently, we are witness to a reasonably stable economy that is slowly being weaned from years of fiscal and monetary life support and subsidization. For us business appraisers, we are beginning to lock in on the new norms of our clients’ businesses. For the last many years, our clients were reticent to speculate on a projection (“no visibility”). Many clients recall with anger and humility the great glory projected from atop the last peak cycle in 2006. Almost a decade later, many have finally re-achieved their former glory. Many others can only look up from the corporate grave. From this point forward we can only assume that some version of the business cycle is still with us. Many are now disposed to the concept of a prolonged period of relatively modest and unevenly distributed economic performance, similar to the patterns demonstrated by Japan and characterized as “secular stagnation.” The academicians can argue about how to brand it; valuations professionals and ESOP Trustees are faced with how to consider it in our valuations.
Speaking from personal experience, there is a greater appreciation for industry cycles as opposed to macroeconomic cycles. Given such, we see companies vacillate between boom and bust based on numerous underlying elements and drivers that are not purely correlated to the overall economy. Recall the classic business cycle (peak / contraction / trough / expansion / peak). Appraisers and trustees must be attentive and weary of projections that cannot be supported by reasonable facts and circumstances. Some may wonder – when are projections unrealistic? The truthful answer often includes the echo: “not sure, but I know it when I see it.”
Companies emerging from the trough of a business/industry cycle may have unusually robust projections. High growth during a period of recovery does not constitute grounds for the dismissal of the projection. Likewise, declining growth from a peak level of performance is not necessarily overly pessimistic. As discussed in the growth scenarios studied in the appended examples, regression to a mean level of future expectation can be achieved in varying ways. The concern for appraisers and trustees alike is the comfort and common sense of near-term expectations relative to recent performance and the level of steady-state performance assumed in the terminal value modeling of the DCF. Ex-post and ex-ante trend analysis, as well as benchmarking to relevant indices from both public and private sectors is vital to establishing the context of a specific projection.
On the weight of evidence and common sense, if a projection is highly contrary to external expectations and lacks symmetry with the proven capabilities of the company, appraisers and trustees are cautioned from directly using the projection. An alternative approach for employing the projection is iterating the discount rate and terminal value modeling assumptions required to equate the DCF value indication to value indications developed from other methods (past and present). There are many instances when data lacks reliability during a given period or cycle. In such cases we tend to study the information and reconcile it to the alternative valuation results deemed more reliable. In this fashion we alert the report reviewer that projections exist that may appear contrary to the weight of history and/or external expectations.
How Comprehensive are the Projections and the Supporting Documentation?
Are the projections lacking detail and limited in supporting documentation? Projections that are not integrated into a full set of forward looking financial statements and that lack explanation for critical inputs may be unreliable or require significant augmentation before being integrated into a DCF valuation model. As a matter of practicality, many companies do not project more than a simple income statement. Does the lack of a balance sheet and a cash flow statement automatically exclude the projection from consideration? Not in my view, however, under many circumstances there could be a need for augmentation to consider numerous significant aspects required to develop the typical DCF model. These considerations include:
- Capital expenditures, which initially decrease cash flow before generating the returns that constitute future growth. Not only is the dollar amount a significant consideration, but the capacity/volume effect of physical additions relates to future growth modeling.
- Incremental working capital requirements, which typically absorb a portion of growth dollars in perpetuation of higher operating activity, or which may accumulate on the balance sheet in a downturn when demand for financial resources can temporarily decline.
- In cases where a DCF is used to directly value the equity of an enterprise, changes in net debt must be captured. Are the cash flows sufficient to cover the company’s term debt and line of credit obligations? Are new sources of debt capital required to support capital and working capital grow?
Collectively, these cash flow attributes can have a significant effect on the discrete cash flows of an entity during the projection. Absent a balance sheet and/or cash flow statement, the impact of these considerations may be difficult to properly assess. In cases where the business is not deploying significant new capital and the projection is following a more or less mature pattern, capital expenditures and incremental working capital may be easily determined based on historical norms and comparative analysis with peer data. Accordingly, a full detailed projection of the balance sheet may not be required to develop reasonable modeling and outcomes. As always, a vetted and complete projection of the financial statements is desirable.
Supporting documentation can take numerous forms. Reconciliation of modeling assumptions to external drivers, operating activities, market pricing, throughput capacity, supplier expectations and trends, bellwether industry peers and market participants, downstream and upstream expectations and many other supporting considerations is always helpful but generally lacking for many projections. Often, a review of the projections using such benchmarks leads to a modification or adjustment of the projections by management. In this fashion, the appraiser’s and/or trustee’s review serves to effectively adjust the projections before and/ or during their use in a DCF model – thus the need for a flexible and adaptive modeling platform built from the projection.
What are some typical warning signs that a projection may be too aggressive or pessimistic?
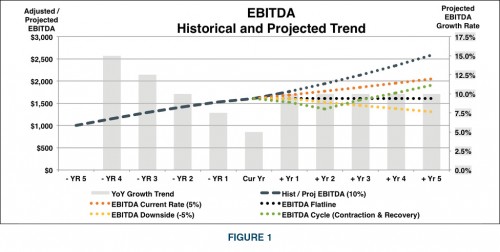
A baseline for assessing reasonableness or believability is always a good first step. A graphic representation of revenue, EBITDA and key volume measures can assist a reviewer in studying the reasonableness of a projection. Supernormal and/or counter-trend activity requires a compelling justification. Let’s use the information in the following graphic as a baseline for demonstrating some fundamental curiosity and addressing some basic questions regarding reasonableness.
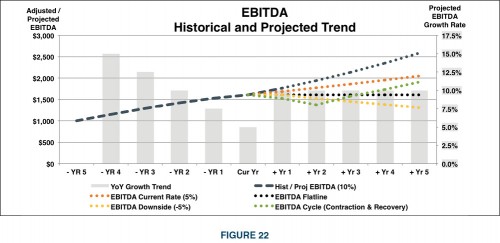
The five-year trend for adjusted EBITDA at the valuation date reflects a pattern of strong growth (illustrated by the dotted blue line in Figure 1), but at a decelerating rate (illustrated by the columns in Figure 1). The projected annual growth rate for each of the next five years is 10%. In this case, management represents that the 10% annual growth projection is based on the compound annual growth rate for the five years leading up to the valuation date. This is an all too familiar “technical” rationale for growth forecasting. However, it begs the question of why the decelerating trend would suddenly flip favorable as opposed to continuing its decline or perhaps stabilizing at the most recent level of modest growth. Of course, the current trend could mature as a contraction in performance before an upturn that repeats the prior cycle.
Figure 1 depicts a wide variety of plausible alternative projections based on a technical review of the trend and a healthy dose of analyst scrutiny of management’s optimistic projection. The projection provided by management could easily be an order of magnitude overstated relative to other plausible outcomes. If EBITDA growth remains at the most recent rate (5% annually) then management’s projection is overstated 25% by year five (the orange dotted line). If EBITDA flatlines at current levels management’s year five projection is overstated by 60% (the black dotted line). If the deceleration of growth actually turns to a steady contraction (5% annually) then management’s projection is almost 100% overstated. If a modest near-term contraction is followed by a renewal of the previous growth cycle (the green dotted line), then management’s base 10% annual growth projection is overstated by 35% in year five. We could iterate infinite variations in future outcomes, but I submit that the variations shown above stem from a reasonable risk averse, conservative framework. The real concern is how well the projection reconciles to external and internal drivers that have proven to influence past business outcomes and/or drivers that are virtually assured to influence future outcomes.
In the present case example, the platform of management’s projection is built on the prevailing economy (generally favorable but inconsistent growth) and involves a market-beta industry (highly correlated to the overall economy). More specifically, the subject company is a construction contracting concern whose early growth began from a deep trough in the cycle, then was temporarily juiced with shovel-ready government funded activity which eventually dried up as the general economy stabilized. New norms are uncertain but project budgets and financings are expected to be more difficult as real interest rates become more than zero and underwriting hurdles remain quite high. In this light, a simple extension of the five-year CAG into the future for five more years appears to ignore the decelerating trend. Absent specific contracts and backlog, industry-based drivers, and perhaps geographic hotbeds of significant in-migration, management’s projection outcome appears over optimistic if not outright aggressive.
Projections that appear contrary to external trends and opportunities and which are not reconciled to the company’s capacity (whether existing or planned with the associated capital required) may need to be disregarded in the valuation process. Alternatively, the appraiser and trustee could view the projections with heighten concern for their realization and elect to effectively hedge the projections using appropriate discount rates, probability assessments, or other treatments that mimic the behavior of hypothetical investors. Ultimately, the reliance or weight placed on a projection based valuation method demonstrates the comfort of the appraiser/trustee with the method. If the final weights or reliance are placed on alternative valuation methods with materially different value indications than the DCF, the appraiser/trustee is effectively disregarding or modifying the projection. Surely, every valuation conclusion, under any valuation approach or method, has an underlying implied projection through which the same value outcome is produced.
Rules Of Thumb For Growth Rates
Recent Macro-Economic History
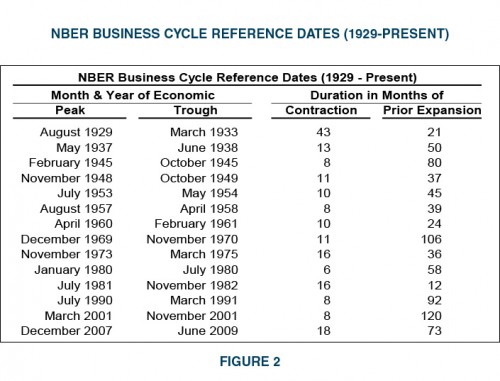
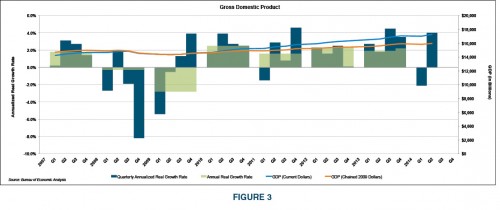
Assuming a company’s growth and/or projected financial performance is highly correlated to general macroeconomic growth is often an underpinning of long-term sustainable growth rates. Care must be taken when observing data reported from government agencies as such data can be “real” or “nominal” in quantification. Real rates are generally representative of movements net of the influence of inflation and nominal growth is generally total growth including inflation. Accordingly, growth rates in valuations that mirror inflation are effectively zero real growth rates. Gross domestic product is almost always reported and discussed in real terms, meaning the addition of a long-term inflation rate is typically called for in cases where the appraiser/trustee considers a company’s performance to be similar to that of the overall economy. For perspective, Figure 2 presents the history of economic cycles and the more recent performance of real GDP over the last several years (Figure 3).
On the basis of inflation of approximately 2.5% in recent years, nominal overall economic growth has approximated 4.5% to 5% subsequent to the great recession. Ah, the rule of 5% +/- for growth. There is a wide variety of alternative economic measures and subsets of GDP that could serve as a proxy for long-term sustainable growth in most valuations. Of course, such growth rates may fail to capture all the underpinnings of a given industry or market and may also fail to recognize the specific financial and operational details of a given company. Most companies tend to grow in phases as capital investment, hiring, product offerings and other business attributes evolve over time. This discussion could extend to an infinite spectrum of data and benchmarks.
Equity Market Perspective
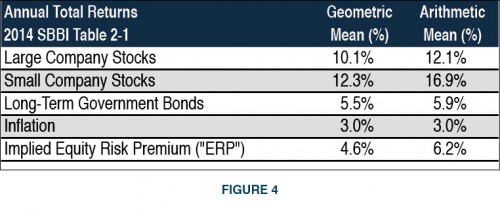
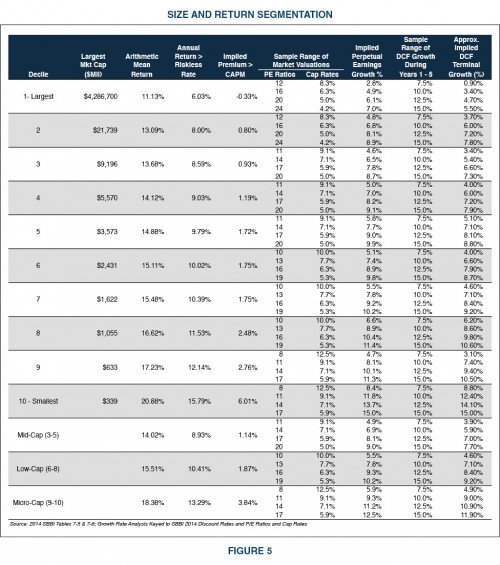
Appraisers employ various tools and data resources to determine the appropriate cost of capital for use in a valuation. Employing a bit of analytical deduction using the disciplines of the Capital Asset Pricing Model and the Gordon Growth Model, one can observe some tendencies regarding the markets’ implied earnings growth expectations. One of the most frequently employed resources is the annual Morningstar/Ibbotson SBBI publication. Given this data, and an assumed range of price-to-earnings ratios, one can deduce the implied perpetual earnings growth rates embedded in the market’s pricing over time. This framework can be applied to a specific company, a group of companies, or an industry. The example in Figures 4 and 5 demonstrates market-based influences regarding analyst predispositions about earnings growth over time. As with other tools and sensitivity analyses in this publication, changes to the inputs can result in significantly different outputs.
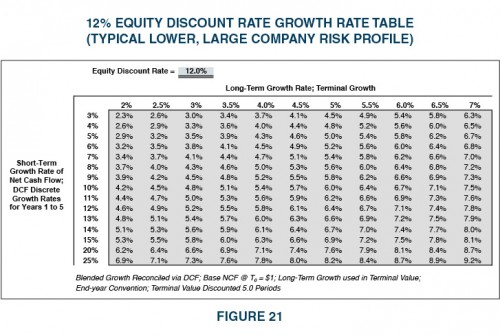
Relative to the growth dynamics of the different sized public companies depicted in the preceding table, it’s no wonder that the closely held, mostly mature, mid-market companies typically seen in the ESOP world (with enterprise values ranging from $10-$500 million) are imbued with net cash flow growth rates on the order 3% to 5% in the appraisal process (the “comfort zone” ). However, the timing of growth during the projection can be significant to a DCF value indication and can also influence growth rates in single-period capitalizations to measures outside of the comfort zone.
Framework for Studying Projections and Growth Rate Assumptions
By convention, virtually all business valuations include a presentation composed of five years of historical financial performance. Depending on the nature of the underlying financial reporting of the sponsor company, the presentation will include balance sheets, income statements and cash flow statements. The notes to the reported financials may also contain a myriad of underlying detail and disclosures supporting the chart of accounts displayed on the core financial exhibits. Commonly, these financial exhibits are augmented with derivative analysis to study the common size (percentage of assets) balance sheets, common size income statements (historical margins expressed as a percentage of revenue), financial ratios, peer/ industry data sets, and year-to-year and compound annual growth rate measurements.
The foundation for studying the reasonableness (or believability) of a forecast derives from a firm grasp of the relevant history of the subject enterprise. The reported financial statements are often recast to reflect the proper historical base from which most projections are cast. Ultimately, the valuation methodology captures the adjusted, pro forma financial performance and position of the company that serve as the appropriate base from which forecast results are projected to emerge.
Financial history is not the only context for vetting projections. To the extent possible, the financial exhibits should be annotated and/or augmented with operational data (and graphics) that allow the appraiser to demonstrate and consider how the company’s activities relate to its financial performance. In addition to common size financial data, revenue and profit segmentation can be critical to understanding what aspects of a business are performing well and what parts are hindering results. In addition to perspectives on revenue mix, the report should also reflect a functional unit volume analysis that promotes an understanding of how pricing and activity volumes drive revenue and profitability. In turn, these observations help inform the appraiser about the physical capacities, break even levels, labor resources, and other aspects of the business model and operational flows that should dove-tail with the projections.
For example, if a projection implies that a business will exhaust its current operating capacities or markets, then an adequate and properly timed charge to cash flow for capital expenditures should be included in the forecast to promote continued growth. Otherwise, little or no growth (beyond the price component of revenue) should be reflected in the model. Additionally, the duration of the discrete forecast should span the number of periods required for the company’s operating and financial performance to reach a reasonable normative state from which a steady level of continuing performance can be expected. Thus, a five-year projection may require augmentation of a few periods to regress a high-growth model to a mature state, or a negative growth model to a new state of sustainable performance. Ultimately, the timing of when growth occurs can be an important value determinant in a DCF model as well as a vital consideration to developing a perpetual growth rate for cash flow.
When assessing a perpetual growth rate assumption, which is required in a single-period capitalization of earnings or net cash flow, one key to estimating a reasonably correct growth rate is an understanding of the internal and external factors that drive the assumption. While some appraisers are of the mind that projections cannot or should not be developed by an appraiser; surprisingly there is no debate as to the requirement of postulating a perpetual growth rate. These seemingly different disciplines are in fact one in the same. Arguably, an appraiser seeking to quantify or justify a perpetual growth rate must employ elements of the DCF mentality to define what that growth rate should be. Of course, the base amount of the cash flow is a vital starting point. For those appraisers who gravitate to the 3%-5% perpetual growth rate range, the use of a multi-period cycle-weighted historical average of cash flow can create a significant error in the valuation.
Let’s construct a simple example to demonstrate the valuation issues that could result from two different historical conditions that have the same average of performance. As crazy as it may be in practice, it is not uncommon for appraisers using multi-period averages to effectively ignore prevailing conditions and use a nominal long-term average growth rate that is correlated to GDP or some other prominent macroeconomic or industry performance measure. This mentality renders real time trends and real time expected directionality in performance as irrelevant. The following example is engineered to demonstrate how far astray the mentality for averaging and the failure to model growth can lead the valuation.
Example Conditions
- The average after-tax net cash flow is $10,000,000
- Depreciation and capital expenditures are substantially offsetting
- Incremental working capital needs are minimal
- The cost of equity is 15%
- The “assumed” perpetual annual growth rate in net cash flow is 5%
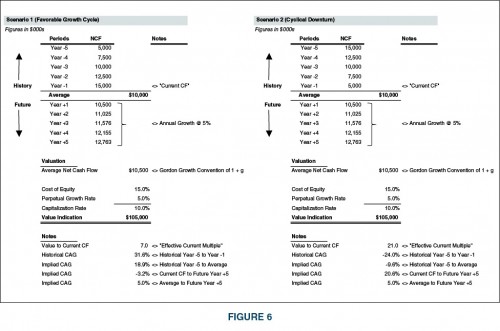
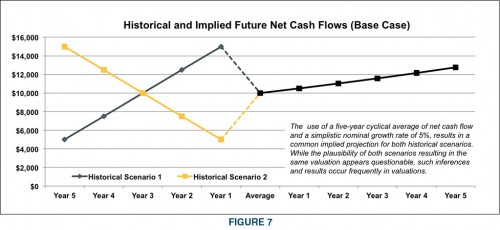
As can be seen in Figure 6, relative to the common valuation of $105,000, Scenario 1 represents undervaluation by approximately 30% (10 x $15,000 = $150,000) relative to recent annual performance, while Scenario 2 reflects an overvaluation by over 100% (10 x $5,000 = $50,000). More disturbing than two quite different trends giving rise to a common valuation of $105,000 is the spread of the value range from $50,000 to $150,000 derived from the “Current CF” measures of each scenario. Which valuation is more reasonable? Are there alternatives to modeling growth that represent more plausible projections or growth rates?
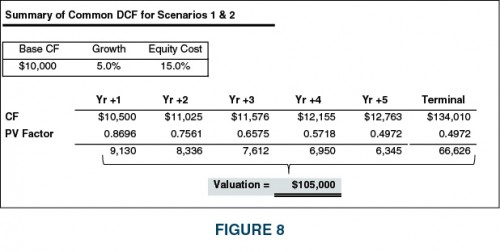
As can be seen in Figure 8, a valuation of $105,000 is derived from the two distinctly different historical scenarios. How might alternative projections be modeled that provide an enhanced perspective from which to study a reasonable perpetual growth rate for each scenario? Frankly, most seasoned valuation professionals would admonish the appraiser in each of the example scenarios for failing to study a projection that “engineers” the prevailing cash flows from their current respective conditions to an assumed cycle-neutral point five years hence. Simultaneously, how could a discrete projection be modeled that develops the value associated with a series of future cash flows that reconciles to a reasonable steady-state measure of cash flows and forward growth?
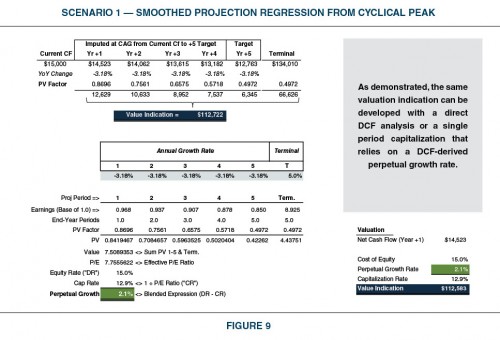
Taking Scenario 1 first, the five-year average cash flow ($10,000) results in a measure of cash flow well below the current performance ($15,000). What might a superior path of analysis be to capture the concern that current performance is unsustainable in the near-term? Substituting the implied growth rate of cash flow resulting from the assumed perpetual growth rate of 5% and a base average of $10,000, one might postulate a more believable pattern of performance and valuation as in Figure 9.
Note that the year five CF is determined as the same amount ($12,763) ultimately reached in both implied forward cash flow scenarios using the 5% perpetual growth from the base average cash flow of $10,000. An alternative modification to the original implied projection would be to regress the current cash flow performance ($15,000) to the forward year five adjusted base ($10,000 x 1.055 = $12,763). The valuation resulting from the modified projection is 7.4% higher due to a less abrupt decline than the default first year drop from $15,000 to $10,500. While this is not a radical percentage difference in the valuation, the alternative smoothed projection is a more intuitively appealing and believable model. Such a construct allows for analysis to support the development of a growth rate applicable to the cyclical high Current CF of $15,000. Using the following proof we can devise a perpetual growth rate that will reconcile the Current CF to a similar adjusted valuation of approximately $113,000.
Based on Figure 9, a growth rate of approximately 2% could have been reasonably applied to the Current CF ($15,000), lending enhanced credibility to a single-period capitalization than using 5% against the multi-year average performance of $10,000. The original, default approach used by many appraisers represents a 50% immediate first year disconnect from prevailing performance that lacks a reasonable basis. This is not to say that some circumstances don’t call for an abrupt shift in assumed cash flow versus prevailing cash flow, but that is typically a fundamental issue such as the loss or gain of a significant product, territory or customer. Too often this type of flaw is the result of the default five-finger rule to averaging five years of cash flows and using a 5% growth rate.
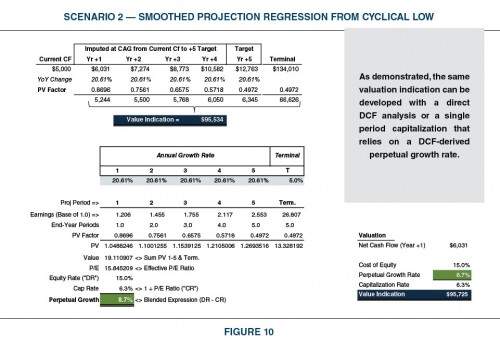
Repeating the previous exercise for Scenario 2 results in Figure 10.
Based on the example in Figure 10, a growth rate of approximately 8.7% could have been reasonably applied to the Current CF ($5,000), lending enhanced credibility to a single-period capitalization than using 5% against the multi-year average performance of $10,000. Again, this is not to say that some circumstances don’t call for an abrupt shift in assumed cash flow versus prevailing cash flow, but such a scenario is typically a fundamental issue such as the loss or gain of a significant product, territory or customer.
Now that both of the implied projections have been modified to reflect more gradual regression to a mean level of assumed stable performance and sustainable future growth, the valuations reveal differentials from approximately 7.2% higher to 8.9% lower relative to the $105,000 derived from the default valuation mentality often employed. More significantly, the respective valuations are better suited to the prevailing cash flows and the expected directionality of performance. Each model now reflects a more thoughtful consideration of the time value of money.
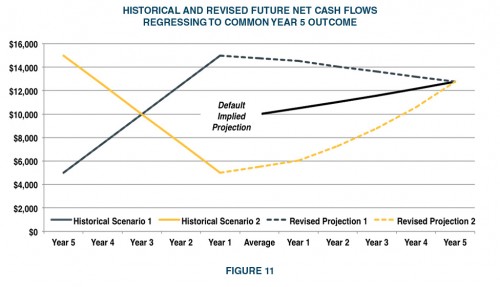
Figure 11 shows how the respective projections for each scenario converge on an estimated cyclically neutral level of future performance. The respective valuations, either in the form of a DCF or in the form of a single-period capitalization, are refined to capture the time value of money corresponding to a more believable performance regression/progression forecast. It should seem logical that the refined projection showing a gradual decline (Scenario 1) that starts with an above historical average level of performance, results in a higher value than the original $105,000. Likewise, the increasing projection (Scenario 2) that starts with below historical average performance results in a lower valuation than the original treatment.
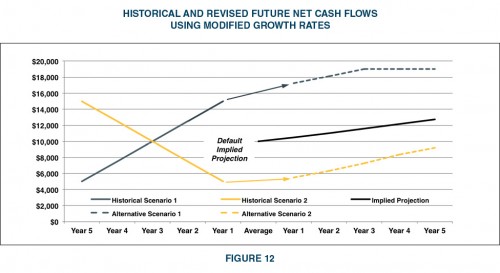
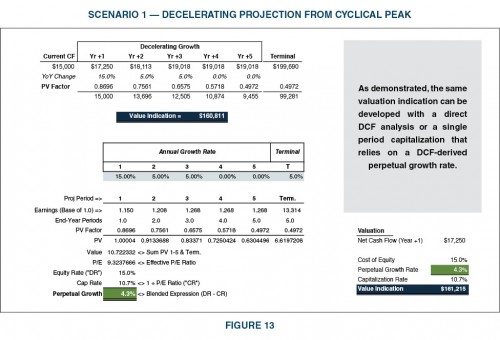
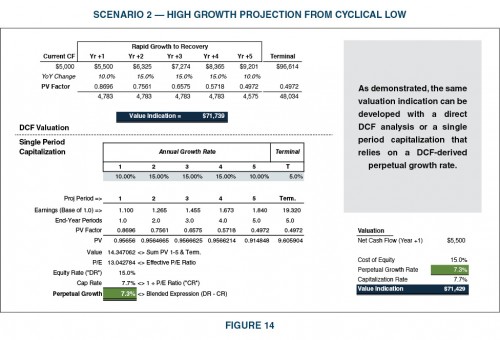
The chart in Figure 11 implies that performance has a gravitational attraction to the five-year outcome as a notional level of future performance ($12,763). An alternative and perhaps more realistic projection would craft a regression of the growth rate rather than a regression of performance to a notional future amount. Decelerating growth from either its peak performance (Scenario 1) or applying rapid growth during a mode of recovery (Scenario 2) seems more logical in most real world situations than the default trend. These competing projections are depicted in Figure 12. The valuations resulting from the smoothed growth patterns are developed in Figures 13 and 14 respectively. Of course, the pattern of future deceleration or acceleration requires specific study and support. The assumed patterns are presented for example purposes. A study of these alternative modeling inputs suggests that the original valuation of $105,000 is potentially flawed.
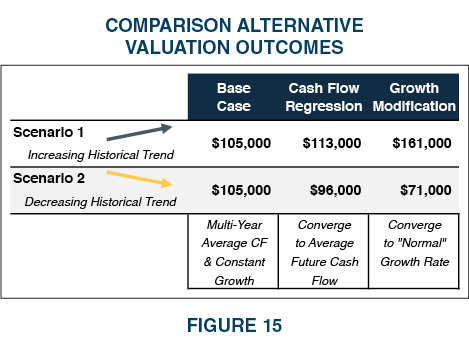
Let’s summarize the various valuation outcomes from the two different scenarios. Remember, common averaging techniques coupled with seemingly benign growth assumptions result initially in the same valuation under both scenarios. However, scrutiny of the growth and/or projection modeling reveals some dramatic differences. Admittedly, in most valuations there would be underlying facts and circumstances supporting one of three modeling conditions applied to each scenario. One can easily see how valuations can be viewed quiet differently by differing parties under differing circumstances. The primary valuation differential for each stems from the implied projection and growth modeling.
The common appraiser mentality of using historical average performance (rule of thumb mindset) combined with the typical “normal/benign” assumptions concerning growth and the cost of capital, can serve to understate or overstate value. Growth analysis and reasonable forecasting (birds of the same feather) allow for a more believable and optically pleasing analyses and conclusions. Comparing alternative projections from otherwise implied projections can provide better insight into growth modeling and promote more rational forecasting.
Appendix A | Case Analysis: Understanding Growth Rates
One of the most debated and poorly supported assumptions in business valuation is that of the growth rate in performance, be it earnings, net cash flow, or debt-free cash flow. The default reliance on macroeconomic or industry based data is a good beginning but often falls short of the full growth profile for a specific business in a specific industry in a specific geography at a specific point in time. The real world is often lumpy and most companies experience shifts in top-line activity, cost efficiencies, and operating leverage throughout the business cycle or in conjunction with changes in the business model. Skill and experience are powerful influencers for what feels “right,” but too often the five finger-growth mentality rules the day. What tools can an appraiser use to develop and defend growth rate assumptions and how can such a tool be used as a critical review tool?
Let’s study an example featuring a combination of typical facts and circumstances.
Example Conditions:
- The economy is stable, with nominal GDP on the order of 4% and real GDP on the order of 2%
- The subject Company is stable, and operating with consistent results
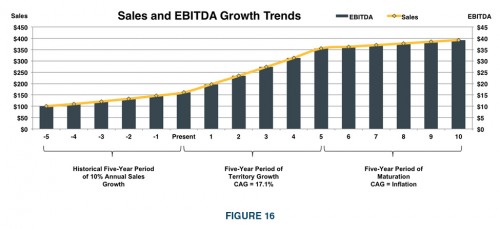
- The Company is twenty years old and has experienced 10% growth in annual sales over the last five years
- The subject Company has moderate pricing power and operates in an industry with commodity players as well as value-added players (implying a range of profit margins and revenue sizes)
- Historical pricing for the Company’s goods and services follows a more or less inflationary pattern (say 2.0%), and the markets resist price increases such that Company profits can be squeezed without constant attention to expenses
- The goal for the Company is to expand its market from the current 25 states to all 50 states in the next five years (all states represent equal market opportunity)
- With margins constant, sales growth represents a reasonable proxy for growth in earnings and net cash flow (EBITDA margin +/-10%)
- Public companies, larger and already national in market exposure, are expecting 5% annual sales volume growth over the next five years (consistent with industry expectations) and 10% annual earnings growth (implying margin expansion)
- Capital structure is expected to remain unchanged for the foreseeable future (debt free) » The Company has no excessive or abnormal risk exposures or concentrations
- The Company’s goods and services do not represent new or disruptive/paradigm technology
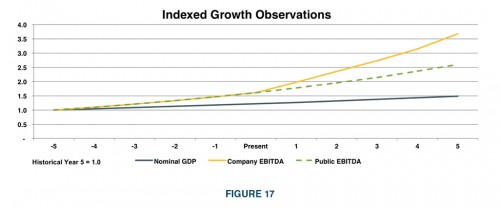
It is not uncommon for an appraiser to uncover the above information in the course of due diligence. Yet, the same management team that can relate such feedback to the appraiser will not “speculate” on a projection. A competent appraiser should be able to cobble together the framework of a projection for purposes of quantifying a growth rate for a single-period capitalization as well as performing a summary DCF analysis (perhaps as a test of reason or as additional direct valuation evidence). Figure 16 depicts how the facts and circumstances are expected to play out in sales and EBITDA.
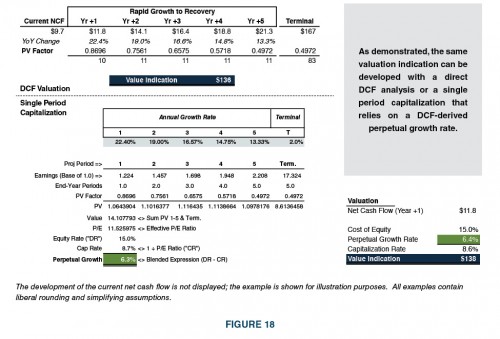
Most often the typical approach would be to grab a recent average level of performance and use a growth rate likened to nominal GDP (4%), perhaps influenced up a bit to reflect the recent growth performance. However, the 6.3% perpetual growth rate developed does not tie directly to the underlying data and general information. For an appraiser to get the single-period perpetual growth rate correct, he/she would simply have to get that “just right” feeling. Clearly, a bit of extra effort and the constructive extension of logic would allow for an anecdotal or direct DCF-type study that could offer support for the generally favorable growth rate required in the analysis.
Figures 16-18 serve notice that macroeconomic growth rates, sprinkled with a little current and near term company performance are often misleading and can fail to capture the influence of timing on the value of future cash flows.
Reconciling Multi-Stage Growth Rates to a Single, Perpetual Growth Rate
Report reviewers are frequently confined to terse, misguided, or unjustified positions concerning growth rates. Typically, report users are bludgeoned with anecdotal growth evidence or with historical observations that fail to translate directly into reasonable future expectations. The time value of money is frequently obscured by a failure to reconcile multi-stage growth expectations into a meaningful single-period growth rate.
Figure 19 displays a matrix of single, perpetual growth rates derived from the blended short term and long term growth rate expectations based on a 15% equity discount rate. Given a beginning measure of net cash flow or earnings, the table provides the single-period growth rate necessary to derive the same value result as a DCF using a five years of annual growth from the vertical axis (displayed left) and a terminal value developed using the growth rate from the horizontal axis (displayed top). For example, a company expecting to achieve 10% annual growth for years one through five and a terminal value growth rate of 5% would require a perpetual growth rate of 6.4% to equate a Gordon-style capitalization to a DCF valuation. The 6.4% perpetual rate may lack direct or specific support anywhere in the industry or economic data, but it may functionally capture the short-term and long-term expectations that are reasonable.
Some appraisers may find this simple concept too burdensome to develop and communicate and thus a trustee often ends up with the five-finger approach to growth analysis.
Figure 19 provides a quick and powerful tool for assessing growth rates in valuation reports (at the specific 15% equity discount rate). Even if future growth lacks “visibility,” the fact is that years one through five are more predictable than beyond five or more years. That being a matter of common sense, a given company’s prevailing and near term trends might reasonably serve as the annual growth rate for years one through five while an industry/GDP/inflationary assumption might reasonably serve as the perpetual growth rate after the initial five-year implied projection (e.g. the terminal value growth rate).
Figures 19-21 are based on alternative equity discount rates. The use of the subject’s company’s equity discount rate is vital to developing a proper growth rate perspective. We note that growth rates applicable to alternative cash flows, such a cash flow to total invested capital, can also be studied using a similar approach as described in these examples. Replicating the math of these growth tables is relatively easy for any experienced analyst or reviewer.
Appendix B | Case Analysis: Testing Projection Outcomes Using DCF Analysis
For purposes of the following case study analysis, let’s refer to the various projection scenarios depicted in Figure 22. Additionally, let’s frame the effect on the valuation from the projection scenarios using a valuation of the unadjusted management projections.
Figure 22 highlights the various projection scenarios one might reasonably develop as alternatives to the base management projection. Figure 23 depicts both a DCF and single-period capitalization developed from a base projection.
As can be observed in Figure 24, the valuation using a modified growth rate reduced the total equity valuation by 20%. If the appraiser and/or the trustee concur that this lower growth scenario is a more plausible outcome than management’s original projection, particularly in light of the trustee’s core concern for a long-term sustainable and serviceable ESOP benefit, then all things held constant in the base projection model, the use of an equity risk premium on the order of 2.0% applied to the equity discount rate of the original model (making it 17% versus the original 15%) would converge the value of the original projection with that of the alternative 5% growth scenario. Using this technique, the appraiser/trustee has not directly modified the projection, but the valuation is hedged for the horizon risk believed to be associated with management’s base numbers.
This is a simplified but powerful example of how the appraisal process can serve to effectively adjust the valuation outcome for the uncertainty of achieving a projection. Numerous other DCF treatments including discounting timing conventions, terminal growth rates, terminal value methods, capital structure for determining the WACC, working capital assumptions, and other tweaks can individually or collectively result in significantly different valuation outcomes using the same projection. These adjustments and modeling exercises can aid appraisers and trustees in determining reasonable and credible valuation outcomes. It goes without saying that these adjustments cannot simply be arbitrary. Rather, they must be reasonable and supportable in the context of the company’s capabilities and the marketplace for ESOP ownership interests in the company. With regard to valuations over time, changes in assumptions and modeling techniques should not be buried or obscured and should be clearly reconciled for the benefit of both the appraiser and the trustee.
As can be observed in Figure 25, the valuation using the 0% growth scenario reduced the total equity valuation by 37% from the original growth projection. If the appraiser and/or the trustee concur that this alternative growth scenario is a more plausible outcome than management’s original projection, particularly in light of the trustee’s core concern for a long-term sustainable and serviceable ESOP benefit, then all things held constant in the base projection model, the use of an equity risk premium on the order of 4.0% applied to the equity rate (making it 19% versus the original 15%) would converge the value of the original projection with that of the alternative 0% (no) growth scenario. Using this technique, the appraiser/trustee has not directly modified the projection, but the valuation is hedged for the horizon risk believed to be associated with management’s base numbers.
As can be observed in Figure 26, the valuation using a declining growth scenario reduced the total equity valuation by 48%. If the appraiser and/or the trustee concur that this alternative growth scenario is a more plausible outcome than management’s original projection, particularly in light of the trustee’s core concern for a long-term sustainable and serviceable ESOP benefit, then all things held constant in the base projection model, the use of an equity risk premium on the order of 6.0% applied to the equity rate (making it 21% versus the original 15%) would converge the value of the original projection with that of the alternative -5% annual growth scenario. Using this technique, the appraiser/trustee has not directly modified the projection, but the valuation is hedged for the horizon risk believed to be associated with management’s base numbers.
As can be observed in Figure 28, the valuation using a modified growth rate reduced the total equity valuation by 32%. If the appraiser and/or the trustee concur that this alternative growth scenario is a more plausible outcome than management’s original projection, particularly in light of the trustee’s core concern for a long-term sustainable and serviceable ESOP benefit, then all things held constant in the base projection model, the use of an equity risk premium on the order of 3.3% applied to the equity rate (making it 18.3% versus the original 15%) would converge the value of the original projection with that of the alternative cyclical growth scenario. Using this technique, the appraiser/trustee has not directly modified the projection, but the valuation is hedged for the horizon risk believed to be associated with management’s base numbers.
Synthesis of Outcomes Using Alternative Projections/ Equity Discount Rates
Figure 28 depicts the various growth rates scenarios studied for this example. This serves as an example of the type of sensitivity and stress testing the trustee/appraiser can employ to support the due diligence process and the documentation of the projections employed (and/or not employed) as called for under the DOL settlement protocols. As previously stated, alteration of numerous other modeling inputs could be studied in the same fashion as this example using growth rates and reconciling equity (horizon/projection) premiums. The various scenarios can be used to support concerns for downside risk concerning the valuation, the ability to service debt, and the ability to support ESOP repurchase obligation (all procedures and considerations called for under the settlement protocols). These same sensitivity processes can be used to assess the quality and relative value of the subject ESOP company to transaction data and/or guideline public company data employed and/or adjusted in the valuation.
As can be seen in Figure 28, modeling alternative growth scenarios can be a powerful tool in assessing the risk profile and alternative outcomes associated with a given set of projections. While this lengthy working example has examined downside scenarios associated with projection shortfalls, the same framework can be used to assess upside potential in cases where management projections appear conservative in light of past performance and/or external business drivers. It could be argued that the assessment of repurchase obligation should include the potential impact from positive budget variances, as undervaluation today could result in an underestimation of future repurchase liability, which could lead to under-informed and potentially adverse business decisions by the sponsor company.
Appendix C | SETTLEMENT AGREEMENT (DOL V. GREATBANC)
UNITED STATES DISTRICT COURT | CENTRAL DISTRICT OF CALIFORNIA | Case No. ED-CV12-1648-R(DTBx)
THOMAS E. PEREZ Secretary of the United States Department of Labor (Plaintiff) V. GREATBANC TRUST COMPANY, et al. (Defendants)
This SETTLEMENT AGREEMENT (“Settlement Agreement”) is entered into by and between Thomas E. Perez, Secretary of the United States Department of Labor (“Secretary”), acting in his official capacity, by and through his duly authorized representatives, and GreatBanc Trust Company (“GreatBanc”), by and through its duly authorized representative (individually, a “party” and collectively, the “parties”), to settle all civil claims and issues between them.
WHEREAS, the Secretary’s predecessor, Hilda L. Solis, acting in her official capacity, pursuant to her authority under Title I of the Employee Retirement Income Security Act of 1974 (“ERISA”), 29 U.S.C. § 1001, et seq., as amended, filed this action in connection with the June 20, 2006 purchase of Sierra Aluminum Company (“Sierra”) stock by the Employee Stock Ownership Plan sponsored by Sierra (the “Sierra ESOP”), and Thomas E. Perez, current Secretary of the United States Department of Labor, in his official capacity, substituted for Hilda Solis and is now the plaintiff in this action;
WHEREAS, the Secretary and GreatBanc have negotiated this Settlement Agreement through their respective attorneys in a mediation process;
WHEREAS, the Secretary and GreatBanc have engaged in a constructive and collaborative effort to establish binding policies and procedures relating to GreatBanc’s fiduciary engagements and to its process of analyzing transactions involving purchases or sales by ERISA-covered employee stock ownership plans (“ESOPs”) of employer securities that are not publicly traded. Those policies and procedures, to which the parties have agreed, are set forth in Attachment A hereto, which is incorporated herein as an integral part of this Settlement Agreement (hereinafter collectively, “Settlement Agreement”);
WHEREAS, each party acknowledges that its representations are material factors in the other party’s decision to enter into this Settlement Agreement;
WHEREAS, the parties agree to settle on the terms and conditions hereafter set forth as a full and complete resolution of all of the civil claims and issues arising between them in this action without trial or adjudication of any issue of fact or law raised in the Secretary’s Complaint in this action and other claims and issues as set forth in this Settlement Agreement;[.]
[Terms and conditions delineated as items A through U omitted]
Attachment A Of The Settlement Agreement Agreement
Concerning Fiduciary Engagements And Process Requirements For Employer Stock Transactions
The Secretary of the United States Department of Labor (the “Secretary”) and GreatBanc Trust Company (“the Trustee”), by and through their attorneys, have agreed that the policies and procedures described below apply whenever the Trustee serves as a trustee or other fiduciary of any employee stock ownership plan subject to Title I of ERISA (“ESOP”) in connection with transactions in which the ESOP is purchasing or selling, is contemplating purchasing or selling, or receives an offer to purchase or sell, employer securities that are not publicly traded.
A. Selection and Use of Valuation Advisor – General. In all transactions involving the purchase or sale of employer securities that are not publicly traded, the Trustee will hire a qualified valuation advisor, and will do the following:
- prudently investigate the valuation advisor’s qualifications;
- take reasonable steps to determine that the valuation advisor receives complete, accurate and current information necessary to value the employer securities; and
- prudently determine that its reliance on the valuation advisor’s advice is reasonable before entering into any transaction in reliance on the advice.
B. Selection of Valuation Advisor – Conflicts of Interest. The Trustee will not use a valuation advisor for a transaction that has previously performed work – including but not limited to a “preliminary valuation” – for or on behalf of the ESOP sponsor (as distinguished from the ESOP), any counter-party to the ESOP involved in the transaction, or any other entity that is structuring the transaction (such as an investment bank) for any party other than the ESOP or its trustee. The Trustee will not use a valuation advisor for a transaction that has a familial or corporate relationship (such as a parent-subsidiary relationship) to any of the aforementioned persons or entities. The Trustee will obtain written confirmation from the valuation advisor selected that none of the above-referenced relations exist.
C. Selection of Valuation Advisor – Process. In selecting a valuation advisor for a transaction involving the purchase or sale of employer securities, the Trustee will prepare a written analysis addressing the following topics:
- The reason for selecting the particular valuation advisor;
- A list of all the valuation advisors that the Trustee considered;
- A discussion of the qualifications of the valuation advisors that the Trustee considered;
- A list of references checked and discussion of the references’ views on the valuation advisors;
- Whether the valuation advisor was the subject of prior criminal or civil proceedings; and
- A full explanation of the bases for concluding that the Trustee’s selection of the valuation advisor was prudent.
If the Trustee selects a valuation advisor from a roster of valuation advisors that it has previously used, the Trustee need not undertake anew the analysis outlined above if the following conditions are satisfied: (a) the Trustee previously performed the analysis in connection with a prior engagement of the valuation advisor; (b) the previous analysis was completed within the 15 month period immediately preceding the valuation advisor’s selection for a specific transaction; (c) the Trustee documents in writing that it previously performed the analysis, the date(s) on which the Trustee performed the analysis, and the results of the analysis; and (d) the valuation advisor certifies that the information it previously provided pursuant to item (5) above is still accurate.
D. Oversight of Valuation Advisor – Required Analysis. In connection with any purchase or sale of employer securities that are not publicly traded, the Trustee will request that the valuation advisor document the following items in its valuation report,1 and if the valuation advisor does not so document properly, the Trustee will prepare supplemental documentation of the following items to the extent they were not documented by the valuation advisor:
- Identify in writing the individuals responsible for providing any projections reflected in the valuation report, and as to those individuals, conduct reasonable inquiry as to: (a) whether those individuals have or reasonably may be determined to have any conflicts of interest in regard to the ESOP (including but not limited to any interest in the purchase or sale of the employer securities being considered); (b) whether those individuals serve as agents or employees of persons with such conflicts, and the precise nature of any such conflicts: and (c) record in writing how the Trustee and the valuation advisor considered such conflicts in determining the value of employer securities;
- Document in writing an opinion as to the reasonableness of any projections considered in connection with the proposed transaction and explain in writing why and to what extent the projections are or are not reasonable. At a minimum, the analysis shall consider how the projections compare to, and whether they are reasonable in light of, the company’s five-year historical averages and/or medians and the five-year historical averages and/or medians of a group of comparable public companies (if any exist) for the following metrics, unless five-year data are unavailable (in which case, the analyses shall use averages extending as far back as possible). a. Return on assets b. Return on equity c. EBIT margins d. EBITDA margins e. Ratio of capital expenditures to sales f. Revenue growth rate g. Ratio of free cash flows (of the enterprise) to sales
- If it is determined that any of these metrics should be disregarded in assessing the reasonableness of the projections, document in writing both the calculations of the metric (unless calculation is impossible) and the basis for the conclusion that the metric should be disregarded. The use of additional metrics to evaluate the reasonableness of projections other than those listed in section D(2)(a)-(g) above is not precluded as long as the appropriateness of those metrics is documented in writing. If comparable companies are used for any part of a valuation – whether as part of a Guideline Public Company method, to gauge the reasonableness of projections, or for any other purpose – explain in writing the bases for concluding that the comparable companies are actually comparable to the company being valued, including on the basis of size, customer concentration (if such information is publicly available), and volatility of earnings. If a Guideline Public Company analysis is performed, explain in writing any discounts applied to the multiples selected, and if no discount is applied to any given multiple, explain in significant detail the reasons.
- If the company is projected to meet or exceed its historical performance or the historical performance of the group of comparable public companies on any of the metrics described in paragraph D(2) above, document in writing all material assumptions supporting such projections and why those assumptions are reasonable.
- To the extent that the Trustee or its valuation advisor considers any of the projections provided by the ESOP sponsor to be unreasonable, document in writing any adjustments made to the projections.
- If adjustments are applied to the company’s historical or projected financial metrics in a valuation analysis, determine and explain in writing why such adjustments are reasonable.
- If greater weight is assigned to some valuation methods than to others, explain in writing the weighting assigned to each valuation method and the basis for the weightings assigned.
- Consider, as appropriate, how the plan document provisions regarding stock distributions, the duration of the ESOP loan, and the age and tenure of the ESOP participants, may affect the ESOP sponsor’s prospective repurchase obligation, the prudence of the stock purchase, or the fair market value of the stock.
- Analyze and document in writing (a) whether the ESOP sponsor will be able to service the debt taken on in connection with the transaction (including the ability to service the debt in the event that the ESOP sponsor fails to meet the projections relied upon in valuing the stock); (b) whether the transaction is fair to the ESOP from a financial point of view; (c) whether the transaction is fair to the ESOP relative to all the other parties to the proposed transaction; (d) whether the terms of the financing of the proposed transaction are market-based, commercially reasonable, and in the best interests of the ESOP; and (e) the financial impact of the proposed transaction on the ESOP sponsor, and document in writing the factors considered in such analysis and conclusions drawn therefrom.
E. Financial Statements.
- The Trustee will request that the company provide the Trustee and its valuation advisor with audited unqualified financial statements prepared by a CPA for the preceding five fiscal years, unless financial statements extending back five years are unavailable (in which case, the Trustee will request audited unqualified financial statement extending as far back as possible).
- If the ESOP Sponsor provides to the Trustee or its valuation advisor unaudited or qualified financial statements prepared by a CPA for any of the preceding five fiscal years (including interim financial statements that update or supplement the last available audited statements), the Trustee will determine whether it is prudent to rely on the unaudited or qualified financial statements notwithstanding the risk posed by using unaudited or qualified financial statements.
- If the Trustee proceeds with the transaction notwithstanding the lack of audited unqualified financial statements prepared by a CPA (including interim financial statements that update or supplement the last available audited statements), the Trustee will document the bases for the Trustee’s reasonable belief that it is prudent to rely on the financial statements, and explain in writing how it accounted for any risk posed by using qualified or unaudited statements. If the Trustee does not believe that it can reasonably conclude that it would be prudent to rely on the financial statements used in the valuation report, the Trustee will not proceed with the transaction. While the Trustee need not audit the financial statements itself, it must carefully consider the reliability of those statements in the manner set forth herein.
F. Fiduciary Review Process – General. In connection with any transaction involving the purchase or sale of employer securities that are not publicly traded, the Trustee agrees to do the following:
- Take reasonable steps necessary to determine the prudence of relying on the ESOP sponsor’s financial statements provided to the valuation advisor, as set out more fully in paragraph E above;
- Critically assess the reasonableness of any projections (particularly management projections), and if the valuation report does not document in writing the reasonableness of such projections to the Trustee’s satisfaction, the Trustee will prepare supplemental documentation explaining why and to what extent the projections are or are not reasonable;
- Document in writing its bases for concluding that the information supplied to the valuation advisor, whether directly from the ESOP sponsor or otherwise, was current, complete, and accurate.
G. Fiduciary Review Process – Documentation of Valuation Analysis. The Trustee will document in writing its analysis of any final valuation report relating to a transaction involving the purchase or sale of employer securities. The Trustee’s documentation will specifically address each of the following topics and will include the Trustee’s conclusions regarding the final valuation report’s treatment of each topic and explain in writing the bases for its conclusions:
- Marketability discounts;
- Minority interests and control premiums;
- Projections of the company’s future economic performance and the reasonableness or unreasonableness of such projections, including, if applicable, the bases for assuming that the company’s future financial performance will meet or exceed historical performance or the expected performance of the relevant industry generally;
- Analysis of the company’s strengths and weaknesses, which may include, as appropriate, personnel, plant and equipment, capacity, research and development, marketing strategy, business planning, financial condition, and any other factors that reasonably could be expected to affect future performance;
- Specific discount rates chosen, including whether any Weighted Average Cost of Capital used by the valuation advisor was based on the company’s actual capital structure or that of the relevant industry and why the chosen capital structure weighting was reasonable;
- All adjustments to the company’s historical financial statements;
- Consistency of the general economic and industry-specific narrative in the valuation report with the quantitative aspects of the valuation report;
- Reliability and timeliness of the historical financial data considered, including a discussion of whether the financial statements used by the valuation advisor were the subject of unqualified audit opinions, and if not, why it would nevertheless be prudent to rely on them;
- The comparability of the companies chosen as part of any analysis based on comparable companies;
- Material assumptions underlying the valuation report and any testing and analyses of these assumptions;
- Where the valuation report made choices between averages, medians, and outliers (e.g., in determining the multiple(s) used under the “guideline company method” of valuation), the reasons for the choices;
- Treatment of corporate debt;
- Whether the methodologies employed were standard and accepted methodologies and the bases for any departures from standard and accepted methodologies;
- The ESOP sponsor’s ability to service any debt or liabilities to be taken on in connection with the proposed transaction;
- The proposed transaction’s reasonably foreseeable risks as of the date of the transaction;
- Any other material considerations or variables that could have a significant effect on the price of the employer securities.
H. Fiduciary Review Process – Reliance on Valuation Report.
- The Trustee, through its personnel who are responsible for the proposed transaction, will do the following, and document in writing its work with respect to each: a. Read and understand the valuation report; b. Identify and question the valuation report’s underlying assumptions; c. Make reasonable inquiry as to whether the information in the valuation report is materially consistent with information in the Trustee’s possession; d. Analyze whether the valuation report’s conclusions are consistent with the data and analyses; and e. Analyze whether the valuation report is internally consistent in material aspects.
- The Trustee will document in writing the following: (a) the identities of its personnel who were primarily responsible for the proposed transaction, including any person who participated in decisions on whether to proceed with the transaction or the price of the transaction; (b) any material points as to which such personnel disagreed and why; and (c) whether any such personnel concluded or expressed the belief prior to the Trustee’s approval of the transaction that the valuation report’s conclusions were inconsistent with the data and analysis therein or that the valuation report was internally inconsistent in material aspects.
- If the individuals responsible for performing the analysis believe that the valuation report’s conclusions are not consistent with the data and analysis or that the valuation report is internally inconsistent in material respects, the Trustee will not proceed with the transaction.
I. Preservation of Documents. In connection with any transaction completed by the Trustee through its committee or otherwise, the Trustee will create and preserve, for at least six (6) years, notes and records that document in writing the following:
- The full name, business address, telephone number and email address at the time of the Trustee’s consideration of the proposed transaction of each member of the Trustee’s Fiduciary Committee (whether or not he or she voted on the transaction) and any other Trustee personnel who made any material decision(s) on behalf of the Trustee in connection with the proposed transaction, including any of the persons identified pursuant to H(2) above;
- The vote (yes or no) of each member of the Trustee’s Fiduciary Committee who voted on the proposed transaction and a signed certification by each of the voting committee members and any other Trustee personnel who made any material decision(s) on behalf of the Trustee in connection with the proposed transaction that they have read the valuation report, identified its underlying assumptions, and considered the reasonableness of the valuation report’s assumptions and conclusions;
- All notes and records created by the Trustee in connection with its consideration of the proposed transaction, including all documentation required by this Agreement;
- All documents the Trustee and the persons identified in 1 above relied on in making their decisions;
- All electronic or other written communications the Trustee and the persons identified in 1 above had with service providers (including any valuation advisor), the ESOP sponsor, any non-ESOP counterparties, and any advisors retained by the ESOP sponsor or non-ESOP counterparties.
J. Fair Market Value. The Trustee will not cause an ESOP to purchase employer securities for more than their fair market value or sell employer securities for less than their fair market value. The DOL states that the principal amount of the debt financing the transaction, irrespective of the interest rate, cannot exceed the securities’ fair market value. Accordingly, the Trustee will not cause an ESOP to engage in a leveraged stock purchase transaction in which the principal amount of the debt financing the transaction exceeds the fair market value of the stock acquired with that debt, irrespective of the interest rate or other terms of the debt used to finance the transaction.
K. Consideration of Claw-Back. In evaluating proposed stock transactions, the Trustee will consider whether it is appropriate to request a claw-back arrangement or other purchase price adjustment(s) to protect the ESOP against the possibility of adverse consequences in the event of significant corporate events or changed circumstances. The Trustee will document in writing its consideration of the appropriateness of a claw-back or other purchase price adjustment(s).
L. Other Professionals. The Trustee may, consistent with its fiduciary responsibilities under ERISA, employ, or delegate fiduciary authority to, qualified professionals to aid the Trustee in the exercise of its powers, duties, and responsibilities as long as it is prudent to do so.
M. This Agreement is not intended to specify all of the Trustee’s obligations as an ERISA fiduciary with respect to the purchase or sale of employer stock under ERISA, and in no way supersedes any of the Trustee’s obligations under ERISA or its implementing regulations.
The Market Approach | Appraisal Review Practice Aid for ESOP Trustees
This article first appeared as a whitepaper in a series of reports titled Appraisal Review Practice Aid for ESOP Trustees. To view or download the original report as a PDF, click here.
The market approach is a general way of determining the value of a business, business ownership interest, security, or intangible asset by using one or more methods that compare the subject to similar businesses, business ownership interests, securities, or intangible assets that have been sold.
Functionally, market methodologies are similar to direct capitalization income methods in that a benefit (or performance) measure of the subject business is converted to value by a capitalization factor. It is the specificity of the data supporting the capitalization factor that differentiates market methodology from income methodology. In general, income methodologies rely on indirect, broad market rates of return on capital (Ibbotson, et al.) and on various data sets and trends to establish growth rates. For cases in which there is more direct information from a comparable market, such information is used in a market approach to develop a value for the subject entity. These comparable markets offer evidence of either direct- or relative-value metrics based on transaction activity among investors. Such markets can be described as direct—in that a similar ownership interest or security in the same subject entity has transacted—or as indirect—in that a group of publicly traded securities of similar companies can be observed and/or that transactions of entire entities can be observed.
The market approach includes numerous methods, which are generally named according to the nature of the direct or relative-value market data. Naming conventions for certain market methods differ among valuation practitioners but most fall into three categories: (1) the transaction method, (2) the guideline public company method, and (3) the guideline transactions method. As with market data sets used in income methodology, the appropriateness of the data (i.e., its comparability and overall strength of relevance) is the primary concern. Market evidence may require adjustment to address a variety of issues before it can be used to value the subject interest. These adjustments differ based on which of the various market methods is employed as well as on the nature of the transactions observed. The following provides an overview of the primary elements of comparability and adjustments under the three primary categories of market methodology.
Valuation Methods Under The Market Approach
The market approach includes a variety of valuation methods under which pricing metrics are drawn from transactions of interests in companies that are comparable to the subject company. The three primary valuation methods under the market approach are summarized below.
- Transactions Method — derives value using pricing metrics of historical or contemporaneous transactions of interests in the subject company.
- Guideline Public Company Method — derives value using transaction information drawn from publicly traded securities of companies in the same or similar lines of business as the subject company.
- Guideline Transactions Method — derives value using pricing metrics of mergers and acquisitions involving controlling interests of companies (public and private) in the same or similar lines of business as the subject company.
The comparability and reliability of observed transactions is the central concern. The three core market methodologies yield differing types of valuation information for a given ownership interest or entity. Based on the market in which the observed transaction(s) occurred, there can be differing relative valuations. The transaction method may yield valuation information at various levels of value (control or minority). The guideline public company method generally yields valuation information at the marketable minority interest level of value. The guideline transactions method generally yields valuation information based on the controlling interest level of value. Accordingly, the value definition used for an appraisal may suggest which single method or combination of methods might directly apply in the appraisal process. Rarely is a guideline transactions method employed in a valuation calling for the minority interest level of value. Conversely, observed transactions in minority ownership interests of the subject entity may not provide appropriate valuation information for valuations in which the engagement calls for use of the controlling interest level of value.
Although market methods can result in valuations at varying levels of value, each of which may differ from the level of value defined for a given appraisal, there can be useful information in transaction activity even if such activity implies a valuation that is not directly equivalent to the value definition specified in the appraisal engagement. Frequently, there are circumstances in which the appraiser may observe activity that provides indirect support for the valuation or that can be reconciled to the value definition called for in the appraisal report.
As with income methods, the valuations developed using market methodology can result in a value indication for the equity of the subject or for the assets (invested capital) of the subject. In the latter case, the market value of debt is subtracted to derive the equity value of the subject. Appraisers may elect to use market methods that result in direct value indications that differ from the value definition called for in the appraisal engagement. In such cases, valuation discounts and premiums are usually applied to adjust the value indication to the specified level of value defined for the engagement.
Rules of Thumb
A valuation rule of thumb relates an operational or financial measure of a company to a measure of value. Most metrics are operational in nature (based on some unit of business activity or volume) or are financial (representing a multiplier to capitalize revenue, cash flow or some other financial benefit stream). There is rule-of-thumb valuation innuendo in almost every industry. In some cases, such information provides useful insight into the mentality and predisposition of what an owner of a business or business interest believes their holding is worth. This is particularly true of industries whose participants adhere to a relatively narrow range of norms in operating, financial, and/or physical composition.
A rule of thumb value indication is typically a controlling interest level of value. In some cases, rules of thumb reflect a strategic value as opposed to a financial controlling interest value. Appraisers using or referring to rules of thumb must be aware, to the degree possible, of the origin of the rule of thumb in order to assess whether it captures synergies or other premium benefits (or expected profitability) available only to specific strategic investors. Because most rules of thumb have their genesis within a given industry or trade group, strategic elements are often included. Accordingly, ESOP valuations using the fair market value standard may result in conclusions lower than the common industry rules of thumb. However, industry rules of thumb may also coincide with fair market value if the hypothetical investor is closely aligned with likely market participants in the industry or market.
Most rules of thumb relate to the total enterprise value of assets as opposed to the total equity value of a business. Hence, the determination of equity value requires the subtraction of debt from the total enterprise value. As with the private transaction databases, rules of thumb generally require adjustment for certain types of assets and liabilities that are not typically part of transactions. Cash balances, certain liabilities, working capital, real estate, and other balance sheet amounts may be treated separately from core business assets.
Rules of thumb can be highly misleading as most subject companies differ from the stereotypical company in the stereotypical market with a steady-state cycle of performance. Even when such normalcy appears evident, there are marketplace and economic factors that result in valuations that deviate from the central point of a suggested range. Some valuation texts refer to the use of a rule of thumb as a valuation method. Likewise, there are proprietary transaction databases that, when viewed across multiple industries over extended periods of time, are promulgated to represent meaningful information in the valuation of small business enterprises. Appraisers have the task of determining whether or not such data rise to an acceptable level of reliability and/or relevance. In most cases, we see such data as constituting a rule of thumb, and, therefore, subject to healthy scrutiny and devil’s advocacy.
Many small- to middle-market companies (enterprise valuations of $5 to $500 million) have enjoyed increased access to capital funding alternatives and exit strategies in recent years. The rise of private equity buyout firms and the general increase in knowledge among business owners has influenced evolution in rules of thumb. Historically simplistic references to unit revenue measures have evolved and been reconciled to financial measures.
For example, an old-guard rule of thumb in the beverage distribution industry was based on annual volume of cases sold. A distributor of a given type or brand of product might generally assume or expect a certain business value based on annual case-volume activity. However, changes in product mix caused by evolving consumer preferences over time rendered these rules less reliable in explaining the value of a given distributor whose margin was below or in excess of norms. Eventually, the industry vernacular became more focused on gross profit, which better characterizes profit by taking into account the mix and pricing of product offerings. However, operating expense structures of distributors vary to the extent that gross profit is often inadequate in explaining value differentials in transactions. In the current environment, rules of thumb have taken the next step by reconciling to financial measures (such as a multiple of cash flow). Any rule of thumb based on an industry metric (i.e., tons, cases, etc.), can be reconciled to a financial equivalency. Doing so facilitates easier value comparisons and provides a financial basis for reconciling the concluded value in an appraisal to a broad industry rule of thumb.
Consistent with the business valuation standards issued by the professional organizations, we do not suggest using a rule of thumb as a stand-alone valuation method under the market approach. However, when valuing a subject entity or interest using a controlling interest level of value, we do encourage appraisers and reviewers to be aware of any rule of thumb that may characterize value in the subject’s industry. In most cases, an indirect reference to a rule of thumb can provide support for a value conclusion developed under more conventional and financially sound methods. If a conclusion deviates from a rule of thumb, it can be useful for the appraiser to explain why.
Transactions Method
The transactions method is a market approach that develops an indication of value based upon consideration of observed transactions in the ownership interests of the subject entity. Transactions should be scrutinized to determine if they have occurred at arm’s length, with a reasonable degree of frequency, and within a reasonable period of time relative to the valuation date. Inferences about current value can sometimes be drawn, even if there is only a limited market for the ownership interests and relatively few transactions occur.
The timeliness of a transaction is important. However, time itself is not the only parameter that determines whether a transaction is reliable for use in a given appraisal. If internal and/or external business conditions or other factors have changed or evolved in a significant way from the time of the observed transaction to the date of the valuation, then use of the transaction may be unreliable. This could also be true for a transaction occurring in close proximity to the valuation date. While a dated transaction may be unreliable in absolute value terms, the implied relative value of the transaction may be useful to examine (such as price to book or enterprise value to cash flow). Arguably, any transaction that has occurred in reasonable proximity to the valuation date should be disclosed and distilled even if it is not directly considered toward the valuation. In such a case, the appraiser may need to explicitly qualify why a transaction is not being given direct weight in the valuation. In select cases where entity and market performance have remained stable over time, transactions that are somewhat dated may provide meaningful direct or indirect support to the appraisal. Transactions occurring subsequent to the valuation date should not be considered unless the facts and circumstances of such activity were known or reasonably knowable as of the valuation date and there is (was) a high likelihood of the transaction closing.
There are many corporate and shareholder events in the ordinary course of business that may produce meaningful transaction data. Shareholder redemptions, capital raising, transactions among the ownership group, recapitalizations, buy-sell trigger events, equity compensation grants, business acquisitions, dispositions, and other events are not unusual, particularly in larger entities or in entities with large and/or active ownership groups. It is important that any transaction used to develop an indication of value for the entity, or more directly for the subject interest, be considered in the proper context (in terms of value definition) of other valuation methods developed in the appraisal. Frequently, transactions must be adjusted using estimated (and reasonable) discounts or premiums to derive a meaningful base of comparison to the subject interest.
Guideline Public Company Method
The Guideline Public Company Method (GPCM) involves the use of valuation metrics from publicly traded companies that are deemed suitably comparable to the subject entity. Direct comparability is difficult to achieve in many situations, as most public companies are larger and more diverse than the subject, closely held entities in most business appraisals. However, the threshold for direct comparability need not be so inflexible that public companies with similar business characteristics are disqualified from providing guidance in the valuation of the subject company. In some cases, public companies may not be reliable for direct valuation purposes but may yield information helpful in ascertaining norms for capital structure assumptions and growth rate analysis.
There are relatively few industries in which direct comparability is readily achieved, and most of those present challenges by the sheer scalar differences between the public operators and most private enterprises. The selection of, adjustment of, and application of public company valuation data can be a complicated process involving significant appraiser skill and experience. Absent proper execution, the GPCM can render valuation indications that differ significantly from other methods and thus lead to confusing and/or flawed appraisal results.
Guideline companies are most often publicly traded companies in the same or similar industry as the valuation subject and/or that provide a reasonable basis for comparison to the subject company due to similarities in operational processes, supply and demand factors, and/or financial composition.
Investors in the public stock markets often study the P/E ratio of a security for purposes of assessing the merits of the investment. The P/E ratio of a stock is utilized in a common variation of the GPCM whereby a guideline public P/E ratio is used to capitalize the subject company’s net income. Other variations include the use of valuation metrics to capitalize pre-tax income, numerous versions of cash flow, book value, revenues, or other performance measures of the valuation subject.
Investors in the public securities markets are said to be transacting minority investments (non-controlling) in the issuer’s security, and such investors enjoy the benefit of regulated exchanges and mandatory information disclosures by the issuer. Regular filings by publicly traded companies allow investors to assess the valuation of the security in relation to an almost endless array of operational and financial performance measures for the public company. Guideline company valuation metrics produce marketable minority interest valuation indications. The term “as- if- freely- traded” is often used to describe value indications under the GPCM. Guideline companies are used to develop valuation indications under the presumption that a similar market exists for the subject company and the guideline companies.
Ideal guideline companies are in the same business as the company being valued. However, if there is insufficient transaction evidence in the same business, it may be necessary to consider companies with an underlying similarity of relevant investment characteristics such as markets, products, growth, cyclical variability, and other salient factors.
Although a guideline group may provide some indication of how the public markets value the subject company’s shares, there are limitations to the method. For example, it is virtually impossible to find identical guideline companies. In addition, analysts must assume that all relevant information about a company is embedded in its market price. A guideline group can sometimes provide useful valuation benchmarks, but it is ultimately left to the analyst to derive an appropriate capitalization factor for a subject company based upon a thorough comparison of the selected group of guideline companies to the subject company.
Variations of the Guideline Public Company Method
The GPCM can be used to develop value indications for both invested (or enterprise) capital and equity capital. There are numerous sub-methods for performing both types of valuations. The nature of the denominator in a guideline valuation metric or ratio determines the nature of the value indication. Consistent with the rules governing proper income method execution (namely, matching the discount rate to the proper measure of the subject’s earnings or cash flows), the benefit stream of the valuation subject should be capitalized by the appropriate guideline valuation metric. Performance measures and benefits streams have one primary differentiating feature – they are either before debt-service costs or after. The performance or benefit measures that capture cash flows before the payment of debt costs (i.e., interest expense) are used to develop value indications for the invested capital (i.e., total assets) of the guideline companies and, therefore, result in the same valuation for the appraisal subject. The performance measures that capture cash flow after debt service are used to develop value indications for equity capital. As with any approach or method that results in a direct valuation of invested capital, debt is subtracted to arrive at the value of equity. Although it is true that a valuation metric can relate a pre-debt cash flow to equity value (and vice versa an after-debt cash flow to invested capital), we view this as a likely source of valuation error and would discourage such methodology unless there is a convincing reason to do so. We would likely disregard the use of the GPCM if such mixing of benefit streams and capitalization factors were the only calculations developed (e.g., price-to-sales or priceto-EBITDA, etc.).
Appraisers have the task of developing guideline company cash-flow measures and value metrics in a fashion consistent with the cash flows and valuation math used for the valuation subject. Mismatching the guideline valuation metric with the wrong benefit measure of the subject is a common mistake. Appraisers are encouraged not to take valuation multiples for a given public company or group of companies from a published or electronic data source unless the underlying definition and/or development of the metric is adequately detailed. There can be subtle but meaningful variations in how an appraiser tabulates a benefit measure, such as EBITDA, versus how it was tabulated in the cited source material.
Appraisers must also be mindful of understanding the implications of developing guideline company valuation metrics using financial information and pricing data from periods that are reasonably consistent with the benefit measures of the valuation subject. Public market stock pricing conventions follow a rolling four-quarter or 12-month norm. Often, the acronym LTM (last twelve months) or TTM (trailing twelve month) is used to denote that a given cash flow or earnings measure was tabulated using the most recent annualized performance measure of the public company. That is, a given P/E ratio or MVIC/EBITDA ratio is based on the market capitalization as of a defined date and the most up-to-date, 12 month earnings or cash flow measure of the public company.
Although it is not absolute that timing of the data used in developing a guideline valuation metric must be applied to the subject’s benefit measure from the same period, it is recommended that this be the base convention in most business valuations. Due to performance fluctuations and the timing of the business cycle (among other things) from the valuation subject to a given peer guideline company group, some appraisers may use average pricing metrics spanning several years for the guideline companies against a similar average of cash flows or earnings for the valuation subject. This type of execution seemingly parallels common disciplines used in various income methods in which an ongoing, average expression of earnings and cash flow is capitalized by a factor whose underlying discount rate and growth rate were derived from data observed over some historical time frame.
We urge caution when not following consistency of timing regarding pricing measures and/or benefit streams from subject to peer. For example, when a multi-year average of subject earnings is capitalized using the median LTM P/E ratio from a guideline group, the valuation of the subject can be characterized as being adjusted for fundamentals resulting in a valuation that is higher or lower than would be the case had the LTM P/E ratio been applied to the LTM earnings of the subject. This type of fundamental adjustment is but one of many implicit or indirect adjustments that an appraiser can capture under the GPCM. These adjustments need not be construed as flawed as long as there is adequate purpose and explanation for why such a discipline was employed and perhaps even a calculation of the impact on the valuation indication versus a valuation using the typical timing conventions (i.e., guideline LTM to subject LTM).
For valuations in which the GPCM is employed, the guideline data may serve an additional purpose. A properly developed appraisal opinion may have numerous value indications under the cost, income, and market approaches. Value indications from various methods are typically correlated with, or weighted toward an overall valuation conclusion that attempts to reflect the entirety of process and consideration captured in the valuation. Some appraisers have long practiced providing a relative value analysis at the end of their valuation reports that educates the reader on numerous observations of relative value. In such a fashion, the appraiser can present the valuation conclusions from perspectives that extend beyond the direct methodology employed. Accordingly, the appraiser may effectively assert that the conclusions directly developed are consistent with alternative or additional valuation methods that had would support the conclusions reached had such alternative or additional valuation methods been employed.
The relative value analysis is often used to articulate the sanity and appropriateness of the conclusions based on comparing various valuation ratios to broad-market norms, market transactions, or public market pricing for similar (guideline) companies. Relating the valuation conclusion to the reported book value of equity, to the adjusted value of tangible equity, to various measures of cash flow, etc. is an often used technique to support the valuation and to provide a basis for explaining why the conclusion reflects or differs from various peer measurements. In some cases, a guideline company group may have been identified but not used directly. Regardless, when such market evidence is reasonably observable, comparing the data and reconciling it against the valuation conclusions can be a useful and informational exercise.
For example, consider a valuation in which equal weights were applied to the cost approach (e.g., net asset value method) and the income approach (e.g., direct capitalization of earnings), resulting in a correlated equity value of $8,000,000 (marketable minority interest level of value). The subject has $2,000,000 of debt, implying a market value of invested capital (MVIC or TEV) of $10,000,000. Assume the subject entity has a debt-free net cash flow of $1,000,000, EBIT of $1,667,000, and EBITDA of $2,000,000. The resulting MVIC ratios to EBIT and to EBITDA are approximately 6.0x and 5.0x, respectively. If market data were identified but not directly employed, it may be that the valuation conclusion can be compared and reconciled to the market data. All such comparisons must be assessed using the same level of value for both the guideline peer data and the subject company.
The table in Figure 1 presents an example of a multi-method execution of the GPCM. Some of the valuation metrics result in a valuation for equity and some for invested capital. In the example, it is by design that each indication of value is the same. Valuation indications from varying methods within the GPCM will vary, and, in some cases, the variations can be significant. We note that capitalized revenue and capitalized book value will often yield different valuation indications than capitalized earnings or cash flow. In such cases, the appraiser must develop and/or select from those methods and indications believed to be reliable for the appraisal assignment and the definition of value called for therein.
Several caveats and considerations are required to properly execute a GPCM.
- There is a fundamental adjustment of 20% applied to each equity value indication developed under each method. A following section of this publication will provide an overview of how fundamental adjustments for guideline data can be developed.
- There is a line item for the market values of non-operating assets (and liabilities). Appraisers should apply adjustments to the earnings and other performance measures to eliminate the effects of non-operating assets because the values of such assets are typically captured on the back end of the analysis in order to develop the final indications of value. Failure to adjust the performance measures can result in double counting errors.
- There is a line item providing for the potential application of a control premium. Such a premium applies only when the engagement definition calls for the controlling interest level of value. The consideration of a control premium at this stage serves as a proxy for other adjustments not otherwise captured in previous adjustments or reflected in the guideline multiples or applied as a subsequent treatment after a correlation of the GPCM with other methods employed in the appraisal. We caution that blind application of published control premiums is a frequent source of flawed, over-stated valuation. Published control premiums are consequential measures of investor expectations for efficiencies and other value pick-ups from the reported transactions. They reflect expectations of post-deal operating and strategic economies. In the context of appropriately adjusted performance measures and other valuation inputs, most financial control premiums for small private companies are quite modest to nil. This can be particularly true in ESOP situations where the entity is remaining an independent going concern and will not benefit from postmerger efficiencies and synergies embedded in most market-based transactions.
- A memo section in the example displays what each value indication implies on a relative basis by way of comparison of each value method to the subject’s book value, net income, and EBITDA. In this fashion, appraisers and users of valuations can assess how a valuation indication using one valuation metric relates to another.
When multiple indications of value are developed using the GPCM, the appraiser may elect to average the indications into a singular expression of value or may elect to carry individual value indications from the GPCM into a broader exercise to correlate the overall conclusion of value from all methods developed using the three core approaches to value. We believe both of these presentations to be appropriate, but we caution that appraisers and report users should be aware of the total consideration applied to each methods and approach.
Identifying Guideline Companies
The initial stage generally includes the identification of relevant subject company characteristics to serve as a basis for a public company or transaction search. These characteristics include (among other things):
- The subject entity’s portfolio of products and/or services
- The subject entity’s vertical and/or horizontal integration in its respective industry
- The subject entity’s market share in the industry or in subsets of geography or by customer type, and so forth (to whom and where are the subject’s products and services sold?)
- The subject entity’s operational and organizational structure
The characteristics outlined in this list can be used to identify codes under the Standard Industrial Classification (SIC) and North American Industrial Classification Systems (NAICS – used in the United States, Mexico, and Canada). These codes can be used to identify transacting companies and public companies with common economic activities to the valuation subject. Appraisers may need to augment such global screenings with key word searches or perform parallel searches of other SIC or NAICS codes that represent businesses with substantially similar business attributes. Screening of electronic and web-based resources is a virtual standard in valuation practice today. Such resources often include industry data and noteworthy public and private participants. Additional criterion used for selecting and narrowing selections include consideration of the subject’s and the guideline companies’ financial performance and composition, the nature of the assets, the supporting capital structure, trends in absolute and relative performance via size and margin considerations, and consideration of internal and external factors that drive or influence business activity.
Choice of Valuation Metric
The valuation metrics applied in a given appraisal should be commonly accepted and recognized as relevant to the subject’s industry (earnings, EBITDA, book, etc.) and should be reflective of business cycle or other relevant issues affecting the subject, its industry, and its guideline peer group. For example, guideline capitalized net income is a common valuation norm for many financial institutions and service companies, while capitalized EBITDA is a more recognized valuation norm for asset-intensive business such as manufacturers. In many valuation engagements, the value of an entity in relation to its book value can be important.
The reliance of securities markets on various types of valuation information can shift during economic and industry cycles. Businesses that typically have higher valuations during economic expansions may be valued with higher reliance on capitalized cash flow or earnings, while valuations in recessionary periods or down cycles may place greater reliance on asset-based valuation methods. The point is that valuations performed from one time to another or for one purpose to another may require differing degrees of reliance on and consideration of the GPCM as a whole, as well as differing degrees of reliance on and consideration of varied indications of value underlying the GPCM. A rigid average of underlying methods in the GPCM as well on other methods and approaches in an appraisal may constitute little more than a rule-of-thumb or formulaic approach to value and can lead to flawed valuation results.
The Fundamental Adjustment
Under both the guideline public company method and the guideline transactions method, it is necessary to adjust the market evidence observed in transactions of comparable companies for fundamental differences between the subject company and the guideline companies.
Adjusting Guideline Valuation Metrics for Use in Business Valuation
What is a fundamental adjustment? The term “fundamental adjustment” is not a universal term, but it is a universal treatment applied explicitly or implicitly in virtually every GPCM and guideline transaction method (GTM). Where market-value evidence is observed, screened, and modified for use in the GPCM or GTM, one can be virtually assured that some adjustment has been applied to the data. The adjustment of market-value evidence, whether it is through selection criterion, central tendency observations, or otherwise is what we refer to as a fundamental adjustment. Labels and terms aside, we acknowledge the need for an explanation of how an appraiser adjusts market-value evidence used in the appraisal process. The obfuscation of or failure to consider such adjustment is a common feature of and/or source of error in many appraisals.
Figures 2 and 3 provide perspective concerning the conceptual framework of market-value evidence and its adjustment for use in business valuations. Figure 2 relates to the marketable minority level of value that by default is the typical level of value arising from the GPCM. We note that the financial and strategic control levels of value may differ from guideline to subject using the same concepts discussed here.
The necessity for fundamental adjustments is frequently overlooked. These adjustments are required to reconcile differences between the subject company and the selected group of guideline companies (or transactions as the case may be). Fundamental adjustments are generally applied as discounts to the observed market-value evidence (reflecting a typically smaller and riskier valuation subject versus larger public companies that populate a guideline company group), but they can also represent premiums in relationship to the base market-value evidence.
Core comparative considerations between the valuation subject and the guideline companies include the following:
- Size. Publicly traded guideline companies are often larger and more diversified than the valuation subject. Diversification and scale regarding geographic footprint, customer concentration, supply inputs, and other common risk factors typically favor guideline public companies and acquirers in transactions. All things being equal, this would imply a lower valuation multiple for a relatively smaller subject entity.
- Growth. The growth expectations of guideline companies may be materially different than the growth expectations for the subject company. All things being equal and using the basic representative equation of valuation and the underlying elements of a valuation multiple, higher growth translates to higher valuation multiples and vice versa.
- Access to and Composition of Financing. The ability to obtain financing and negotiate favorable terms can facilitate future growth and provide superior returns on investment. The capital structures and financing power of large public companies can reduce the cost of capital and provide greater operational and strategic flexibility. Such factors translate to higher valuation multiples than may be reasonable for smaller companies lacking such resources.
- Financial/Operating Strength. Guideline companies may be better capitalized and have greater depth in their respective management teams.
The underlying need for fundamental adjustments arises because of differences in the risk profile and growth prospects of the valuation subject in relation to the companies whose trading and transaction data are used in a valuation. By process, the adjustments are developed (through explicit analyses or otherwise) by substituting the risk and growth attributes captured in the guideline data with the risk and growth attributes of the valuation subject. In this fashion, the appraiser attempts to answer the question – how would the market-value evidence differ if the guideline companies and/or the transaction participants had the same risk profile and growth prospects as the valuation subject? This question provides the genesis for understanding a quantitative method for assessing the magnitude of a fundamental adjustment. There are numerous variations of quantitative adjustment and most are predicated on the principle of substitution.
Quantitative Process for Assessing a Fundamental Adjustment
As a preface to the following example, readers are reminded of the build-up and ACAPM methods for developing the required rate of return on equity capital. These CAPM-based disciplines provide the basis for disaggregating the P/E ratios of public companies in a fashion that facilitates the process for substituting the subject risk profile and growth of the subject and determining the effect on the P/E ratio. Such quantification may suggest the magnitude of an appropriate fundamental adjustment. The following assumptions and conditions are used in the example. The figures and assumptions in this example are purely for demonstration purposes.
- Ten public companies were identified as guideline public companies. The median P/E ratio of the group was 10x. The reciprocal of this P/E ratio equals a capitalization rate of 10%.
- The median equity market capitalization of the 10 guideline companies would place the hypothetical guideline company near the bottom of 9th decile of public companies according to the Morningstar/ Ibbotson SBBI Yearbook. The 9th decile companies reflected an implied size premium on the order of 4.0% in excess of returns on the S&P500 index (large cap stocks). The median beta was 1.0, implying equal volatility to the S&P500.
- Financial composition and performance of the subject company were reasonably consistent with the guideline company. The elements of risk were primarily related to differences in firm size.
- Stock analysts following the guideline companies were projecting annual earnings growth of approximately 10% for the next five years. Long-term industry prospects suggested annual earnings growth on the order of 4%. The guideline growth rate expectations equate to a perpetual earning growth rate of approximately 6%. The implied required rate of return for the hypothetical median guideline company is 16%. This measure of return minus the perpetual growth rate of 6% equals the observed capitalization rate of 10%.
- The subject company was mature and displayed recent earnings growth of 10%, near-term growth expectations were expected to decline by 1% each year and level out at a long-term growth rate similar to the overall industry (4%). The subject growth rate expectations equate to a perpetual earning growth rate of approximately 5%.
- At the valuation date, the risk-free rate of return on long-term U.S. Treasury bonds was 5%. The assumed large stock equity premium was assumed to be 7%. The size premium deemed appropriate for the subject company was 6%, and firm-specific risk was assumed to be 1%.
- The table in Figure 4 depicts the changes in the median guideline P/E ratio via the sequential and combined substitution of subject growth and risk into the build-up process. The differences between the resulting adjusted capitalization factors and the median guideline P/E ratio represents the fundamental adjustment.
The risk differential (combined size- and firm-specific) suggests the median guideline P/E ratio be reduced by 23% solely based on the valuation subject’s risk. The growth differential suggests the median guideline P/E ratio be reduced by 9% based solely on the valuation subject’s risk. Considering risk and growth differentials, the median guideline P/E ratio would be reduced by 29%. In operation, this adjustment would be applicable to pricing metrics that result directly in value indications for total equity or could be applied to the resulting equity value derived after subtracting debt from value indications for invested capital. Using the foregoing example, we might see an appraiser use a fundamental adjustment of 15% to 25%. Every situation is unique, and the exact quantified result of this technique is not the absolute adjustment that need apply.
Fundamental Adjustments in Disguise
The following bullet points highlight some of the possible implicit adjustments we see applied to market-value evidence. These points are random in fashion and are designed to spark the necessary analytical curiosity required to scrutinize valuation methods under the market approach.
- Most appraisers, even those who have never employed the term “fundamental adjustment,” have employed the same concept in appraisals. In fact, any appraiser who has selected guideline company multiples other than the median (or perhaps, the average), whether above or below, has implicitly applied the concept of the fundamental adjustment. Based on comparisons between private companies and guideline groups of companies, appraisers often select multiples above or below the measures of central tendency for the public groups.
- Analysts routinely add a small stock premium to the base, CAPM-determined market premium based on historical rate of return data. In addition, analysts routinely estimate a specific company risk premium for private enterprises, which is added to the other components of the ACAPM or build-up discount rate. Implicitly, analysts adjust public market return data (from Ibbotson or other sources) used to develop public company return expectations to account for risks related to size and other factors. In other words, they are making fundamental adjustments in the development of discount rates.
- What are the differences between the subject company and the guideline companies, and how does one incorporate them into the analysis? If all of the guideline companies were identical to one another and the subject company was identical to the guideline companies, then subject value would be equal to the values of the guideline companies. Because this is never the case, the analyst has to identify the important differences and determine what adjustments are required to arrive at a reasonable estimate of value for the subject.
- The actual value measure applied to the subject may be anywhere within (or sometimes even outside) the range of value measures developed from the market data. Where each measure should fall will depend on the quantitative and qualitative analysis of the subject company relative to analysis of the companies that comprise the market transaction data. Valuation pricing multiples are influenced by the same forces that influence capitalization rates, the two most important of which are: (1) risk and (2) expected growth in the operating variable being capitalized.
- Therefore, in order for the analyst to make an intelligent estimate of what multiple is appropriate for the subject company relative to the multiples observed for the guideline companies, the analyst must make some judgments about the relative risk and growth prospects of the subject compared with the guideline companies.
- The analyst should be aware that a search criterion could represent the beginning of a fundamental adjustment in the eyes of potential users of a report. The analyst can unwittingly (or overtly) apply a fundamental adjustment before the mathematical process even begins.
- As with any discount or premium, a fundamental adjustment has limited meaning unless the base against which the adjustment is applied is clearly defined. Define such base in error, through either commission or omission, and the selection and adjustment of public company valuation metrics may be faulty.
- Use of generic methodology in lieu of an emphasis on relevant metrics can be construed as a fundamental adjustment.
- Ultimately, as a result of weighing alternative valuation methods to the ultimate valuation conclusion, the valuation may reflect a significant discount to public company multiples and potentially a higher (or lower as the case may be) fundamental adjustment than explicitly articulated (or implicitly captured) under the guideline method.
Conclusion
As with many tools in the valuation, there are variations of this process. Some appraisers may elect to quantify adjustments for application to differing valuation metrics so as to take into consideration specific differences in profit margins or capital structure. Fundamental adjustments can be small or large and can be positive or negative. Appropriate quantification techniques can be useful tools in augmenting qualitative-based adjustments. Fundamental adjustments can be explicit in nature or implicit and disguised in numerous ways. Ultimately, it is the appraiser’s responsibility to select and reasonably adjust market-value evidence for use in the GPCM or the GTM.
Guideline Transactions Method
The transactions method and the GPCM follow a generally recognized (more or less) set of procedures and practices. The guideline transaction method (GTM) is inherently different in its requirements due to potential idiosyncrasies in the underlying data.
The largely private purveyors of market-value evidence used in the GTM provide varying degrees of data from varying markets. Transaction events are generally classified by industry, facilitating SIC- and NAICS-enabled screening. However, transaction consideration and various valuation ratios may follow differing definitions. Certain adjustments are required to add or subtract values associated with excluded assets or to compensate for the effect of specialized transaction consideration and other deal terms in order for an appraiser to develop an appropriate valuation of the subject.
The required adjustments and considerations vary from one data source to the next. Such adjustment items may include employment contracts, non-compete agreements, contingency payments, seller financing terms, working capital, real estate, specialized expressions of cash flow and other transaction attributes. Care must be taken to ensure that the methodology results in value indications that are consistent with the value definition required in the appraisal description. Appraisers and report users are cautioned that data sources should be reviewed to understand what kind of valuation is captured in the transaction data (typically it is the market value of invested capital) and how that data needs to be adjusted to derive the intended subject valuation (equity value in most valuation engagements). Confusion in the proper use of transaction data bases has fueled a veritable professional niche of publications intended to instruct appraisers on the proper use of market-value evidence from the various databases. This suggests that transaction observations be supported by sufficient (perhaps significant) underlying financial detail.
In operation, the GTM is similar to direct capitalization income methods and to the GPCM in that a specified subject performance measure is capitalized by a capitalization factor that is derived from observable market-value evidence (transactions). As with other guideline data processes, capitalization factors are typically drawn from numerous transactions implying some average valuation metric or ratio. Adjustments to reconcile fundamental differences between subject and guideline follow similar considerations as discussed in the GPCM. Differing valuation metrics may be used to describe transaction values based on the nature and industry of buyers and sellers in the cited transactions. As with income methods and other market methods, consistency between performance measures and capitalization multiples is required.
Valuations using transaction data result in a controlling interest valuation indication. As such, the GTM may not be employed (or useful) in a valuation intended to develop a minority interest level of value. Alternatively, a controlling interest value can be adjusted by valuation discounts to derive alternative levels of value. Market transactions are used to develop valuation indications under the presumption that a similar market exists for the subject company.
As with the guideline public company method, ideal guideline transactions involve companies which that are in the same business as the company being valued. However, if there is insufficient transaction evidence in the same business, it may be necessary to consider companies with an underlying similarity of relevant investment characteristics such as markets, products, growth, cyclical variability, and other salient factors.
One or a combination of data sources are typically employed in the GTM. Additionally, there are countless other potential sources of information that are reported by specialized industry trade groups, investments banking concerns, industry consultants, and other market participants. Information may also be gleaned from the corporate development activities of publicly traded buyers and sellers because such data may be reported in SEC filings. There is a wealth of potential information from diverse providers of financial and market market-based information including (among others) SNL Securities, Thomson Reuters, and Bloomberg.
Virtually every caveat and caution discussed for the GPCM and the transaction method extend to the GTM (and then some). Appraisers are challenged with adequate documentation of transactions, proper application of the data, and proper adjustment of the results. Many appraisers include citation of transaction data in their reports but may elect to use such data as a supporting element to an appraisal conclusion derived from alternative methodologies. Direct use of transaction data is often reserved for situations in which adequate transaction volume can be observed, the transactions occurred within a reasonable timeframe of the valuation data, and the transaction participants’ data and deals can be reasonably adjusted and reconciled to the valuation subject.
Correlation of Value | Appraisal Review Practice Aid for ESOP Trustees
This article first appeared as a whitepaper in a series of reports titled Appraisal Review Practice Aid for ESOP Trustees. To view or download the original report as a PDF, click here.
The correlated indication of value is a value that is arrived at through some reasonable, well-articulated, replicable, and credible process of selection, averaging or otherwise, of the total valuation evidence generated from the valuation methodologies employed. Correlating a valuation conclusion that subsumes all the information, processes, analyses, and market evidence in a valuation engagement is no simple task. The term used by some appraisers for the resulting valuation distillation is “correlated indication of value.” For valuations in which the value methodology directly results in the value definition specified in the engagement, the correlated indication of value may represent the final conclusion of value. For cases in which the value definition differs from the direct results of valuation methodology, the correlated indication of value is typically adjusted by valuation discounts or premiums (typically the former) to develop the value definition specified in the engagement. Figure 1 depicts the typical correlation framework. There are numerous variations and potential interjecting steps and adjustments.
In operation, developing a correlated indication of value may appear reasonably straightforward (sometimes it is), but the considerations in the process can reach back to the smallest of details and considerations in the underlying valuation methodologies. A brief review of the global valuation approaches provides a good review for the subsequent observations. Figure 2 presents the three valuation approaches.
Global Considerations in the Correlation Process
The following provide some global considerations used by many appraisers to navigate the correlation process (which is not to say all are best practices).These points are not listed in any order of significance because the priority of consideration changes with every appraisal.
Nature and Industry of the Subject Business
- Manufacturing, distribution, retail, service, professional, contracting, etc. Differing business models have differing value drivers and differing financial infrastructures.Some methods will be the primary or sole path to value for some types of businesses.
- The relative asset-intensity of a business may influence the selection of valuation methods. Manufacturing concerns make capital investments differently than do professional service firms; the methods weighed should reflect this basic reality.
- All businesses have resources at risk in the marketplace and should by logical extension rely on earnings (cash flow) as the core driver of value. In other words, the capitalized cash flow of the subject company should at least validate the value of underlying net asset value. In a very real sense, the value of capitalized cash flow defines the value of underlying net assets, based on risk, return, and growth parameters. Yet many businesses, at different points in their life cycles, are more appropriately valued based on (or with partial reliance on) underlying net assets. It is the job of the appraiser to determine the driver(s) of value in general and on a given valuation date and to utilize that perspective in fashioning a conclusion.
- Although all firms employ assets to generate profits, some are better at it than others. The store of value in hard assets can serve to sustain value (or soften downturns) for many types of businesses, particularly in times when profits are low or non-existent. For businesses lacking significant hard assets (and other balance sheet resources), a lack of earnings or cash flow, when coupled with poor business prospects, likely means a lack of value.
- Businesses that hold assets are typically valued using the appraised values of the underlying assets and/or on asset values that can be readily evidenced from an active, observable market. In such cases, a singular method such as the net asset value method may be employed. Additional analysis based on income and market methods may be used to support valuation discounts that are applied to the direct asset-based value indication.
- Most closely held businesses are too small or narrow in focus to be valued using the market approach. Accordingly, many (most) appraisals do not employ the guideline public company method. In similar fashion, other market methods may not apply either.
Stage of Business Maturity and Development
- Mature businesses with established performance may be valued using methods that are not appropriate for early stage businesses or businesses in decline.
- Start-ups or liquidating business should be valued using methods that capture the eventual or ultimate expected economic norms or outcomes for the business.In such cases, there is little correlation required because only one method may be used.
Position in Industry or Economic Cycle
- Businesses that display periodic down cycles may be valued with more weight placed on balance sheet indications of value, particularly when projected performance is uncertain or lacking all together.However, income methods showing little to no value may be weighted as a proxy for lack of control issues (also known as minority interest discount), to capture appraiser concerns regarding the economic obsolescence of assets, or to capture anticipated financial losses for the period of time until a return to profitability or stabilized performance is can be expected to be achieved.The weighting of low-to-no value income methods serves to effectively discount the asset-based method in many valuations.
- Businesses performing at historic average levels and/or with continuing expectations for stability will likely be valued using income methods or with market methods that focus on earnings and cash flow.
- Businesses in high or low cycles may be valued using discrete projection methods that adjust the business up or down over time toward a steady state of performance that is more in keeping with proven history or is better aligned with industry performance and/or expectations.
Nature of Underlying Adjustments in the Valuation Methods
- All valuation methods require underlying adjustments. Asset-based methods follow a mark-to-market discipline. Income methods may be adjusted for unusual expenses. Projections may be more or less believable in the context of history and external market expectations. Market methods may rely on market evidence that is not directly comparable or is unreliable due to an economic or industry shock.
- The point is that many valuations include methodologies and results that are more or less speculative than other methods. This can be acute when a business is at a peak or trough in its cycle.
- Under the ubiquitous standard of fair market value, appraisers must take into account the balance of considerations from both the hypothetical buyer’s and hypothetical seller’s perspectives.
Standard and Level of Value (The Value Definition)
- An appraisal performed using the controlling interest level of value may rely more heavily on the higher value indications than on the lower value indications. This kind of consideration may serve as a proxy for the highest and best use or operation of the underlying business assets.It can also lead to error and/or alleged bias.
- Conversely, a minority interest value definition may influence the consideration of lower value indications or indications from methods that are believed more reflective of the expectations of investors who lack the prerogatives to bring about the changes or choices that might otherwise increase the indicated value.This too, can lead to error and/or alleged bias.
- Some appraisals are performed for specific purposes using a standard of value other than fair market value. In such cases, certain methodologies may be dictated and others prohibited. Fair value under FASB reporting requirements may require considerations and perspectives very different than under fair market value. Fair value (yes, a different “fair value”) under operation of law (either by statute or judicial guidance) can vary from state to state and from issue to issue.Dissenter’s rights, marital dissolution, securities fraud, and other matters in which an appraisal is developed for expert consulting or expert witness purposes may require unique valuation considerations and often include specific instruction from legal counsel concerning what “counts” in the calculations and how.In matters requiring a very specific set of defining elements, the value definition must be top of mind when developing or reviewing the work product, which is often a scope of report other than the typical appraisal opinion.
The Quality and Availability of Subject Financial Data
- The lack of proper financial reporting does not provide license for an appraiser to resort to obtuse measures such as total assets or gross sales as a foundation for establishing value.
- Some situations may require consideration of broad financial measures and/or somewhat remote market evidence as a basis for speculating on value when the quality of net worth and /or the visibility of cash flow are obscured. Such situations may require the valuation to be qualified as falling short of a formal appraisal opinion under most professional standards.
- In other cases, an appraiser simply has to operate with the available information.
These considerations are based on experience, observations of public and private markets over time, and a dose of informed judgment; differences, both semantic and substantive, can exist from one appraiser to the next. One could ask: When should a valuation not reflect balanced consideration of all approaches and methods? The right answer is – never. It is always helpful to assess the value indications from all approaches and methods in the context of one another. However, consideration and direct reliance are different things. In many cases, there is simply not ample information, market evidence, or cause to develop values under each approach.
Appraisers owe the users of their reports a credible explanation of where reliance was placed and in what proportion. There are times when financial information and valuation evidence suggest that brevity is the high road and that too much analysis along lines that are ultimately not relied upon in the valuation is confusing or misleading. Appraisers simply must use the judgments extended them by the appraisal standards to present a complete picture of the relevant methodological landscape. However, appraisers and their audiences benefit from the use of a core set of processes and considerations for deriving and displaying the correlation of value.
The table in Figure 3 is provided for perspective. We note that the valuation of most business enterprises is ultimately driven by the economic returns generated on the assets that comprise the business. As such, the income approach is the primary indicator of value in most business appraisals where the business is a going concern and not simply a fund of underlying net assets. Unfortunately, the income approach can be difficult to model in certain circumstances such as a recession.
For ESOP appraisals, the above perspectives can be shift based on the comfort and confidence of the appraiser/trustee in the company’s ability to maintain a sustainable ESOP benefit. Repurchase obligations ultimately require cash flow. Depending on the overall design and management of the ESOP plan, appraisers and trustees are cautioned when relying on asset-based value indications without taking into consideration the ability of the company to sustain the asset base when cash flows fall short of servicing the ESOP’s needs, let alone the needs of the business. ESOP companies that experience a decline in business activity and which have little prospects of recovering to past performance levels (or worse, remaining a going concern) should likely include consideration of a liquidation premise. The liquidation premise is often developed and studied using an asset value perspective, adjusted for the time-value and liquidation consequences that could befall the assets as they are sold. Such a premise need not be a death sentence for the ESOP or the Company, but may relevant to consider during a time of reorganization for the sponsor company.
When businesses are displaying significant volatility and/or a fundamental change in business posture (particularly on the downside), appraisers and trustees are encouraged to communicate about the underlying methodology and the potential need to redefine the level and premise of value for the appraisal. Such changes could materially rebalance the consideration of the underlying approaches and methods toward the conclusion.
Correlation Examples
Following are some typical examples of a correlated indication of value. We have provided differing examples based on varying scenarios. The numerical values and weights are for demonstration purposes; the weights applied are not based on any rigid formula and will vary for each appraisal based on the totality of underlying factors for each appraisal.
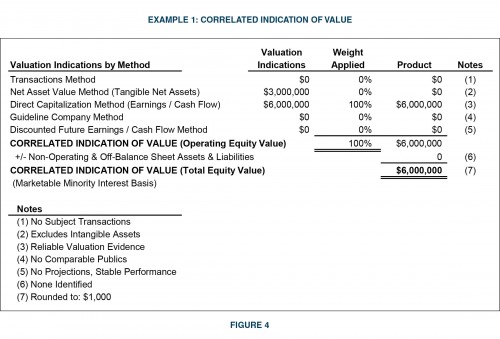
Example 1 in Figure 4. Small to medium service business; stable market, consistent performance and expectations; valuation definition is FMV minority interest, correlated value before discount for lack of marketability.
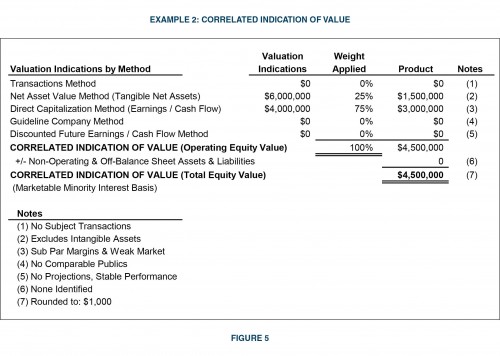
Example 2 in Figure 5. Small distribution business; challenging market conditions and sub-par expectations; company owns real property and other fungible assets; valuation definition is FMV minority interest, correlated value before discount for lack of marketability.
Example 3 in Figure 6. Large producer of value-added capital assets; stable markets and expectations; advanced financial management and capital resources; value definition is FMV minority interest, correlated value before discount for lack of marketability.
In Figure 6, we can see that the income approach was allocated two-thirds of overall weighting. Looking deeper, if the GPCM exclusively considered cash flow calculations (say net earnings and EBITDA), then income measures were effectively weighted 100 percent in the overall valuation; the only difference being the specificity of the market evidence used to value the income and cash flows.
For cases in which the GPCM is used, there may be reasons that some calculations should receive greater underlying consideration than others (say capitalized book value rather than EBITDA). This may simply be a variation of the same theme of shifting weights between asset-based and income-based methods to address issues related to business and economic cycles.
Variations on these examples are almost endless. There are often circumstances in which value indications vary greatly and require thoughtful explanation about why a value that appears at one end of a spectrum was exclusively weighted.
In some cases, a simple average might be appropriate but appraisers should be cautious when averaging a potentially non-meaningful indication with a meaningful indication.
Rarely does the averaging of an unreliable indication make the end result correct unless additional explanation and support are provided about how the resulting correlation relates to the most meaningful valuation evidence.
Accordingly, a relative value analysis, as in Figure 7, may be a useful tool in helping explain how each indication relates to other indications. Let us expand on the third example with some additional information to see how the various indications compare to each other. Such a comparison could be used in an iterative fashion to reach a final weighting scenario as well as to provide support for the conclusions reached in the report. Note that the relevant comparisons are being made at the marketable minority interest level of value.
At the marketable minority interest level of value, the subject’s relative value measures can be directly compared to the relative value measures of the guideline public companies.
Relative value assessments that compare subject valuation results to peer valuation evidence must be performed using an appropriate and comparative level of value for both the subject and the peer.
Section 5 of Revenue Ruling 59-60 addresses the weight to be accorded to various factors in an appraisal. In the context of an operating company appraisal, judgment is required to reconcile what may be diverging indications of value among the various valuation approaches (or even methods within a single approach or method).
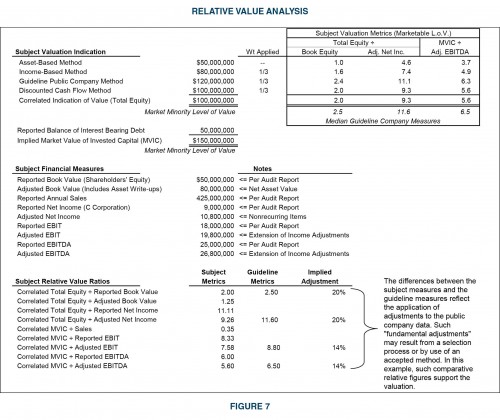
Although averaging widely diverging indications of value from various valuation methods may be appropriate in a particular valuation, appraisers should assess why such large differences exist. Do indications from the market approach suggest that assumptions made in methods within the income approach be revisited? Or do the results from an income approach shed light on the appropriate fundamental adjustment (or selection of guideline companies)?
Within the market approach, indications of value can vary widely, depending on the financial measure capitalized. The appraiser may glean hints with respect to the weight to a particular indication by considering why such differences occur. Differences between indications derived from capitalized net income and EBIT are a function of the financing mix.
Differences between indications derived from EBIT and EBITDA may reveal varying degrees of asset intensity. Capitalized revenue measures provide a view of “normalized” margins – are the margins of the subject company likely to improve or deteriorate? Finally, capitalizing measures of physical volume (number of subscribers or units sold, for example) could reveal unit-pricing disparities between the subject and the selected guideline companies.
There can be no fixed formula for weighing indications of value from various valuation methods. Responsible appraisers, recognizing this, should apply common sense and informed judgment in developing a correlated indication of value.
Conclusion
Given the potential diversity of valuation evidence and methodology in most business appraisals, a well-reasoned and adequately documented process is required to support the initial and final valuation conclusions derived in a business valuation. In this publication we provided insight on the functional processes and analytical considerations underlying the determination of a correlated indication of value. Additionally, we discussed methods and perspectives that can be used to justify the underlying methodology and valuation evidence relied upon while providing relative value observations to support the reasonableness of a valuation conclusion.
Valuation Discounts and Premiums in ESOP Valuation | Appraisal Review Practice Aid for ESOP Trustees
This article first appeared as a whitepaper in a series of reports titled Appraisal Review Practice Aid for ESOP Trustees. To view or download the original report as a PDF, click here.
There is a protracted and clouded legacy of information and dogma surrounding the universe of discounts and premiums in business valuation. It seems logical enough that as elements of business valuation, the underlying quantification and development of discounts and premiums should be financial in basis, just as other valuation methods are founded on financial principles. Much of the original doctrine surrounding the determination of discounts and premiums was based on reference to varying default information sources, whose purveyors continue the ongoing compilation of transaction evidence (public company merger and acquisition activity, restricted stock transactions, pre-IPO studies, etc.). After begrudging bouts of evolution, there has been maturation toward more disciplined and methodical support for valuation discounts and premiums. Perhaps as the state of the profession concerning discounts and premiums has progressed, so, too, has the divide in skill and knowledge among valuation practitioners become wider. Certainly this seems to be the case regarding many users and reviewers of appraisal work (ostensibly the legal community, the DOL and the IRS).
There remains ample debate concerning numerous issues in the discount and premium domain. Unfortunately, in the quest for better clarification on the determination of discounts and premiums there has developed an arms’ race of sorts. Despite the emergence of compelling tools and perspectives, no method or approach appears to have the preponderance of support in the financial valuation community. Nowhere is this truer than with the marketability discount (also known as discount for lack of marketability or DLOM). Within the ESOP community much of the confusion over DLOMs is mitigated due to the presence of put options designed to ensure reasonable liquidity for ESOP participants. However, in the ESOP community a legacy of concern over control premiums has now become an acute issue as stakeholders and fiduciaries have increasing concerns regarding flawed valuations and prohibited transactions.
The Levels of Value
Regarding the concept of control premiums and minority interest discounts (also known as “lack of control discounts”), there is less conflict and more uniformity on how and when these discounts are used in a business appraisal. That is not to say that differences among appraisers don’t exist regarding certain issues. For purposes of establishing a platform to converse on valuation discounts and premiums, let us use the conventional levels of value framework to anchor the discussion. Figure 1 provides structure about where the traditional valuation discounts and premiums are applied in the continuum of value.
The integration of the basic income equation of value into the levels value chart results in the equations and relationships shown in Figure 2. It is here that we can begin to understand that valuation discounts and premiums are not devices in and of themselves. Each is the product (consequence) of the relationships among and between the underlying modeling elements that constitute financial valuation(cash flow, risk and growth). We note that the conceptual core of the mathematical relationships is generally centered on the freely traded world of the public stock markets, which is characterized as the “marketable minority” level of value (enjoying readily achievable liquidity in a regulated, timely, and efficient market). Although other levels of value can be directly observed in various markets, the marketable minority interest level of value characterizes the empirical world from which most valuation data and observations are made (i.e., Ibbotson).
- CF = cash flow; CFe= cash flow to the business enterprise; CFsh = cash flow to the shareholder; subscript “c,f” and c,s” denote, respectively, CF available to financial control investors and CF available to strategic control investors.
- R = risk as expressed by the required rate of return on investment; Rmm, Rfand Rsdenote risk as perceived through the eyes of marketable minority investors, financial control investors and strategic investors, respectively.
- G = growth rate in cash flow or value (see notes above on “R”). Gmm, Gfand Gsdenote growth as expected from the perspective of marketable minority investors, financial control investors and strategic investors, respectively. Gv differs from the other growth expressions in that it is an expression of the growth rate in value for the subject security in an appraisal exercise. All other expressions of “G” are growth rates in the cash flow of the business enterprise.
The take away from the relationships depicted in Figure 2 is that risk is negatively correlated to value (the universal reality of the time value of money) and that cash flow and the growth rate in cash flow are positively correlated to value. According to the preceding relationships, a control premium only exists to the degree that control investors reasonably expect some combination of enhanced cash flows, lower risk, or superior growth in cash flow, all as a result of better financial and operational capacity (financial control). Taking the financial control relationships one step higher via specific synergies results in a strategic control premium (which is not considered within the continuum of fair market value and generally exceeds adequate consideration for ESOP transaction purposes).
Conversely, a marketability discount exists to the degree that investors anticipate subject returns (yield and capital appreciation) that are sub-optimal in comparison to the returns of a similar investment whose primary differentiating characteristic is that it is freely traded (also known as liquid). That is to say, minority investors (buyers and sellers) in closely held businesses that have investment-level considerations such as higher risks, lower yield, and/or lower value growth require some measure of compensation to compel a transaction in the subject interest. Otherwise, the investor would seek an alternative.
Perspective on the Control Premium
What is a control premium? The American Society of Appraisers (ASA) defines a control premium as an amount or a percentage by which the pro rata value of a controlling interest exceeds the pro rata value of a non-controlling interest in a business enterprise, to reflect the power of control. In practice, the control premium is generally expressed as a percentage of the marketable minority value.
Based on this definition, it might seem that no controlling interest valuation can be developed without an explicit quantification to increase a value that is initially developed using a marketable marketable-minority interest level of value. This might be true in for circumstances in which the control value is not the direct result of the underlying methods. The fact is that most controlling interest value appraisals are developed based on adjustments and methods that result directly in the controlling interest level of value. Therefore, no explicit control premium is required. Consequently, the appraiser cannot explicitly define the magnitude of the control premium in the appraisal.
In many cases, the appraiser may state that no control premium is added because all the features and benefits of control have been captured in the earnings adjustments and/or through other modeling assumptions in the underlying methods. We have seen numerous situations in which an appraiser was accused of failing to develop a control valuation because there is no explicit control premium applied to the correlated value or to the individual methods that are weighed in the correlation of value. Archaic though it may be in the context modern valuation practice, such accusations still exist even when the valuation features all the perfunctory control adjustments and treatments. For cases in which normalization and control adjustments were applied to cash flows and other elements, the additional application of a discrete control premium implies that there are further achievable control attributes. In such cases the control premium is likely quite small in comparison to typical published measures. If control adjustments are applied and a control premium is also applied, there is a potential overstatement in the valuation. This type of circumstance is a hot bed issue with the Department of Labor as such treatments could be the underpinning of a prohibited transaction. Appraisers and trustees are cautioned about the potential for double counting when applying an explicit control premium.
The primary published source for control premium measurements is Mergerstat Review,published annually by Mergerstat FactSet. Mergerstat Review reports control premiums from actual transactions based on differences between public market prices of minority interests in the stock of subsequently acquired companies prior to buyout announcements and actual buyout prices. It is worth noting that Mergerstat’s analysis indicates that higher premiums are paid for public companies than for private concerns because publicly traded companies tend to be larger, more sophisticated businesses with solid market shares and strong public identities. From a levels-of-value perspective, most of the transactions reported in Mergerstat Review are believed to contain elements of strategic value, which explains the relatively high level of control premiums cited therein. This strategic attribute of the data also makes it potentially troublesome when relied upon in ESOP appraisals.
Noteworthy is the now widely accepted presumption that public stock pricing evidence is reflective of both the marketable marketable-minority and controlling financial interest levels of value. Referring to the expanded levels of value chart, minority interest discounts and financial control premiums are thought to be much lower in comparison to annually published data in Mergerstat Review. Thus, the two central boxes in the four-box vertical array of the expanded levels of value chart are essentially overlapping as in Figure 3.
The parity of value between financial control and marketable minority requires a few assumptions: normalized earnings adjustments are required, and these adjustments include some considerations that certain appraisers believe are not part of the minority interest equation (namely owners’ and executive compensation). We believe that return on labor and return on capital are reasonable to segregate in valuations based on all levels of value. However, there may be differences between financial control and marketable minority valuations based on enterprise capital structure. There may be some consideration for the lack of liquidity to both control and minority investors when adjusted income streams overstate the real economic cash flows available for distribution or other shareholder-level benefits (including cash flows necessary to sustain an ESOP). There may be some justifiable difference in value for situations in which the valuation subject’s capital structure appears more conservative than its peers. However, wanton manipulation of capital structures (for example, in the development of a weighted average cost of capital or WACC) in deriving the cost of capital is a frequent source of error in appraisals using a discounted future benefits (DFB) method. Such errors can lead to under- or over-valuation.
Control Premiums — Substance Over Form
Most appraisals that employ a controlling interest level of value definition do not (or should not) display a discrete or explicit control premium. That is because the adjustment processes underlying most individual valuation methods provide for the full consideration of control and thus do not require or justify further adjustment in the form of an explicitly applied control premium. So, despite the lack-of-control form that many control appraisals have, there is ample structure within the methodologies to capture the substance of a control premium. The following perspective plays off the basic equation to business valuation as well as the levels of value chart that depicts the relationships between risk, growth, and cash flow as one moves up and down the levels of value conceptual framework.
- Control premiums can be the result of earnings adjustments that eliminate discretionary expense, such as excess and non-operating compensation. Shareholder compensation paid to individuals who do not contribute to operations or management, directors’ fees paid to family or others for non-vital roles, management fees paid to retired owners, loan guarantee fees paid to shareholders whose capital resources are not required, and other similar types of expenses are often the underlying control “pick-up” in an appraisal. Arguably, many of these adjustments should be part of the normalizing process for all appraisals so that returns on capital are clearly differentiated from returns on labor. When such adjustments are used to underpin an ESOP transaction, subsequent expenses and policies of the ESOP sponsor in future periods should confirm the credibility of the adjustments.
- Control premiums can take the form of adjustments that place related party income and expense at arm’s length pricing. Rents paid to related parties, management fees paid to affiliated entities, optimizing value or discretionary income from non-operating assets, and many similar adjustments that optimize the subject benefit stream are all part of the control mindset.
- Control premiums can be related to the optimization of capital structure. Many businesses enjoy the quality of having little to no interest interest-bearing debt. Perhaps in the paradigm of today’s financial landscape, this is a better quality than previously appreciated. However, if a hypothetical investor can easily use debt in an efficient and responsible fashion to provide for the financial needs of the business, the subject’s cost of capital may be reduced and correspondingly, the return on equity of the business can be improved. That is not to say that increased debt, as low cost as it may be, does not increase the potential risk profile of equity holders. All things equal, a reasonable blend of debt in the capital structure for a bankable group of assets and cash flow will provide a potential enhancement of return on equity. Many appraisals that refer to public company debt ratios or to private peer balance sheet ratios to support an assumed capital structure that is different than actually employed at the subject entity. This can constitute a control premium. However, when taken too far or when assumed in a fashion that does not properly capture the incremental risk that a higher level of debt has on equity investors, the manipulation of capital structure can result in material valuation flaws.
- Control premiums can emerge from weights applied in the correlation of value. In many cases, the valuation methods used to value a business result in similar value indications for both control and minority situations. However, a control valuation may include differing weights on the value indications such that the correlated value is higher than would result from the weighting scenario applied in a minority interest appraisal. Additionally, if a guideline transaction method is used in a control valuation and is weighed toward the correlation of value, the resulting value may represent a premium to the other indications of value developed in the appraisal.
- In tandem, capital structure efficiencies, income and expense efficiencies, and the consideration of peer transaction evidence are significant, albeit seemingly silent, control premiums.
Perspective on the Minority Interest Discount
What is a minority interest (lack of control) discount? The ASA defines a minority interest discount as the difference between the value of a subject interest that exercises control over the company and the value of that same interest lacking control (but enjoying marketability). In practice, the minority interest discount is expressed as a percentage of the controlling interest value. A minority interest is an ownership interest equal to or less than 50 percent of the voting interest in a business enterprise (or less than the percentage of ownership required to control the assets and/or the discretionary expense structure of a business).
As with the control premium, the minority interest discount is infrequently called upon in the valuation (as an explicit treatment) of most operating businesses because the majority of methodologies used to value nonmarketable minority interests results in an initial value at the marketable minority interest level of value. Accordingly, only a discount for marketability is required to derive the end nonmarketable minority valuation result.
Minority interest discount discounts are a more common feature in the valuation of certain types of investment holding entities such as limited partnerships. This is because such entities have highly diverse purposes versus the relatively narrow operating focus of most operating business models. As such, the assets owned by the entity are generally best appraised by a specialty appraiser or from direct observation of market evidence concerning the asset. That being the case, most such entities are valued using an asset-based approach, which inherently captures the controlling interest level of value for the underlying assets. This makes it necessary for the business valuation to be adjusted first for lack of control considerations and second for lack of marketability concerns. Additionally, in cases involving operating business that hold operating and/or non-operating real property assets, such assets may need to be appraised by an appropriate expert and adjusted with a minority interest discount when integrated into the minority interest enterprise value of an operating business.
Although minority interest considerations are captured in the majority of appraisals by reference to returns on marketable interest investments in the public marketplace, there are techniques for developing the discount. One such method involves mathematically imputing the discount based on an assumed control premium. Other methods involve observations of securities trading values in the context of the valuation of the issuer’s underlying assets, such as the case with closed closed-end funds and other securities in which underlying assets have an observable value that can be compared to the security’s trading price.
The following formula provides an expression of the percentage minority interest discount as a function of an assumed percentage control premium. Although the expression is useful in identifying the minority interest discount as a percentage of an assumed or developed measure of control value, it is rarely used in a direct sense in the valuation of minority interests.
In the valuation of minority interests in asset investment entities (limited partnerships et al.) that are invested in various classes of assets, many appraisers look to the observed discount to net asset value (NAV, the market value of a fund’s asset holdings less its liabilities) that closed-end funds (CEF) typically trade at as evidence of an applicable minority interest discount for a subject partnership or similar ownership interest. As a general rule, CEFs report their net asset values and the price-to-NAV relationship typically reflects a discount. Observed discounts to NAV reflect the consensus view of the marketplace toward minority investments in the underlying portfolios of securities. That is, the discounts are illustrative of the market’s discounting of fractional interests in assets, making them somewhat comparable to a minority interest in an entity that is heavily invested in other assets (such as marketable securities and other asset classes).
Discounts to net asset value for closed-end funds have been consistently observable for many years. The precise reasons for such discounts are subject to debate, but common attributes include the following factors:
- A lack of investor knowledge about the underlying portfolio;
- Absence of investor enthusiasm about the underlying portfolio;
- Enthusiasm, or lack thereof, about the fund’s manager;
- Expense ratios;
- Tax liabilities associated with embedded gains;
- Lack of management accountability; and
- Lack of investment flexibility
Although closed-end funds may not be directly comparable to the subject interest in an appraisal, the discounts typically observed are evidence of the market’s discounting of portfolios of generally liquid securities, and, therefore, offers valid indirect evidence of minority interest discounts applicable to asset-holding entities and operating businesses.
Marketability Discounts
The ASA defines a marketability discount as an amount or percentage deducted from the value of an ownership interest to reflect the relative absence of marketability. Augmenting the consideration of marketability is the concept of liquidity, which the ASA defines as the ability to readily convert an asset, business, business ownership interest, security, or intangible asset into cash without significant loss of principal. Lack of marketability and lack of liquidity overlap in many practical regards. However, lack of liquidity is often attached to a controlling interest, while marketability discounts are used to describe minority interests.
Despite the proliferation of marketability discount studies and models, most models fall into one of three primary categories. These categories are based on the underlying nature of the analysis or evidence from which each model emanates. They include market-based perspectives (commonly referred to as benchmark analysis), options-based models, and income-based (rate of return) models. Although it is not our place to define a given model as the model, we do recognize that some models (or perspectives) provide general guidance for the appraiser regardless of the specific model employed. The following is a list of the so-called Mandelbaum factors, which are derived from the Tax Court’s ruling in Mandelbaum v. Commissioner (T.C. Memo 1995-255, June 12, 1995). In essence, these factors serve a similar guidepost for the assessment of marketability, as does Revenue Ruling 59-60 for the valuation of closely held interests in general.
- The value of the subject corporation’s privately traded securities vis-à-vis its publicly traded securities (or, if the subject corporation does not have stock that is traded both publicly and privately, the cost of a similar corporation’s public and private stock);
- An analysis of the subject corporation’s financial statements;
- The corporation’s dividend-paying capacity, its history of paying dividends, and the amount of its prior dividends;
- The nature of the corporation, its history, its position in the industry, and its economic outlook;
- The corporation’s management;
- The degree of control transferred with the block of stock to be valued;
- Any restriction on the transferability of the corporation’s stock;
- The period of time for which an investor must hold the subject stock to realize a sufficient profit;
- The corporation’s redemption policy; and
- The cost of effectuating a public offering of the stock to be valued, e.g., legal, accounting, and underwriting fees.
This list extends to considerations beyond the pure question of marketability. However, the ruling is instructive in its breadth. The Mandelbaum process is characterized by many appraisers as a qualitative or scoring procedure.
However, most of the parameters are mathematically represented by financial elements and assumptions under the income- and options-based models. Such parameters are also used, to the degree possible, in searching out market evidence from restricted stock transactions, which are documented in varying degrees by numerous studies over several decades.
Benchmarking analysis relies primarily on pre-IPO studies and restricted stock transactions. In essence, benchmarking calls for the use of market-based evidence to determine a lack of marketability discount. Some appraisers have pointed out the oxymoron of benchmarking (market transactions) analysis for use in determining marketability discounts.
On the same note, other appraisers cite the restricted stock studies for capturing market evidence that at its core demonstrates the diminution to value associated with illiquidity. Imputed evidence concerning the implied rates of return for restricted stock lends support for more specific analyses within certain marketability models.
Options-based models, most of which are derivations and evolutions of the Black Scholes Option Model, are based on assessing the cost to insure future liquidity in the subject interest. Rate return models are based on modeling the expected returns to the investors as a means for determining a valuation that results in an adequate rate of return given the investment attributes of the subject interest.
There is no one method that is acknowledged as superior to all others. Indeed, virtually every method employed in the valuation universe has been challenged or debated in the courts as well as by and among the professional ranks of appraisers.
Perhaps the best approach, stemming from a review of the IRS’s DLOM Job Aid, which was discovered and published a few years ago, is the use of multiple disciplines in a fashion consistent with the breadth of valuation approaches called for in business valuation (principally the income and market approaches).
DLOMs in ESOP Valuation
Notwithstanding the previous perspectives on DLOMs and the methods and processes for developing them, most ESOP appraisals that involve a minority interest definition of value reflect a relatively minimal DLOM of 5-10%. This is due to the obligatory put option feature required for qualified retirement plans holding closely held employer stock.
The virtual guarantee of a market for the ESOP participants’ interests is believed to all but eliminate the DLOM. The consensus treatment from most appraisers is that a DLOM applies and is relatively small (say 5-10%) but not 0%.
Some appraisers use the DLOM as a proxy for concerns about future liquidity as it relates to the sponsor company’s ESOP repurchase obligation. If a business is floundering, has a significant bubble of participants requesting near-term liquidity, has pour cash flow, has limited financial resources or financing options, and/or any other underlying fundamental challenge, some appraisers will use a DLOM to reflect this concern.
DLOMs quantified in the correct fashion may indeed be a viable approach to capturing the cash flow needed to service repurchase obligations and the associated effect on the sustainable ESOP benefit (the stock value). However, many appraisers use a more direct and explicit approach to studying and treating the repurchase obligation by iterating the associated expense into the valuation modeling (generally using an income method).
The expense is determined through a repurchase obligation study which informs trustees, sponsors, and plan administrators what measure of cash flow will service the foreseeable needs of the plan. To the degree that the assumed ongoing retirement plan funding is insufficient to service the obligation, an additional expense may be applied or a single present-value adjustment may be quantified to adjust the total equity value of the business.
Conclusion
The application of a discount or premium to an initial indication of value is an often controversial and necessary input to the valuation process. Fortunately, appraisers are equipped with numerous income and market methodologies to derive reasonable estimates of the appropriate discount or premium for the subject interest.
As with the determination of the initial indication of value, it is ultimately up to the valuation analyst to choose the appropriate methodology based on the facts and circumstances of the subject interest.
None of the available methodologies are perfect, and all of them are subject to varying degrees of criticism from the courts and members of the appraisal community. Critics of the various market approaches often cite the lack of contemporaneous transaction data that are rarely comparable or applicable to the subject interest.
Arguments against the income methodologies often focus on the model’s inputs, particularly the holding period assumption, which is typically uncertain for most private equity investments.
The number of discount methodologies and their respective criticisms will, in all likelihood, continue to expand into the foreseeable future. It is ultimately up to the appraiser to consider the various options and determine the appropriate model or study applicable to the subject interest.
There are no hard-and-fast rules or universal truths that are applicable to all appraisals when it comes to the selection of an appropriate discount methodology. Appraiser judgment is ultimately the most critical input to any valuation, particularly in regard to the application of an appropriate discount methodology or control premium.
Admittedly, the number of discount methodologies and their corresponding criticisms can be a bit overwhelming to anyone unaccustomed to reviewing or writing business valuation reports.
At the end of the day, the most important thing to keep in mind is how reasonable the discount (or premium) is in light of the liquidity and/or ownership characteristics of the interest being appraised.
An appraisal may have carefully considered all the pertinent discount methodologies and their criticisms, but if the ultimate conclusion is not reasonable or appropriate for the subject interest, it will probably not hold up in court or communicate meaningful information for the end user of the report. Appraisers should investigate the reasonableness of their conclusions when preparing valuation reports and related analyses.
Minority Value Multiples Can Trade Higher Than Enterprise Value Multiples: Sometimes it’s Cheaper to Buy the Whole Company
Many investors, analysts and business appraiser’s believe1 that publicly traded price multiples / minority equity value multiples can be used to estimate enterprise value, control level value of a business, or by simply applying an incremental premium for control to a selected publicly traded minority multiple. Typically this method can be done by using a sample of comparable publicly traded companies, observing a range of P/E2 multiples and selecting a multiple within the range or typically by analyzing enterprise transaction multiples. At this point, a simple premium for control is applied and market value of debt is added to arrive at an enterprise value.
For example, if a sample of comparable publicly traded companies has a P/E multiple range of 10x to 14x and the appraiser selects 12x, he would then apply a premium for control of 25% (historically observed average in studies), add the market value of debt and arrive at an enterprise value multiple north of 15x earnings.
However, this mathematical calculation many times is not a supportable method to estimate a marketplace transaction for enterprise value.
As business appraisers, our job is to “Mirror the Marketplace” when valuing businesses. In doing so, the above methodology and the implicit assumption made is that minority value serves as a reasonable baseline, or starting point, for enterprise value. Very few appraisers understand that the most accurate explanation of the relationship between minority value and enterprise value is that there is no functional relationship between minority multiples and enterprise value.
Why is this explanation true?
The reason is based on stock market dynamics and trading history, but primarily because: The economic and financial drivers that influence an enterprise buyer are fundamentally different than a minority buyer. List of drivers for the typical minority buyer:
- Has a contained and restricted insight into earnings and growth prospects;
- Has limited or nearly no insight into the long term business plan & its associated risks;
- May have controlled information into the competitive environment; and
- May have narrow views into the future outlook for new products, pricing strategies and risk profile, etc.
The opposite is often true for the enterprise buyer. These factors have a significant and dramatic impact on enterprise value. As a result, there are times when a minority price pro-rata can significantly exceed what a prudent enterprise level buyer will pay, pro-rata, for a company. Vice versa, there are times when the enterprise value can be much more than the amount indicated by an application of an average premium for control percentages.
Case Study
A publicly traded restaurant company operated 22 locations across the U.S. After a brief due diligence period, it was discovered that two of these locations generated 3x to 4x the profit of an average company store, 40% of the total company annual cash flow and had short-terms remaining on their leases (3 and 5 years). These two locations were also unique in they were located in a resort area, with a landlord who had a history of increasing rent dramatically, to “milk out” the excess profits, after the initial lease period. This piece of information was not known to the public as it was a trade secret of the landlord and lessor, but not shared with the public. Therefore, it was likely that the future profits of the restaurant company from current stores would go down significantly at the end of the current lease period. As a consequence, the value, and its associated multiples, to a prudent enterprise buyer would be substantially less than the minority multiples observed in the public market.
In contrast to the above case study, there are other times when new products are coming online with risk and growth prospects that are not reflected in current or historical earnings. As a consequence, when the new products hit the market, the earnings may jump and significantly increase the enterprise value above and beyond the observed minority price.
Conclusion
As a result of the above Case Study, it is clear that an appraiser must go through a proper due diligence process to understand of the impact of the cost, income, and market approach to truly understand the enterprise value of a company. It is also clear that assuming a publicly traded minority value as a reasonable basis to calculate enterprise value can lead to a significant error in due diligence and negatively impacts the credibility of an enterprise value opinion.
This article was originally published in Valuation Viewpoint, July 2014.
Footnotes
1 Based on studies and articles
2 Price to Earnings Ratios
Personal Goodwill Can Have a Big Impact on Fair Market Value
When WADL-TV 38 founder Franklin Z. Adell died, he left behind what would prove to be a complex estate. The estate, handled mostly by Adell’s son Kevin, isn’t a stranger to legal battles. In the years since Adell’s death, the heirs have faced a number of legal issues, including a dispute between Kevin and his two sisters regarding distribution of assets from the estate.
This is a bellwether case on personal goodwill and its impact on fair market value of a business. Is it worth $92 million dollars like the IRS’ initial estimate or $4.3 million dollars liquidation value as opined to in the estate’s second valuation?
This is the range of the valuation opinions on this case. The key takeaway in all of this?
Make sure your appraiser understands all key agreements because they can be critical to the value proposition.
The facts of the case are as follows: A religious non-profit corporation (The Word Network) transferred virtually all their revenues via a service agreement to a for-profit entity (STN.com, Inc.) owned 100% by Franklin Adell. This was the only customer of STN.com. Mr. Adell’s son Kevin was very active in the company and also had strong personal relationships with the trustees of the non-profit. He had no non-compete or employment agreement with the STN.com.
After his father’s death, Kevin Adell, formed a mirror corporation and all the employees but one, moved to a new corporation as did the service agreement from the Word Network and its associated revenues.
The IRS’ initial valuation assessment was $92 million dollars for the enterprise of STN.com. A national appraisal firm’s expert appraiser’s, hired by the Estate of Mr. Adell, initial assessment was $9.3 million. In this valuation, consideration was given to the personal goodwill of the son, Kevin Adell. The estate’s appraiser believed there was significant inherent risks associated with Kevin’s personal goodwill for the business which warranted a substantial discount.
In a subsequent valuation by the estate’s appraiser, he concluded that he had not fully considered the restrictive terms of the service agreement with the non-profit. In this reevaluation he concluded that a valuation of STN.com, Inc. was $4.3 million dollars. To arrive at this conclusion, he used the adjusted book value and gave no market value for intangible assets. The IRS’ expert adjusted the initial assessment of $92 million and testified that the value was $26.3 million dollars at the date of death.
The judge found that the estate’s substantially inconsistent positions regarding the valuation and therefore the burden of proof remained with the estate. Since STN was historically profitable and an economic charge of $8 to $12 million dollars for Kevin’s personal goodwill was deducted from the valuation in the first appraisal, the court concluded that the first appraisal from the estate’s expert was reasonable and selected $9.3 million dollars for the fair market value.
In summary, performing valuations for estate tax purposes is a serious matter as the audience for these reports is the IRS which will challenge an opinion of value where the facts are not clearly communicated and risk is not adequately disclosed. In the above case, an IRS challenge resulted in a trial and multiple valuations.
This is an expensive by-product of not understanding the facts of the case at the outset. An attorney and their appraiser need to fully understand the facts and key agreements driving a business in the initial phases of an engagement. This case was not unique in its complexity. The concept of personal goodwill is logical and supportable, and the valuation implications are real. The valuation impact can be significant on fair market value.
This article was originally published in Valuation Viewpoint, September 2014.
How to Choose the Best Business Appraiser
Are you considering buying or selling an operation, have a gift or estate tax issue, buying or selling a minority equity interest in an operation, or have fair value or fair market value-related financial reporting requirements for either GAAP or tax purposes?
If so, a fundamental question exists: How much is your business and assets worth? To find out, you need the experience and expertise of a business valuation expert – a business appraiser.
Small businesses and big corporations often don’t know what to expect when choosing a business appraiser. Two critical questions to ask are: (1) How do I know if they are qualified; and (2) What should an appraisal cost? Appraisers play a vital role in the market, and choosing one takes a little knowledge and lots of comparing to get comfortable with your selection.
Look for Professional Certifications
Many business owners, attorneys and advisers aren’t sure what qualifications a trustworthy expert business appraiser should have. Just as accountants and doctors might use CPA and M.D., respectively, business appraisers often have a set of initials confirming they have received extensive training and/or have ample experience in their field. These certifications span a broad range, but they all indicate that the business appraiser knows what he or she is doing. Here’s an overview of common certifications:
- ASA (Accredited Senior Appraiser) – Issued by the American Society of Appraisers (ASA). To earn this prestigious certification, applicants must have a 4-year degree, 5 years of business appraisal experience; take 96 hours of ASA’s rigorous course sets and 12 hours of oral and written exams. They must also interview with their local ASA chapter, pass an ethics test, and submit two appraisal reports before their peers. In addition, active ASAs must complete additional courses on an ongoing basis to keep their designation.
- CBA (Certified Business Appraiser) – Issued by the Institute of Business Appraisers (IBA). Holders must be an active member of the IBA, have a 4-year business degree, complete 6 hours of various workshops and training programs, pass the CBA exam, have submitted two demonstration reports and have 5 years of appraisal experience or 90 hours of class time. Requirements may be lessened for those who hold other business appraisal certifications prior to application.
- CPA/ABV (Certified Public Accountant Accredited in Business Valuation) – Issued by the American Institute of Certified Public Accountants (AICPA). Holders must have a valid CPA, complete the ABV exam, work on ten engagements and meet business valuation experience and education requirements.
- CVA (Certified Valuation Analyst) – Issued by the National Association of Certified Valuation Analysts (NACVA). Holders must have a valid CPA or relevant business degree, at least three personal and business references, has passed a proctored exam and two years or ten engagements of business appraisal experience.
Obviously these certificates have vastly different levels of experience to satisfy the designation. Be sure and know the difference when selecting your appraiser. Of course, these certifications aren’t tell-all determinants of an appraiser’s skill or qualifications. Not all ASAs are equally experienced in the same industry. Consider their work experience, industry experience and client references. Review their website and publications made by the appraiser. While experience and expertise are really important, credentialing provides added support in litigation environment before the court, the IRS or when subjected to auditor review.
Beware of Right-Hand Appraisers
Make sure that your business appraiser exercises complete objectivity when appraising your firm. An appraiser’s job isn’t to promote you, but to give an unbiased assessment of your organization’s worth. Unruly “right-hand” appraisers may overstate the value of your business for personal gain. These tactics created quite the turmoil in the late 80s real estate market. Homes were frequently overvalued, encouraging banks to hand out heftier loans. When the decade turned, the market crashed.
This is another area where certifications can help. Business appraisers with professional certifications are bound by a code of ethics that prohibits right-handing and other shady practices. Non-certified appraisers may also operate by these ethics, but it’s not guaranteed. Remember that appraisers aren’t on the side of buyers, sellers or loan officers; they work for the good of the free market. Before you sign anything, read the appraisal agreement and verify that there is an independence clause.
Know the Costs
Depending on who you hire, a business valuation can cost between a few thousand to well into the six figures, depending upon the scope of the project. The more services you require, especially those for litigation purposes, the more your appraiser will charge. Especially in “high-stake” situations, most often litigation, the credentials, experience and expertise of your valuation expert matter. Selecting a low-cost provider is often “penny wise and pound foolish” as the results may cost more in the end. Also, keep in mind that litigation services can run hundreds of dollars per hour and can easily skyrocket if proceedings drag on.
Don’t sign a contract with the first appraiser you meet. Instead, compare estimates from a variety of sources, look at their qualifications, and evaluate what your situation requires. Projects that will receive a high level of scrutiny from auditors, the IRS, opposing council or judges will require significant documentation. However, if you’re a small business looking for an oral appraisal, fees should be lower as very little documentation (i.e. report writing) is required.
This article originally appeared in Valuation Viewpoint, October 2014.
What to Consider During A Business Appraisal
Many situations warrant an business appraisal / valuation. Some of the most common occurrences in which a business will need to conduct a valuation include litigation matters, preparation for the sale of a business, tax purposes, buyouts of financial stakeholders, financial reporting of acquired businesses and the issuance of a business-related insurance policy.
Furthermore, conducting a business valuation takes energy and time, and should be conducted by an independent valuation specialist. Selecting a valuation specialist / business appraiser can be complex, which we discussed in a another article, “How to Choose the Best Business Appraiser.”
When beginning the process of a business valuation, a clear understanding of the owner’s bundle of rights is critical before any investigative and analytical procedures are started. After a clear scope is outlined, the analysis is ready to commence. We conceptualize the value principles of most operating businesses into three components: (1) Risk, (2) Growth and (3) Earnings. We believe these are key components of value in a business. Using these as a guide, we seek to understand the nature, history and operations of a business through the perspective and intimacy of the team operating the assets every day, management. To do so, we find it helpful to discuss the operations in the same way as management thinks about its business. We strive to understand the risks that management wants to minimize the growth opportunities that management wants to obtain and the earnings that provide the scorecard for historical operations. The following details the factors which impact these three key components of value in a business.
Risk
Risk is the measurable possibility of something happening or not happening.1 For businesses, risk can be measured in numerous ways including benchmarking against similar businesses (“guideline”) or using a more theoretical approach such as a buildup method from market observation. None of this can be done, reasonably and supportably, without understanding the key economic drivers of the business. This prerequisite entails understanding the historical and current operations, the industry and competitive environment, operating assets, liabilities (booked and/or contingent), stakeholders, growth factors and the earnings profile of the business going forward. After understanding the drivers of risk for the subject business, the same drivers may be ascertained for the guideline businesses so that a supportable comparison can be made, ideally. However, lack of publicly available information does not make this comparison simple, and professional judgment is involved. Rarely is an exact “replica” of a business found in a guideline sample. With an appropriate understanding of the risk factors, and its comparison to similar businesses, the resulting value of a business begins to form. All other factors equal, low risk translates to higher valuation and vice versa.
Growth
Business growth is primarily discussed in the context of revenues, profits, cash flows and assets. For some companies it also can include number of locations, products, contracts, square feet, customers and employees. In addition, growth on a larger, macro scale must also be considered as it applies to economies, industries, markets and populations. These areas are an example of the growth factors which can significantly impact a valuation and careful attention must be made to fully understand these factors in context. When we investigate the nature and history of the business, we find a relative context for future growth. Many times management and business owners make decisions to enhance shareholder value, which may include attaining the highest valuation possible. These decisions are most transparent in forecasts and projections. Risk is inter-related to future growth expectations. In short, considering growth in the context of risk is critical during a business appraisal. All other factors being equal, high growth translates into higher valuations and vice versa.
Earnings
Earnings are naturally a key component to analyze and arguably the most important of the three. Earnings, in this context, is a broad term to discuss operating performance of a business and is inclusive of such terms as EBITDA, net income, dividends, distributions and cash flow, to name a few. Earnings are the primary financial benefit of owning a business and are indications of performance. Careful consideration of these metrics, including industry specific earnings metrics, is very important. Changes in theses metrics over time can provide clarity on operational problems and successes. In addition, appraisers may also consider the earnings of other guideline businesses in the industry. Benchmarking may provide conclusive support regarding industry specific issues in the business but also macro issues across the economy. Earnings have significant impact on businesses strategy, future investment and capital decisions. Without investigating the earnings of a business, an appraiser cannot make an informed opinion on the value of a business.
Summary
All these components can vary substantially as time passes. An appraiser cannot simply assume that growth and earnings will continue uninterrupted into perpetuity. A marketplace is organic and can change quickly. When this occurs, growth over the long term can be difficult to achieve, and people may underestimate the risk associated with high long term growth projections. Careful analysis is necessary when estimating terminal values at the end of a long term growth forecast. When it comes down to valuing a business, understanding risk, growth and earnings are paramount.
This article was originally published in Valuation Viewpoint, November 2014.
Footnote
1 Barron’s Dictionary of Finance and Investment Terms
8 Tips To Creating An Effective Business Plan
You’ve been a business executive for more than 10 years. During the last few years, you have essentially run a business as the manager of a division of a company. You have earned millions of dollars for your employer, while earning a modest salary for yourself.
“What if I started my own business?” you keep thinking to yourself. “Could I as a business owner become so successful that I can keep millions of dollars in profits for myself?”
The answer “yes” might seem obvious, but it’s not. In fact, running a division of a company and running your own company are two completely different skill sets even if both enterprises have the same number of employees.
If you want to run your own company, you are the individual who needs to raise the capital from investors to start, maintain and grow the business. That means you need an effective business plan. Here are eight tips that will help you create such a plan.
1. Conduct a Market Survey
What is the market for the product and/or service you want to manufacture and/or sell? You might think that there is one because the division you are currently running is flourishing, but the market could be worse in the future. Facts from a market survey that shows your idea will succeed should be inserted into your business plan. A more pessimistic survey could convince you to work on a different product and/or service that will be marketable.
2. Recruit Managers with Expertise
And experience. You need to know when to create a business plan and when to present it to investors. Writing a business plan when you’re a lone wolf will not be effective. You need to find a few people whom you trust to work for you. Listing their skills and accomplishments in your business plan will make it more effective. Investors are more apt to be interested in a new business with five accomplished people than one.
3. Be Specific and Modest
A business plan that, for example, claims your company will be the Facebook of businesses sounds egomaniacal. Investors might think, “If the owners of this new business are that good, what do they need me for?” They also might think you’re immature and not especially professional. The business plan should be as specific as possible about the product and/or service and why it will flourish in the marketplace.
4. Be Reader-Friendly
Most investors are in a hurry. They might seem more inclined to spend a considerable amount of time reading every word of your report because of the potential financial stakes, but they’re also human beings. Generally, investors want to read a well-written report with colorful (and informative) graphs and charts. That might mean you should hire a writer, editor, and graphics designer to help devise your business plan.
5. Be Honest about the Numbers
Investors know a new business will take a while before it generates profits and revenues. An effective business plan will show investors that you expect losses at first. The plan should detail the extensive financial commitment you plan to make as the company is launched and realistically project when that investment will pay off. The figures are best presented in charts and graphs. “Graphs, charts, and images can help bring your concept to life,” reports “5 Tips for a Great Business Plan,” a Forbes magazine article. “Plus, it breaks up the text and helps a plan flow better.”
6. Explain Why Investing Is Crucial
The business plan should detail how much money you and your partners are investing in the business and should detail how much more money you need from investors. It should also detail what the investors’ money will be spent on. Will it be on managerial salaries? Salaries for future employees? Product development? Product distribution? Investors are more apt to be willing to invest money if they know what it’s being spent on — and they might be more confident in your venture if they see that you’re willing to take financial risks.
7. Summarize Your Plan
Your business plan should include an extensive and detailed narrative, but it must also include a one- or two-page summary of the plan before the narrative. Prospective investors must be able to explain the plan to other prospective investors in one minute. An effective executive summary will help them do this, “Because bankers and professional investors receive so many business plans, they sometimes go right to the executive summary for an overall view of what your plan is all about,” reports Entrepreneur magazine in “How to Create a Business Plan Investors Will Love.”
8. Make Sure an Attorney Reviews Plan
Your attorney should help you decide the structure of your business. Should it be a corporation? A solo proprietorship? A general partnership? A limited liability company? A limited liability partnership? The attorney should help you present the advantages of the business structure you choose to the prospective investors in the business plan. And he or she should give you advice on whether any information presented in the business plan could pose a legal problem.
These eight tips are just a start. You should also consult experts such as the U.S. Small Business Administration for more advice. Good luck.
This article was originally published in Valuation Viewpoint, December 2014.
Why You Should Create an Employee Stock Ownership Plan
When facing a business transition, owners have two basic options. Sell the company to outside parties or to inside parties (other owners and employees). While there are numerous variations of the two, basically the owner can sell to an outside group, which may be a strategic buyer (someone in the industry already), or a financial buyer, which may be a private equity firm or other investor that wants to own the company. An internal buyer is either a sale to some or all of the employees directly, or through the use of an Employee Stock Ownership Plan (ESOP). ESOPs are usually very cost competitive and many times may pay the highest price. Sale to the employees individually is with “after tax” dollars and can be very tax inefficient.
Until 1974, Employee Stock Ownership Programs were almost unheard of. However since then, they have increased in popularity. In fact in 2014, there were 13.5 million workers in the United States who were covered under ESOPs.
There are many reasons as to why employers offer these types of programs. While some people think ESOPs are used to save companies that are about to go bankrupt, this usually isn’t the case. It’s a great way to transfer ownership from one generation to the next without needing a financing plan.
As an added benefit, these programs tend to be offered as a way to motivate and reward employees. Of course, there are the numerous tax advantages to be gained too. For the most part, market shares are given to workers and they don’t have to purchase them.
How Does an ESOP Work?
When a company chooses to create an ESOP, funds are set aside in a trust fund. The monies are used to buy new shares of stock. Additional funds are contributed to buy new shares as well as to pay back any funds that are borrowed from the ESOP to buy additional market shares. It does not matter how the company pays for the shares, the contributions are tax-deductible as long as certain requirements are met.
Within the trust there are individual employee accounts. The company, of course, decides who has the right to take part in the ESOP. For the most part, however, all employees who work full-time and are at least 21-years-old have the right. An employer decides how the market shares are distributed to each employee’s individual account, with many companies operating on a vested basis, meaning workers with more seniority are given more market shares than those who have less seniority.
Employees receive the cash value of their stocks when they leave the company (most companies mandate that the employees work for them for at least five years), or when they retire. The amount of money that they receive for the stocks is based on their fair market value at the time.
Employer Benefits of Executing an ESOP
For business owners without an established plan to transfer direct ownership to either children or trusted personnel, ESOPs are a strategic way to increase direct ownership to the following generation without having to purchase it outright.
With the establishment of an ESOP, there are significant tax savings to be gained. In 1974 ERISA, or the Employee Retirement Income Security Act, created the modern ESOP as well as a whole host of other retirement vehicles that incentivize companies and employees directly through tax incentives to save money for retirement. Since the government sees a positive social purpose for ESOPs, it provides extraordinary tax incentives for an owner and a company to use an ESOP as a business succession and liquidity tool. Some of these tax advantages include: 1
- The seller of the stock may meet the requirements to defer and then avoid paying state and federal Capital Gains tax on the sale of their stock regardless of basis (i.e. IRC § 1042 exchange). It allows the seller to exchange the proceeds from the sale of stock to purchase stocks, bonds, notes or U.S. Domestic Securities (this includes, stocks, bonds or notes) that meet certain qualifications. Once the exchange is established and the owner maintains the exchange, upon death the seller receives a “stepped up basis” and the capital gains tax evaporates.
- The company receives a dollar for dollar annual deduction for every dollar’s worth of stock that is sold by the sellers. If the company buys $500,000 of stock, the company can realize a $500,000 tax deduction. This is realized on the tax return of the company as they pay for the stock, and is subject to certain limitations.
- The company can either be a “C” or an “S” Corporation to install an ESOP. There are some advantages and disadvantages to both structures, but ultimately, if the company is or becomes a “S” Corporation, and is 100% owned by the ESOP, the annual K-1 would then go to the ESOP, which is a State and Federal tax exempt trust, similar to a 401(k) and as such is no longer subject to State and Federal income tax. This makes the company “tax free” and can more than double cash flow, and places the company in an optimal operating platform. As they compete with other market players that are paying tax, they have a distinct financial advantage which they can leverage into getting jobs at lower prices and still maintain margins.
- Another advantage of an ESOP is that the sellers can maintain control of the company even after the sale, as the ESOP has a Trustee that can be “directed”. This directed Trustee is directed either directly by the Board, or by the ESOP Administrative Committee, which is a Board committee. Effectively, the day-to-day control of the business doesn’t change and control can be left with the selling owners until they receive all their money or control can be placed with whomever they direct, such as senior management, etc.
Rewarding Employees with Market Shares
In addition to the above tax benefits, offering employees company ownership helps establishes professionalism and lines up owner goals with that of the employees. First-rate job candidates are attracted to companies that they know appreciate and reward their workers. Also, when a company shows it is interested in helping its workers succeed, it’s much more likely to retain its key employees. More so is the fact that the employees will strive to make the company succeed because they will want their market shares to be worth more money.
It’s also with an ESOP that an employer can reward its workers without draining its cash flow. Instead of giving cash bonuses, market shares are issued. Furthermore, an ESOP comes with the benefit of the employer being able to strictly decide who gets the market shares and how much. With fringe benefits, specific selection is mostly prohibited.
Next Steps
Although an ESOP has significant tax advantages and provides a mechanism for current owners to exit the business at fair market value, the process requires the work of an experienced team in the creation and execution of an ESOP. Because of this, you should work with a group of advisors experienced in implementing an ESOP.
This article was originally published in Valuation Viewpoint, February 2015.
Footnote
1Business Transition Advisors
Hidden Tax Traps Commonly Unearthed During Business Due Diligence
There are number of aspects that always get immediate attention when a business is analyzed for an acquisition. These are standard elements that are practically on a default checklist of any decent due diligence team.
A number of tax traps become apparent during the process for those professionals who knows how to look for these issues. This article seeks to identify a few that commonly show up during the due diligence process of acquiring the equity of a company.
The Missing Withholding
Any business that has employees has a payroll has a tax withholding liability, and many business farm this accounting work out to third parties. It’s mundane work that has little to do with core functions of most businesses, so third party accounting firms and offices get a lot of the workload. Unfortunately, they also get lump sums of money to pay for the withholding requirements as well on a monthly basis. And those pots of cash can often be very attractive to a character who wants to shave off a few percentages of the total or “lose” a monthly payment altogether. Because the IRS and tax agencies get so much withholding on a regular basis, a shorted payment or a missing amount can be overlooked for a while. However, eventually the IRS and tax agencies reconcile amounts owed and eventually target a business for an audit. Should a business be acquired before that audit happens, the review can be a painful hit of withholding due, compounded tax interest, and tax penalties.
Business Deductions Not Matching Expenses
Small businesses are notorious for having very inflated tax-deductible expenses that tend to disappear when the real accounting books are reviewed. No surprise, the IRS often casts a very pessimistic eye on small businesses as a result. If a company has a history of inflated tax returns it’s not going to become apparent unless so those same returns are examined in direct comparison to the real accounting records. Any appraiser who is aware of this relationship knows to ask for both and looks to tie out specific expense numbers accordingly. A failure to look for this kind of baggage means the new owner could be stuck with tax penalties or worse, a tax investigation for tax evasion.
Inflated Depreciation Landmines
Businesses are allowed to depreciate large equipment and asset purchases, but they need to be depreciated over time. Incorrect calculations on tax filings can trigger audits and corrections. However, like other tax issues, the tax agency correction can be years after the fact. These landmines often get missed unless someone actually looks at the depreciation figures filed and checks on their validity.
In Summary
Tax traps don’t have to be discovered the hard way. A targeted due diligence assignment will catch these issues, specifically looking for tax problems when examining liabilities. Don’t consider an acquisition of the equity of a business without knowing the tax records have been specifically reviewed.
This article was originally published in Valuation Viewpoint, April 2015.
A Watched Pot Never Boils: Still Waiting on Margin Relief
As expected after lackluster job gains in May, the Federal Open Market Committee declined to raise the Fed Funds target at the latest policy meeting on June 15th. While the majority of policymakers still expect the Fed to boost rates twice before the end of this year, the number of officials who forecast just one rate hike increased from one to six from the previous forecasting round in March. In addition, Fed officials lowered their expectations for future years, now expecting the fed funds rate to rise to 1.6% by year-end 2017, down from the 1.9% estimate in March, and 2.4% in 2018, down from the previous estimate of 3.0%. During a press briefing on June 3rd, members of the Economic Advisory Committee of the American Bankers Association said they still expect the Fed to boost rates twice before the end of this year, but after years of speculation regarding timing of rate increases, when that will happen remains anyone’s best guess. The bond market never believed the forecasts.
Rate increases are long awaited by community bankers as banks are facing profitability challenges. Net interest margins continue to compress and loan growth remains stymied by intense competition for high quality loans. Margin relief remains out of the grasp of most community banks, absent further rate hikes beyond the December 2015 hike. After rebounding modestly in the third and fourth quarter of 2015, the median net interest margin of community banks (defined as those with assets between $100 million and $5 billion), ticked down modestly in the first quarter of 2016 as intense competition for quality loans drove down loan yields and the decline in long-term rates put downward pressure on securities’ yields (Charts 1 and 2).
Overall, median net interest income continued to increase as growth in loans offset margin compression, but intense competition raises concerns over how much credit standards have been relaxed to drive loan growth.
Although the majority of banks’ balance sheets are poised to take advantage of rising rates, the lift to net interest margins is dependent on asset yields rising faster than the cost of funds (Chart 3).
While deposits costs essentially reached a floor several quarters ago, data suggests the threat of rising deposit rates may limit margin expansion in a rising rate environment. As shown in Chart 4, the percentage of banks reporting quarter-over-quarter increases in the cost of interest bearing deposits has been trending upward over the last eight quarters. In a higher rate environment, customers are more likely to shop around for higher rates. The increase observed in interest bearing accounts could reflect the fact that higher loan growth has compelled some banks to raise rates or perhaps an effort to build goodwill with customers in anticipation of rising rates and increased rate sensitivity. For banks with asset sensitive balance sheets, the benefit of rising interest rates will be greater the stickier low cost deposits are.
While net interest margin is a key metric for banks, focusing on other drivers of profitability is one way to combat margin compression in the face of further delays in interest rate hikes or upward pressure on deposit costs. Consider the following:
- Look for opportunities to grow non-interest income. One strategic option may be to expand bank offerings into non-traditional bank business lines that are less capital intensive and offer prospects for non-interest income growth such as acquisitions or partnerships with insurance, wealth management, specialty finance, and/or financial technology companies. FinTech’s consumer-focused technology and ability to quickly adapt can pair well with community banks who can provide an established customer base and knowledge of the regulatory process and environment. For more information, we recently wrote an article on why current market conditions may be ripe for FinTech partnerships.
- Leverage technology to curb efficiency ratios. Compliance and regulatory costs continue to rise and represent a bigger burden to community banks who lack the scale to accommodate these expenses in comparison to their larger peers. A recent article from American Banker included data presented by Chris Nichols, chief strategy officer of CenterState Banks, at a recent fintech conference in Atlanta that shows why engaging customers digitally is more efficient. Furthermore, a recent article published on SNL highlights how, in some regards, community banks can be quicker to adopt new technology than larger peers. While size may limit what projects are feasible for community banks, agility has its benefits.
- Increase scale. Create economies of scale and improve profitability organically or by merging with a larger company. Organic loan growth is an obvious cure to the margin blues, but must be achieved while maintaining credit quality and holding adequate capital. M&A remains a classic solution to revenue headwinds in a mature industry, and bank acquirers can potentially have savings beyond expense synergies with some NIM relief resulting from potential accretion income on the acquired assets, which are marked to fair value at acquisition.
Mercer Capital has a long history of working with banks and helping to solve complex problems ranging from valuation issues to considering different strategic options. If you would like to discuss your bank’s unique situation in confidence, feel free to contact us.
10 Ideas for Experts When Preparing for Depositions
An expert deposition is a formal proceeding. I can only speak from my own experience in having my deposition taken and in attending a number of depositions of other experts or parties to various matters. There is one thing that is true in the majority of expert depositions I have seen. The opposing attorney prepares for the deposition. In one deposition, the opposing counsel had his outline of questions to ask me contained in a three-ring notebook. I couldn’t be sure, but it appeared to have more than 50 pages of typewritten questions.
If opposing counsel is going to prepare for your deposition as an expert witness, it is equally critical that you prepare as well. Preparation for an expert deposition entails a number of activities:
- Do good work all the time. In some cases, experts are retained to prepare business valuation, economic damages, or financial forensic reports in the context of litigation. In those cases, it is critical to do good work, to support each opinion, to be sure that the math checks out, and to be certain that a report is internally consistent and consistent with an expert’s prior work, writings and speaking. However, your first deposition may not arise because you were retained as an expert. You may be deposed on a report that you prepared in the ordinary course of business. This could happen with a report prepared for tax purposes, for a buy-sell agreement, for an ESOP, or for some other purpose. In those cases, you don’t get a chance to “do the report over” for the litigation. You must live with the report you signed long ago. Remember to do good work all the time.
- Read your expert report. Experts write reports that summarize their opinions and provide the basis, support and rationale for their opinions. In business valuation and economic damages matters, expert reports can be of considerable length, perhaps 100, 200, 300 or more pages. In many cases, considerable time will have passed between the submission of an expert’s report and his or her deposition. This makes it essential to read the report carefully, and from cover to cover, including all boilerplate. An expert has to be familiar with what is in his report as well as what is not in the report.
- Review the entire file. An expert’s file will contain many documents, maybe hundreds or even many thousands of them. The expert must review the file to know what is there. In large litigations with literally thousands of documents, it may be necessary for another professional to review documents. If so, the expert then must review the key documents identified in that review. Not every document will have been relied upon, but you have to be familiar with the key documents supporting your opinion. When working on litigation matters, I routinely accumulate the major documents that will be referenced in a spiral-bound notebook. Depending on the circumstances, I may take my own notebook to deposition or trial because I am familiar with the book and the documents. In any event, I review those documents carefully, often multiple times.
- Prepare a list of key names, dates or other key information you do not want to forget. I typically prepare a list that includes the name(s) of our clients, all the attorneys we have worked with on our side, opposing counsel, opposing experts, and key dates or documents I may want for instant recall. There are no opinions on this list, just names and facts. You will only forget the name of your client one time – when the client is sitting in your deposition – before you initiate this habit.
- Respond fully to any subpoena for your file. Most expert depositions are noticed with subpoena duces tecum, which is a request for the expert’s presence at a deposition as well as for documentary evidence from his files. In our shop, subpoenas are provided to our in-house counsel, and she reviews the file in order to be sure that we comply. This means that experts shouldn’t put things into their files that they don’t want someone else to see. Opposing counsel will ask the expert whether he or she has complied with the subpoena.
- Meet with counsel to prepare for the deposition. This meeting (or meetings) provides a deadline for the expert in doing the preparations noted above. Counsel will usually have some idea of how opposing counsel will approach your deposition, and the themes he or she thinks you can expect to see. Counsel can give you information about the style of the opposing counsel who will be taking the deposition. It is a good idea to do an internet search and read biographical information about opposing counsel.
- Know your objective for the deposition. Some experts go into depositions loaded, as it were, for bear. They want to try to “win” the deposition by proving their opinions zealously.
An attorney told me long ago to avoid the temptation of trying to “win” a deposition. Counsel observed that the rules for depositions and trials as they relate to experts were written by attorneys and conducted by attorneys. Counsel then said something I’ve not forgotten: “Chris, your objective in this deposition is not to win it. Your objective is not to lose.” - Discuss your approach to comments about opposing expert reports with counsel. In some cases, counsel will want you to be prepared to comment on the report of one or more other experts. If so, outline your comments in advance so that you are organized when asked for your opinions regarding the report(s). In other cases, counsel may have retained another expert to handle rebuttal, and you would not be expected to comment, even if asked by opposing counsel. It is okay not to have opinions about other experts.
- Talk with counsel about local rules applicable to depositions. In some jurisdictions, experts are not allowed to talk with counsel for their side during a deposition. I recall one arbitration in which I testified where this rule was in place. As we reached the end of the day during my testimony, opposing counsel opened a report that I had issued some years before and read a portion that appeared to impeach my testimony. The problem was, I couldn’t remember the details of that earlier report on the spot. Fortunately, the day ended at that point. The arbitration resumed three weeks later, and I was unable to talk with counsel about the testimony at all during that period. However, I did pull a copy of the report that opposing counsel had read from. Counsel had clearly taken his quote out of context. I brought a copy of the report when I returned to the stand and asked for time to respond to the final question from the previous session. With permission from my earlier client, I read the portion of the report that counsel had tried to trip me with, but I read that portion in appropriate context. In that light, there was no impeachment. Indeed, the earlier report supported my testimony in the arbitration. That’s a long story, but the point is, know the rules.
- Get a good night’s sleep the night before your deposition. Depositions can be long and grueling. In some jurisdictions, they are limited to seven hours of deposition time. Seven hours, though, can be a long time, so it is good to be rested. For multi-day depositions, getting good rest is critical. It takes a great deal of mental focus and physical energy to give a good deposition. So, take care of yourself as a key part of preparing.
Wrapping Up
The central idea behind preparing for an expert deposition is to be sure that the expert is as ready as possible. Preparation is essential for experts to give good depositions.
Mercer Capital brings analytical resources and over 35 years of experience to the field of dispute analysis and litigation support. We assist our clients through the entire dispute process by providing initial consultation and analysis, as well as testimony and trial support. Please contact us to discuss your needs in confidence.
Wisniewski v. Walsh and the Bad Behavior (Marketability) Discount in New Jersey
Peter Mahler reported on a recent New Jersey appellate level case focusing on the application of a 25% marketability discount in a statutory fair value determination in his New York Business Divorce blog. The New Jersey Appellate Division issued an unpublished decision in Wisniewski v. Walsh, 2015 N.J. Super. Unpub. LEXIS 3001 [App. Div. Dec. 24, 2015]. The case is interesting in that it attempts to determine a marketability discount in relationship to the “bad behavior” of a selling shareholder.
The Wisniewski case has a long and tortuous history dating back to the mid-1990s. The case involves a successful family-owned trucking business founded by the father in 1952. Three siblings, Frank, Norbert, and Patricia owned the business equally following the father’s death. Frank assumed leadership of the business by 1973, and Norbert and Patricia’s husband also worked in the business. In 1992, Frank was sentenced to a prison term, leaving Norbert in charge of the business. Norbert stopped paying certain bills that had customarily been paid for Patricia and her husband, and diverted certain revenues from a business owned by Patricia to one in which she had no interest. In addition, even after Frank’s return, Norbert tried to exclude Patricia from a real estate deal that she ordinarily would have participated in.
The litigation began around 1995. Interestingly, the trial court held that Norbert was an oppressing shareholder, and none of the parties contested that finding or the court’s later decision that Norbert should be bought out. Hold that thought, because it becomes a key factor in the court’s determination of statutory fair value. I can only call the concluded marketability discount in the matter a “bad behavior” discount.
The Valuations
The court’s valuation was determined through two trials in 2007 and 2008. Roger Grabowski of Duff & Phelps was retained by Frank and Patricia (the company) and Gary Trugman of Trugman Valuation Associates was retained by Norbert. I have been unable to locate the trial court’s decision in that matter, and so I can only write about the valuation from the perspective of the appellate decision.
The trial court issued opinions in October 2007 and July 2008, which explained how and why the trial judge concluded that the fair market value of Norbert’s interest was about $32.2 million. We learn in the appellate decision that the trial court applied a separate 15% “key man” discount “to account for Frank’s importance.” If the conclusion was $32.2 million for Norbert’s interest, then the value before the discount was about $37.9 million ($32.2 / (1 – 15%)). No marketability discount was applied by the trial court. This would place an implied value of the trucking business at about $114 million.
We do not know the conclusions of either Grabowski or Trugman that were considered by the trial court. According to the appellate decision, the trial judge found Trugman’s discounted cash flow analysis more credible than Grabowski’s market approach. However, the trial judge used assumptions suggested by Grabowski for certain normalizing adjustments to operating expenses for Trugman’s discounted cash flow method.
The Initial Appeals and Application of a Marketability Discount
There was an appeal of the trial court’s decisions in 2007 and 2008. The appellate court, in a decision issued April 2, 2013, held in part that “the trial judge erred in not applying a marketability discount” and remanded “for the fixing and application of a marketability discount to the extent not already subsumed in the judge’s findings…”
The 2015 appellate decision states regarding the remand to the trial court in 2013:
On remand, Judge Hector R. Velazquez briefly contemplated that the record might need to be supplemented with expert testimony pertaining to the narrow issues presented, but ultimately decided against it; none of the parties quarrel with that approach now. Left to resolve the matter on the record developed after the first remand, Judge Velazquez heard oral argument and issued an opinion on October 16, 2013, concluding that a discount for marketability was not embedded in the prior valuation and that a discount of twenty-five percent should be applied. He entered a second amended final judgment to that effect on January 7, 2014.
And of course the parties appealed and cross-appealed.
The Final (?) Appeal
The appellate decision was issued December 24, 2015. To cut to the chase, the appellate court found “no merit” in the appeal and affirmed Judge Velazquez’ 2014 opinion. The appellate decision recounts that Norbert was found to be an oppressing shareholder. This turns out to be an important point, because in New Jersey, the marketability discount is typically reserved for “extraordinary circumstances” involving inequitable or coercive conduct on the part of the seller, who is Norbert in this case.
The issue on appeal was whether the trial judge had erred in application of the 25% marketability discount because marketability may already have been considered in Trugman’s DCF analysis. The key facts relating to the marketability discount question, as best I can glean them from the 2015 appellate decision, include:
- Trugman’s Discount Rate Risk Factors. Trugman used a build-up method to develop his discount rate for his DCF analysis. The company-specific risk factors in the build-up included key man risk regarding Frank’s perceived management ability, customer relationships, customer concentrations, the closely-held nature of the trucking business, and undercapitalization. Trugman made two important additional points regarding the marketability of the business. He stated that the company is profitable, attractive, and marketable and that the company made substantial distributions on a regular basis that should offset any risks during a normal marketing period (of six to nine months). Trugman did not apply a marketability discount (or assumed it to be zero), noting that the discount rate was the “right place” to consider these risks. Recall also that the trial judge in the valuation trial had already applied a separate 15% key man discount after accepting Trugman’s DCF (as modified by Grabowski’s expense assumptions).
- Grabowski’s Marketability Factors. Grabowski had applied a marketability discount of 35% in his valuation. Judge Velaquez concluded that Grabowski and Trugman considered several of the same factors in reaching their discount rate and marketability discount, respectively. Grabowski’s marketability factors included heavy dependence on Frank as a key man, customer concentrations in the retail industry, the company’s size and closely held nature, its profitability, and the anticipated holding period. Grabowski per the court noted that his marketability discount was also “consistent with guidance from applicable [minority] studies and legal precedent.” Grabowski viewed the company as having a relative lack of marketability.
The appellate court notes the trial court’s decision:
Judge Velazquez concluded, based on that record, that although Trugman and Grabowski had considered several of the same factors in formulating their discount rate and marketability discount, respectively, that Trugman had made no adjustment for marketability in building up his discount rate — in short, the judge concluded that no marketability discount was embedded in his evaluation. The judge rejected both expert opinions, moreover, in selecting an appropriate discount, and fixed the rate at twenty-five percent.
It gets more interesting for valuation professionals. The appellate court reasoned that a marketability discount was necessary because of Norbert’s bad behavior towards his fellow shareholders (there was never a finding that his behavior harmed the company in any way).
The second trial judge rejected application of a marketability discount following our first remand. He considered Frank’s criminal conviction, a factor Grabowski suggested would reduce the company’s value, but noted that while the company endured a lull during Frank’s absence, it resumed its growth on his return with no apparent hindrance attributable of his criminal history. Neither that nor any other circumstance, the trial judge at the time reasoned, justified application of the discount.
Although the reasoning was sound for the most part, we reversed because the judge at the time failed to consider that Norbert’s oppressive conduct had harmed his fellow shareholders and necessitated the forced buyout…[paraphrasing the New Jersey Supreme Court in Balsamides under similar circumstances]. …[A]bsent the application of a discount, the oppressing shareholder would receive a windfall, leaving the innocent party to shoulder the entire burden of the asset’s illiquidity in any future sale. Equity demanded application of the discount, or else the statute would create an incentive for oppressive behavior. (emphasis added)
The appellate decision restated some of Judge Velazquez’ logic in making the following point:
On remand, Judge Velazquez determined on the existing record that a marketability discount was not already embedded in the valuation. He recounted that the discount rate Trugman build up included a size premium and an adjustment for a series of company-specific factors including the company’s reliance on Frank, its customer concentration in the retail industry, and high debt. Although Grabowski had considered similar factors in formulating his marketability discount, the judge concluded that Trugman had certainly “utilized them in a different way” than to adjust for any lack of illiquidity. (emphasis added)
As a business appraiser examining this case from business and valuation perspectives, the economic logic for applying a 25% marketability discount by the court is considerably strained. If a group of risk factors are considered in the DCF method that lower value in the context of that method, it is difficult to see how their further consideration for the application of an additional marketability discount is not double-counting. However, the appellate court addressed this issue as follows:
Grabowski analyzed a handful of the same factors, among many others, in formulating his marketability discount, but, in contrast, focused on the inherent liquidity of closely-held companies and the anticipated holding period for a rational investor in this company. There was no clear indication in the record, then, that Trugman and Grabowski had accounted for the same risks relative to marketability, such that application of a separate marketability discount would cause double counting. (emphasis added)
In the light of day, it would seem that there is double-counting to the extent that both appraisers considered the same factors that would reduce each of their values, even if they used those factors in different ways. And note that the original trial judge had already allowed for a key man discount of 15%, which occurred, obviously, after the experts had testified and provided their evidence. This discount, which certainly pertains to the “marketability” of a business, is substantial discount that had already been considered in the trial court’s conclusion. It just wasn’t labeled as a marketability discount.
The Marketability (Bad Behavior) Discount
What it seems that we have in Wisniewski v. Walsh is a situation that is a business appraiser’s nightmare. At the original valuation trial, the court held that there should be no marketability discount. That was appealed. The appellate court then remanded back to the trial court for the application of a marketability discount to the extent that one was not already embedded in Trugman’s DCF analysis. The trial judge then, based on logic outlined above, concluded that no marketability discount was embedded in the DCF analysis and that the appropriate punitive marketability discount was 25%. This was appealed, and in this current appellate decision, the trial court’s marketability discount is affirmed.
I have no problem if a court of equity wants to penalize a party for oppressive behavior to other shareholders. That is certainly one of the jobs that courts of equity are called upon to do in appropriate circumstances. And that discount can be zero, 10%, 20%, 25% or anything the court determines is appropriate in a specific case.
I do have a problem with a court making an “equitable” decision and then trying to justify that decision based on parsing of valuation evidence.
Assume an appraiser provided a valuation in another New Jersey statutory fair value matter involving the oppressive behavior of a selling shareholder named John. Let’s say that the value conclusion for the interest before the application of a “bad behavior discount” was $100 per share. The appraiser then concludes as follows:
Based on my analysis of John’s bad behavior, I believe that a marketability (bad behavior) discount of 20% is appropriate.
The appraiser might be thrown out of court. His opinion would certainly be given no weight. How then, is an appraiser to respond when the ultimate marketability, or bad behavior, discount will be determined by a judge who is responding to the equities of a matter? After all, valuation evidence pertaining to the marketability of a company or of an interest in a company has absolutely nothing to do with the behavior of any shareholder.
Let’s look further at the appellate decision and we will see that the trial court’s conclusion has nothing to do with the economics of the trucking business in Wisniewski.
The Court noted in Balsamides, supra, 160 N.J. at 377, 379, that marketability discounts for closely-held companies frequently ranged from thirty to forty percent, though the Court explained that selection of an appropriate rate, and the applicability of a rate in the first place, must always be responsive to the equities of a given matter.
Judge Velazquez properly rejected from the outset Norbert’s suggestion that the marketability discount be set at zero percent. Indeed, we had already decided that a marketability discount was required and Judge Velazquez was bound by our mandate.
After carefully canvassing the record, Judge Velazquez came to the conclusion that selecting a thirty to forty percent rate as described in Balsamides would excessively punish Norbert, the oppressing shareholder, beyond what the equities of this case required and, in light of the company’s past financial success and anticipated continued future growth, stood to “give the remaining shareholders a significant windfall.”
In choosing an appropriate marketability discount after rejecting portions of both expert opinions on the issue, Judge Velazquez acknowledged our Supreme Court’s advice in Balsamides that such discounts frequently ranged from thirty to forty percent, but noted that other studies supported a broader range, reaching as low as twenty percent. He alluded to authorities from other jurisdictions approving the application of a wide range of discounts, sensitive to the equities of each individual case, and to our decision in Cap City Products Co. v. Louriero, 332 N.J. Super. 499, 501, 505-07 (App. Div. 2000), allowing application of a twenty-five percent discount. (emphasis added)
If trial courts determine marketability discounts as bad behavior discounts, there really is no way that business appraisers can provide meaningful information to a court. If the court’s concern is one of “the equities” in a matter rather than in determining the fair value or the fair market value of a business or interest in a business, then there is little that appraisers can do to help. In Wisniewski, the application of a marketability discount flowed, not from the lack of marketability of the trucking business, but from the bad behavior of Norbert. Neither Trugman nor Grabowski had a chance in that determination. All we can say is that the court’s ultimate conclusion for the bad behavior (marketability) discount fell within the range suggested by Trugman (0%) and Grabowski (35%) and had nothing to do with the relative marketability of the business at hand.
Peter Mahler’s Conclusion
Mahler concluded similarly in his blog post:
If you ask accredited business appraisers whether the determination of a marketability discount rate for the shares of a particular closely-held company should be based on case precedent involving other companies, I think the vast majority will answer “no.” I wrote a piece on that very subject last year, quoting from the IRS’s DLOM Job Aid and experts in the field. Yet cases such as Wisniewski point the other way, effectively encouraging advocates and judges to select a rate within a self-perpetuating, “established” range of case precedent based as much if not more on the “equities” of the case than the financial performance, prospects, and liquidity risks of the company being valued. It’s not for me to say whether appellate courts and legislatures should decide as a matter of policy to incorporate into fair value determinations equitable considerations based on the good or bad conduct and motives of the litigants toward one another. But I am saying that if that’s the way it’s going to be, there’s an associated cost in the form of greater indeterminacy in fair value adjudications which makes it harder for lawyers and valuation professionals to advise their clients and to reach buyout agreements before they ripen into litigation.
Readers can see the bad news in this appellate decision in Wisniewski. The good news, I guess, it that most statutory fair value cases do not involve bad behavior on the part of a selling shareholder.
Are Market Conditions Driving More FinTech Partnerships and M&A?
It has been an interesting few weeks for FinTech. Coming off recent years where both public and private FinTech markets were trending positively, the tail end of 2015 and the start to 2016 have been unique as performance has started to diverge. The performance of public FinTech companies has been relatively flat through the first quarter of 2016 (see Public Market Indicators on page 3 of the First Quarter 2016 FinTech newsletter), and signs of weakness have been observed in alternative/marketplace lending, as well as some of the more high profile FinTech companies that have gone public recently. The median return of the FinTech companies that IPO’d in 2015 was a decline of 16% since IPO (through 3/31/16). For perspective, Square, OnDeck, and Lending Club are each down significantly in 2016 (down 28%, 53%, and 64%, respectively from 1/1/2016 to 5/18/2016). Also, the broader technology IPO slowdown in late 2015 has continued into 2016 and no FinTech IPOs have occurred thus far in 2016.
However, optimism for FinTech still abounds, and the private markets continue to reflect that with robust investor interest and funding levels. In 2016, 334 FinTech companies raised a total of $6.7 billion in funding in the first quarter (compared to 171 companies raising $3.2 billion in the first quarter of 2015), and Ant Financial (Alibaba’s finance affiliate) completed an eye-popping $4.5 billion capital raise in April.
While the factors driving this divergence in performance between public and private markets are debatable, the divergence is unlikely to continue indefinitely. A less favorable public market and less attractive IPO market creates a more challenging exit environment for those “unicorns” and other private companies. Headwinds for the private markets could develop from more technology companies seeking IPOs and less cash flow from successful exits to fund the next round of private companies.
Consequently, other strategic and exit options beyond an IPO should be considered such as partnering with, acquiring, or selling to traditional incumbents (banks, insurers, and money managers). The potential for M&A and partnerships is even more likely in FinTech, particularly here in the US, due to the unique dynamics of the financial services industry including the resiliency of traditional incumbents and the regulatory landscape. For example, consider a few of the inherent advantages that traditional banks have over non-bank FinTech lenders:
- Better Access to Funding. Prior to 2016, the interest rate/funding environment was very favorable and limited the funding advantage that financial institutions have historically had relative to less regulated non-financial companies. However, the winds appear to be shifting somewhat as rates rose in late 2015, and funding availability for certain FinTech companies has tightened. For example, alternative lenders are dependent, to some extent, on institutional investors to provide funding and/or purchase loans generated on their platform, and a number have cited some decline in institutional investor interest.
- Banks Still Have Strong Customer Relationships. While certain niches of FinTech are enhanced by demand from consumers and businesses for new and innovative products and technology, presently, the traditional institutions still maintain the majority of customer relationships. As an example, the 2015 Small Business Credit Survey from the Federal Reserve noted that traditional banks are still the primary source for small business loans with only 20% of employer firms applying at an online lender. The satisfaction rate for online lenders was low (15% compared to 75% for small banks and 51% for large banks). The main reasons reported for dissatisfaction with online lenders was high interest rates and unfavorable repayment terms.
- Regulatory Scrutiny and Uncertainty related to FinTech. Both the Federal Reserve and the OCC have made recent announcements and comments about ways to regulate financial technology. In the online lending area specifically, regulatory scrutiny appears to be on the rise with the Treasury releasing a white paper discussing the potential oversight of marketplace lending and the CFPB signaling the potential to increase scrutiny in the area. The lack of a banking charter has also been cited as a potential weakness and has exposed certain alternative lenders to lawsuits in different states.
At the same time that FinTech companies are increasingly considering, or being forced to consider, strategic options beyond an IPO, traditional incumbents are starting to realize that they must develop a strategic plan that considers how to evolve, survive, and thrive as technology and financial services increasingly intersect. For example, a number of banks are looking to engage in discussions with FinTech companies. A recent survey from BankDirector noted that boards are focusing more on technology with 75% of respondents wanting to understand how technology can make the bank more efficient and 72% wanting to know how technology can improve the customer experience.
FinTech presents traditional financial institutions with a number of strategic options, but the most notable options include focusing on one or some combination of the following: building their own technology solutions, acquiring a FinTech company, or partnering with a FinTech company. One area where we have started to see more FinTech partnerships and M&A already start to play out is wealth management and the industry’s response to robo-advisory. Robo-advisers were noted by the CFA Institute as the FinTech innovation most likely to have the greatest impact on the financial services industry in the short-term (one year) and medium-term (five years). Consider the following announcements in this area over the last few years; on the acquisition front, BlackRock’s acquisition of FutureAdvisor in August 2015, Invesco’s acquisition of Jemstep, and Ally Financial’s acquisition of TradeKing in April 2016. On the partnering front, Motif and J.P. Morgan announced a partnership in October 2015, UBS announced a major partnership with SigFig in May 2016, and Betterment and Fidelity announced a partnership in October 2014. Community banks will also have an opportunity to enter the robo-advisory fray as Personal Capital announced a partnership with Alliance Partners that will allow over 200 community banks offer digital wealth advisory tools.
While we do not yet know which strategy will be most successful, discussions of whether to build, partner, or buy will increasingly be on the agenda of boards and executives of both financial institutions and FinTech companies for the next few years. The right combination of technology and financial services through either partnerships or M&A has significant potential to create value for both FinTech companies and traditional financial institutions. Any partnership or merger should be examined thoroughly to ensure that the right metrics are utilized to examine value creation and returns on investment.
Transactions and significant partnerships also have significant risks and potential issues will need to be discussed. For example, significant issues with M&A and potential partnerships can include: execution and cultural issues, shareholder dilution, whether the partnership is significant enough to create shareholder value and provide a return on investment, contingent liabilities, and regulatory pressures/issues. These issues must be balanced with the potential rewards, such as customer satisfaction/retention, shareholder value creation, and return on investment.
If you are interested in considering strategic options and potential partnerships for your financial institution or FinTech company, contact Mercer Capital. Financial institutions represent our largest industry focus for over thirty years. We have a deep bench with experience with both FinTech companies and traditional financial institutions (banks, asset managers, and insurance companies). This uniquely suits us to assist both as they explore partnerships and potential transactions.
Shaking Things Up: ARCC and ACAS Combine
On May 23, Ares Capital (ARCC) announced the acquisition of fellow business development company, or BDC, American Capital (ACAS) in a cash and stock deal valued at $4.0 billion. The deal is notable from several perspectives. First, the transaction brings closure to the ACAS saga. Second, the deal includes third-party support from ARCC’s management company. Finally, the transaction structure allowed ARCC to raise nearly $2.0 billion in new equity without diluting NAV per share, despite ARCC shares trading at an 8% discount to NAV prior to the announcement.
Culmination of the ACAS Experiment
Prior to the 2008 recession, ACAS was one of the two largest BDCs. The other, Allied Capital, was acquired by ARCC in 2010. As shown in Figure 1, ACAS’ share price was (literally) decimated during the recession, losing over 90% of its value during 2008 and 2009.
During 2011, ACAS elected to be taxed as a C corporation rather than a registered investment company, or RIC. No longer subject to RIC distribution requirements, ACAS embarked on an aggressive strategy of asset rationalization, debt reduction, and share repurchases. Having suspended dividend payments in 2010, reported NAV per share increased from $10.71 at the end of 2010 to $20.14 at March 31, 2016 (an annualized growth rate of 12.8%).
Over that period, the price/NAV ratio for the shares increased from 70.6% to 77.6%, resulting in a compound annual return for shareholders of 14.8% via a combination of growth in NAV and multiple expansion. The announced purchase price of $17.40 per share, an 11.4% premium to the May 20 closing price, brings the compound annual return up to 17.2%. As shown in Figure 2, the increase in NAV per share reflected not only undistributed operating earnings and asset gains, but also the accretive impact of share repurchases below NAV (cumulative impact of $3.19 per share). With shares trading at persistent discounts to NAV, ACAS repurchased nearly 35% of its outstanding float during the period.
In sum, the positive shareholder returns for ACAS over the period, which beat those of ARCC and its peer BDCs, is a reminder that growth is not the only route to generating shareholder returns. While the company’s investment portfolio shrunk nearly 40%, pursuit of the best risk-adjusted returns delivered a positive outcome for ACAS shareholders.
(I Get By) With a Little Help from My Friends…
The total reported transaction consideration of $17.40 per ACAS share includes $2.45 per share from the sale of the company’s American Capital Mortgage Management subsidiary prior to transaction close. Of the net purchase price of $14.95, ARCC is providing only $13.75, with the BDC’s external manager Ares Management (ARES) picking up the remaining $1.20 per ACAS share, or $275 million. In addition, ARES pledged to a management fee waiver of $10 million per quarter for the ten quarters following the transaction close. The waiver works out to approximately 0.725% of ACAS’ reported assets of $5.5 billion, or half of ARES’ base management fee of 1.45%. The present value of the fee waiver (at a 12% discount rate) is approximately $86 million, and will accrue to the benefit of both ARCC and ACAS shareholders.
The topic of BDC management fees has been the subject of much comment over the past few years. The transaction structure for this deal highlights the attractiveness of the anticipated management fee stream to ARES (as well as, potentially, other strategic benefits accruing to the broader Ares platform as a result of the transaction).
From the perspective of ARCC shareholders, the contribution by ARES represents approximately $0.65 per share of NAV accretion, and makes the economics of the transaction considerably more palatable. Relative to the pro forma investment portfolio of $13.2 billion, the prospective fee concession represents approximately 30 basis points of incremental return on assets and 55 basis points of incremental return on equity.
Unlocking Incremental Capital
New share issuance is the only sustainable growth mechanism available to BDCs. With share prices mired at discounts to NAV for almost two years, BDCs have been generally been unable to issue new shares absent shareholder authorization, resulting in stagnant balance sheets given leverage restrictions and a statutory requirement to distribute at least 90% of taxable income as RICs. With depository institutions less inclined – or able – to make the sort of leveraged loans that BDCs specialize in, the perceived opportunities for BDCs are potentially substantial, but without access to fresh capital, BDCs have been unable to capitalize.
Prior to the transaction announcement, ARCC shares traded at 92% of NAV, compared to 78% for ACAS. ARCC shareholders would likely have been disinclined to approve a dilutive issuance of 110.8 million shares (which would have resulted in a dilutive impact of $0.34 per share). However, since the shares were issued in exchange for ACAS shares trading at a yet deeper discount, the issuance looks to be potentially accretive to NAV per share. (ACAS management indicated that it may take a couple quarters for NAV per share accretion to be realized).
With no obvious triggers for share prices to resume trading at premiums to NAV beyond a pick-up in the economy and a corresponding narrowing of credit spreads, acquisitions like this may be the best available strategy for more favored BDCs to unlock incremental capital and generate balance sheet growth.
Conclusion
At the close of trading on the first day following the announcement, market response to the transaction has been uninspiring, with ARCC shares trading down 2.4%, and ACAS shares closing at $15.72 per share, or nearly 10% below the nominal deal value of $17.40 per share. Whether this reflects uncertainty regarding the deal actually closing or a lack of enthusiasm for ARCC shares as currency, investors seem unimpressed thus far. A cynic might point out that ARES shareholders (up $0.02) seem unfazed, suggesting that the value of the incremental management fee stream outweighs the deal contribution and prospective fee concession.
The Ares management team has proven adept at managing through various credit cycles and has the experience of folding in the substantial Allied acquisition in 2010. If this deal closes, the pro forma company will be in a class of its own as measured by size, at approximately twice the size of the next largest BDC. Whether the envisioned benefits of scale will accrue to the ARCC shareholders remains to be seen.
Valuation Expertise: Necessary Chapter 11 Process Navigation
This article was originally published in the October 2014 issue of ABJ Journal.
Chapter 11 reorganization affords a financially distressed or insolvent company an opportunity to restructure its liabilities and emerge as a sustainable going concern. Once a petition for Chapter 11 is filed with the bankruptcy court, the company usually undertakes a strategic review of its operations, including opportunities to shed assets or even lines of businesses. During the reorganization proceeding, stakeholders, including creditors and equity holders, negotiate and litigate to establish economic interests in the emerging entity. The Chapter 11 reorganization process concludes when the bankruptcy court confirms a reorganization plan which specifies a reorganization value and which reflects the agreed upon strategic direction and capital structure of the emerging entity.
In addition to fulfilling technical requirements of the bankruptcy code and providing adequate disclosure, two characteristics of a reorganization plan are germane from a valuation perspective:1
- The plan should demonstrate that the economic outcomes for the consenting stakeholders are superior under the Chapter 11 proceeding compared to a Chapter 7 proceeding, which provides for a liquidation of the business.
- Upon confirmation by the bankruptcy court, the plan will not likely result in liquidation or further reorganization.
Within this context, valuation specialists can provide useful financial advice in order to:
- Establish the value of the business under a Chapter 7 liquidation premise.
- Measure the reorganization value of a business, which oulines both the haircuts required of pre-bankruptcy stakeholders and the capital structure of the emerging entity. A reorganization plan confirmed by a bankruptcy court establishes a reorganization value that exceeds the value of the company under a liquidation premise.
- Demonstrate the viability of the emerging entity’s proposed capital structure, including debt amounts and terms given the stream of cash-flows that can be reasonably expected from the business.
Liquidation Value
The value of a business under the liquidation premise contemplates a sale of the company’s assets within a short period. Inadequate time to place the assets in the open market means that the price obtained is usually lower than the fair market value.
In general, the discount from fair market value implied by the price obtainable under a liquidation premise is directly related to the liquidity of an asset. Accordingly, valuation analysts often segregate the assets of the petitioner company into several categories based upon the ease of disposal. Liquidation value is estimated for each category by referencing available discount benchmarks. For example, no haircut would apply to cash and equivalents while real estate holdings would likely incur potentially significant discounts, which could be estimated by analyzing the prices commanded by comparable properties under a similarly distressed sale scenario.
Reorganization Value
ASC 852 defines reorganization value as:2
“The value attributable to the reconstituted entity, as well as the expected net realizable value of those assets that will be disposed of before reconstitution occurs. This value is viewed as the value of the entity before considering liabilities and approximates the amount a willing buyer would pay for the assets of the entity immediately after restructuring.”
Reorganization value is generally understood to be the value of the entity that emerges from the bankruptcy proceeding under a going concern premise of value. Typically, the largest element of the reorganization value is the business enterprise value of the emerging entity. Reorganization plans primarily make use of the discounted cash-flow (DCF) method under the income approach to measure the business enterprise value of the emerging entity. The DCF method estimates the net present value of future cash-flows that the emerging entity is expected to generate. Implementing the discounted cash-flow methodology requires three basic elements:
- Forecast of Expected Future Cash-flows. Guidance from management can be critical in developing a supportable cash-flow forecast. Generally, valuation specialists develop cash-flow forecasts for discrete periods that may range from three to ten years. Conceptually, one would forecast discrete cash-flows for as many periods as necessary until a stabilized cash-flow stream can be anticipated. Due to the opportunity to make broad strategic changes as part of the reorganization process, cash-flows from the emerging entity must be projected for the period when the company expects to execute its restructuring and transition plans. Major drivers of the cash-flow forecast include projected revenue, gross margins, operating costs and capital expenditure requirements. Historical experience of the petitioner company, as well as information from publicly traded companies operating in similar lines of business can provide reference points to evaluate each element of the cash-flow forecast.
- Terminal Value. The terminal value captures the value of all cash-flows beyond the discrete forecast period. Terminal value is typically determined by capitalizing cash-flow at the end of the forecast period, based on assumptions about long-term cash-flow growth rate and the discount rate. In some cases, the terminal value may be estimated through the application of curr ent or projected market multiples.
- Discount Rate. The discount rate is used to estimate the present value of the forecasted cash-flows. Valuation analysts develop a suitable discount rate using assumptions about the costs of equity and debt capital, and the capital structure of the emerging entity. Costs of equity capital are usually estimated by utilizing a build-up method that uses the long-term risk-free rate, equity premia, and other industry or company-specific factors as inputs. The cost of debt capital and the likely capital structure may be based on benchmark rates on similar issues and the structures of comparable companies. Overall, the discount rate should reasonably reflect the business and financial risks associated with the expected cash-flows of the emerging entity.
The sum of the present values of all the forecasted cash-flows, including discrete period cash-flows and the terminal value, provides an indication of the business enterprise value of the emerging entity for a specific set of forecast assumptions. The reorganization value is the sum of the expected business enterprise value of the emerging entity, plus proceeds from the sale or other disposal of assets during the reorganization, if any. During the reorganization proceeding, different stakeholders may independently develop distinct estimates of the reorganization value to facilitate negotiations or litigations. The confirmed reorganization plan, however, reflects the terms agreed upon by the consenting stakeholders and specifies either a single range of reorganization values or a single point estimate.
Bankruptcy courts may permit certain post petition liabilities to facilitate the operation of the petitioning business during the reorganization process. In conjunction with the reorganization plan, the courts also approve the amounts of allowed claims or interests for the stakeholders (creditors or equity holders) in the restructuring entity. The reorganization value is the value of the total assets of the emerging entity and represents all of the resources available to meet the post petition liabilities, and allowed claims and interests called for in the confirmed reorganization plan.
Cash-Flow Test
In principle, a confirmed reorganization plan should not lead to a liquidation or further restructuring in the foreseeable future. A cash-flow test evaluates the viability of a reorganization plan following the conclusion of the restructuring under Chapter 11 protection.
The first step in conducting the cash-flow test is to identify the cash-flows that underpin the reorganization plan. Conceptually, these cash-flows are available to service all the obligations of the emerging entity. As a matter of practice, since the reorganization value is usually developed using the DCF method, establishing the appropriate stream of cash-flows is often straightforward. Valuation analysts then need to model the negotiated or litigated terms attributable to the creditors of the emerging entity. In practice, this involves projecting interest and principal payments to the creditors, including any amounts due to providers of short term, working capital facilities.
Finally, the cash-flow test also documents the impact of the net cash-flows on the balance sheet of the emerging entity. This entails modeling changes in the asset base of the company as portions of the expected cash-flows are invested in working capital and capital equipment, as well as changes in the debt obligations of and equity interests in the company as the remaining cash-flows are disbursed to the capital providers. A reorganization plan is generally considered viable if such a detailed cash-flow model indicates solvent operations for the foreseeable future.
Conclusion
Managers of companies going through a Chapter 11 restructuring process need to juggle an extraordinary set of additional responsibilities — evaluating alternate strategies, implementing new and difficult business plans, and negotiating with various stakeholders — while continuing to operate the business. For this reason, it is common for a company that has filed for Chapter 11 to seek help from outside third party specialists to formulate a reorganization plan that can facilitate a successful navigation through the bankruptcy court. Valuation specialists can provide useful advice and perspective during the negotiation of the reorganization plan. The specialists can also help prepare the valuation and financial analysis necessary to satisfy the requirements for a reorganization plan to be confirmed by a bankruptcy court.
Endnotes
1 Accounting Standards Codification Topic 852, Reorganizations (“ASC 852”). ASC 852-05-8.
2 ASC 852-10-20
Time Will Tell: Diverging Perspectives on BDC Portfolio Values
We observed last spring that 2015 would likely mark a turning point in portfolio valuations with the degree of difficulty likely to increase during the year. With the Q4 earnings season for BDCs complete, we take an opportunity to check in on portfolio marks and market sentiment over the year. The key takeaway from the year is that the valuation perspectives of investors and portfolio managers began to diverge.
The following chart depicts our benchmark loan mark for the past three years. After the sharp decline in 3Q15, the fair value of the benchmark loan fell again in the fourth quarter, falling from 93.9% of principal to 92.6%.
As we have noted on numerous occasions, the fair value of actual loans is determined by a host of issue-specific factors in addition to the market-wide indicators captured in the benchmark loan. However, for broad portfolios of loans, it does provide a measure of sensitivity of fair value to changes in credit spreads.
For BDCs, the benchmark loan fair value has been correlated to investor sentiment regarding BDC portfolio values. The next chart compares the benchmark loan fair value to a price index of a group of the largest BDCs over the period. Since BDC balance sheets are levered, the sensitivity of BDC share prices to the value of loan portfolios is magnified.
Since fair value is intended to reflect a market participant perspective, one would expect portfolio marks and investor perspectives to reconcile over time. However, current BDC share prices imply an even more dim view of BDC portfolio asset values on the part of investors than that indicated by our benchmark loan index. This would seem to suggest one of two potential scenarios: (1) investors have over-reacted to the impact of credit-spread widening on loan portfolio values, or (2) investors have adopted a skeptical posture toward the underlying credit quality of BDC portfolios. We do not hazard a guess at this point as to which will prove to be the more accurate explanation.
Table 1 summarizes 2015 market returns for 18 of the largest BDCs.
Total returns were negative for 11 of the BDCs analyzed, with share prices declining for all but one. Falling share prices were attributable to lower NAVs (median decrease of 1.6%) and shifting investor sentiment, with price/NAV ratios posting a median decrease of 9.7% for the year.
On December 31, 2015 BDC balance sheets, reported portfolio fair values stood at 96.7% of amortized cost. Investors, however, seem to be marking the portfolios a bit lower, with the median price/NAV ratio for the group at 0.87x. Current dividend yields suggest that, at least for some names, the sustainability of current payouts is being questioned; beyond direct credit concerns, this may also be weighing on BDC share prices.
During the fourth quarter, the BDCs in Table 1 reported aggregate fair value writedowns of just over $1.0 billion, or 2.5% of beginning cost basis. As noted in Table 2, the writedowns for individual BDCs ranged from 7.7% for beleaguered TICC to 0.6% for tech-focused HTCG. Only one BDC, GBDC, reported a net writeup during the quarter.
It is interesting to note that the BDCs with the lowest marks at the beginning of the quarter took, on average, larger writedowns during the quarter than those with higher marks. The nine funds with the highest ratios of fair value to cost basis at September 30, 2015 (median: 100.1%) reported a median writedown of 2.1% during 4Q15, while the bottom half (funds with a median ratio of fair value to cost basis of 96.5%) reported a median writedown of 3.3% during the quarter.
Asset mix varies among the portfolios analyzed. For example, significant unrealized gains on equity positions within a portfolio can have a material effect on the overall portfolio mark. As shown in Table 3, non-preferred equity positions for industry leader ARCC accounted for just 4.7% of the total portfolio at amortized cost. However, ARCC reported fair value of that portion of the portfolio at nearly 1.5x cost, for a total unrealized gain of over $200 million, which raised the overall effective mark on the portfolio from 96.6% to 99.0% of amortized cost.
If 2015 was the year of increasing degree of valuation difficulty, perhaps 2016 will be the year in which we learn whether portfolio managers have been able to stick their valuation landings, or if portfolio marks will be subject to continuing market skepticism in coming quarters. In the end, the market perspective wins – BDC share prices will either recover to levels consistent with December 31, 2015 marks or the portfolio marks will trend toward the market-implied levels. Time will tell.
Community Bank Stress Testing: What You Need to Know
While there is no legal requirement for community banks to perform stress tests, recent regulatory commentary suggests that community banks should be developing and implementing some form of stress testing on at least an annual basis.
The benefits of stress testing include enhancing strategic decisions; improving risk management and capital planning; and enhancing the value of the bank. However, community bank stress testing can be a complex exercise for a bank to undertake itself. There are a variety of potential stress testing methods and economic scenarios for the bank to consider when setting up their test. In addition, the qualitative, written support for the test and its results is often as important as the results themselves. For all of these reasons, it is important that banks begin building their stress testing expertise sooner rather than later.
Whether you are considering performing the test in-house or with outside assistance, this webinar will be of interest to you. This webinar:
- Covers the basics of community bank stress testing
- Reviews the economic scenarios published by the Federal Reserve
- Provides detail on the key steps to developing a sound community bank stress test
- Discusses how to analyze and act upon the outputs of your stress tests
Jay D. Wilson, CFA, ASA, CBA, presented this Mercer Capital sponsored webinar on March 1, 2016.
Session Archive
Community Bank Stress Testing: What You Need to Know
While there is no legal requirement for community banks to perform stress tests, recent regulatory commentary suggests that community banks should be developing and implementing some form of stress testing on at least an annual basis.
The benefits of stress testing include enhancing strategic decisions; improving risk management and capital planning; and enhancing the value of the bank. However, community bank stress testing can be a complex exercise for a bank to undertake itself. There are a variety of potential stress testing methods and economic scenarios for the bank to consider when setting up their test. In addition, the qualitative, written support for the test and its results is often as important as the results themselves. For all of these reasons, it is important that banks begin building their stress testing expertise sooner rather than later.
Whether you are considering performing the test in-house or with outside assistance, this webinar will be of interest to you. This complimentary webinar:
- Covers the basics of community bank stress testing
- Reviews the economic scenarios published by the Federal Reserve
- Provides detail on the key steps to developing a sound community bank stress test
- Discusses how to analyze and act upon the outputs of your stress tests
Jay D. Wilson, CFA, ASA, CBA, presented this Mercer Capital sponsored webinar on March 1, 2016.
Value Driver Considerations in Appraising Sports Franchises
Overview
The valuation of sports properties is often perceived as one of the most exciting areas of the appraisal profession. Sports business mandates constitute an amalgam of traditional valuation approaches applied to a specialized industry niche possessing its own distinct value drivers and considerations.
Sports property valuations may be required in a variety of situations, including:
- mergers and acquisitions;
- fairness opinions;
- business reorganizations;
- shareholder disputes;
- structuring shareholder agreements;
- income tax;
- estate planning;
- insolvency;
- commercial litigation; and
- marital disputes.
While the purchase and sale of professional sports franchises and arenas constitute the most visible event necessitating the participation of an experienced valuator, the foregoing situations also can give rise to valuation mandates. For example, in 1994, the Toronto Maple Leafs NHL franchise and the arena in which the team played, Maple Leaf Gardens, were owned by a public company, Maple Leaf Gardens, Limited, which was being taken private. Consequently, the fairness opinions that had been prepared in connection with this going-private transaction were called into question by The Public Guardian and Trustee of Ontario and the Attorney General for Ontario. A vigorous litigation ensued, in which the valuation professionals played a central role.
As is the case with many businesses, shareholder agreements can necessitate valuation mandates, as sports teams and arenas are often owned by numerous individuals and/or corporations. For example, at the date this was written, the Calgary Flames NHL franchise was held by over two dozen owners, and the Green Bay Packers NFL team was owned by several thousand individuals, most of whom were members of the local Wisconsin community.
Both friendly transactions and acrimonious disputes among shareholders occurring under such shareholder agreements will typically require the involvement of one or more valuation professionals to determine the value of the entity holding the sports-related assets (or interests therein).
Income tax and estate planning also constitute frequent sources of valuation work involving sports organizations. Those sports properties that have been owned by families will often, at some point, require valuations to be performed for intergenerational transfers of ownership among family members. Moreover, considering the significant appreciation in value experienced by professional sports franchises around the globe during the past few decades, owners of sports properties eventually may need to contend with capital gains-related issues. Valuation professionals often provide integral assistance in this process.
Insolvency or restructuring involving either a professional sports organization or one of the owners thereof is another event that will frequently necessitate the expertise of business valuators. For example, in the 1990s, there were several high-profile bankruptcies of English Premier League football (i.e., soccer) organizations that occurred after several previous rounds of financing had been obtained. At every step of the way, from the initial financing to the restructuring or asset liquidation process, business valuations are typically required to provide an indication of worth of the sports franchise and related properties.
Price Versus Fair Market Value
The valuation of professional sports properties provides an excellent illustration of the difference between price and fair market value in a “real world” setting. As valuation professionals are well aware, there are generally two distinct sets of circumstances where the value of a business is determined:
Notional Market Valuation. Fair market value, fair value or some other legislated or defined value is often notionally determined in the absence of an open-market transaction. The value standard most frequently applied in notional market valuations is “fair market value.” The generally accepted definition of this valuation term by North American courts is:
The (highest)1 price, expressed in terms of cash equivalents, at which property would change hands between a hypothetical willing and able buyer and a hypothetical willing and able seller, acting at arm’s length in an open and unrestricted market, when neither is under compulsion to buy or sell and when both have reasonable knowledge of the relevant facts.
Open-Market Transaction. Price is negotiated between a vendor and a purchaser acting at arm’s length. The term “price” is defined as “the consideration paid in a negotiated, open-market transaction involving the purchase and sale of an asset.”
In a sports market context, sentimental value may occasionally represent a component of price. This concept is evidenced by a sports team owner who is an extremely wealthy individual and does not view the acquisition of a sports team from an economic perspective but rather as a “trophy.” An investment involving sentimental value, in other words, may be ego-driven in nature and made by a purchaser who is willing and able to absorb significant losses.
Special interest purchasers are often present in the marketplace for professional sports properties. Special interest purchasers are generally defined as: “acquirers who believe they can enjoy post-acquisition economies of scale, synergies, or strategic advantages by combining the acquired business interest with their own.” Examples of these types of purchasers are large companies possessing broadcasting, media and entertainment operations that can avail themselves of synergies presented by controlling assets relating to professional sports organizations. In recent years, a number of such companies have successfully acquired professional sports properties in order to benefit from the content provided to the purchaser’s media distribution network.
In the sports business world, both of the above sets of circumstances are frequently encountered. As is illustrated below, there may be significant differences between fair market value and price. For example, fair market value typically assumes the following conditions exist:
- equal knowledge and negotiating skills;
- no compulsion to transact;
- generally no special interest purchaser considerations;
- imprudent actions and emotions are not considered;
- vendor and purchaser are assumed to deal at arm’s length; and
- transaction is assumed to be consummated for cash.
In contrast, the price determined in an open-market transaction may be influenced by the following considerations:
- unequal knowledge and negotiating skills;
- compulsion to transact may be present (e.g., a sale made in an insolvency setting even if the purchaser intends to continue the sports organization as a going concern);
- special interest purchasers may force the price upward;
- price may be struck as a result of imprudent decisions by the vendor, the purchaser or both;
- sentimental value considerations may force the price upward;
- outwardly, vendor and purchaser may appear to act at arm’s length, but may have common interests due to the elements of the transaction, such as vendor employment agreements, noncompetition agreements, etc.; and/or
- the negotiated price may contain noncash elements, such as contingent “earn-out” or bonus payments, freely trading or restricted shares and/or debt instruments.
Valuation Approaches
As is the case with most businesses, a sports franchise’s value is derived from its future benefits, such as revenues, EBITDA and net cash flow. Among the factors influencing the perceived future benefits for a sports franchise include its management team, trademarks, brands and logos, customer “fan base” relations, customer contracts (e.g., season tickets, corporate boxes, personal seat licenses), player relations and contracts, broadcasting contracts, arena ownership or lease agreements, team-alliance synergies, local demographics (e.g., population size, wealth, popularity of sport), etc.
Simply put, the fundamental goal for a sports team owner is to maximize the number of fans in the seats (or viewing the matches via broadcast media), and the goal for an arena/ stadium owner is to minimize the number of “dark nights” in which no event is occurring in the building.
Admittedly, while future benefits often cannot be measured with absolute certainty, franchise values will change in a manner commensurate with perceived increases and decreases in such benefits. In the sports business world, while no single approach or formula can be used to determine the value of sports properties in every situation, different approaches and methods have been adopted for estimating future benefits and franchise/asset values.
In sports business valuations, the Market Approach is often frequently utilized, considering the active market that exists for many professional sports properties. In the Market Approach, the subject sports property is compared to similar properties by performing a detailed analysis of prior transactions involving similar sports properties and/or in the ownership of the subject sports franchise or asset.
Transactional Issues
In analyzing transactions in sports properties, aside from reviewing the amount and structure of the transaction price, it is frequently necessary for the valuation professional to identify and quantify key organizational elements that generate value for the subject professional sports club, such as (but not limited to) management team and personnel, corporate operations, finance and technology.
It is a sports business paradigm that the management team should, in maximizing franchise value, maintain and enhance the quality of the team brand. Such brand value enhancement may be performed in a variety of ways, including winning on-field victories and championships, attracting individual “marquee” players, fostering positive community relations and developing a robust tradition ultimately bestowing “iconic” status on the sports franchise.
For example, the valuator should examine the quality of the management team, employees and players, focusing on the club’s ability to retain talent and expertise (on the field, among the coaching staff and in the front office). In order to enhance value, the sports organization should possess the potential to develop future leaders (for both players and management), avoid labor actions (e.g., strikes, lockouts), motivate commitment in its players and employees to the club’s culture and ethics, and strengthen relationships among management, players and employees.
In assessing value of sports franchises in a transactional setting, the valuation professional should also examine the ability of the organization to maximize the potential of its corporate operations. For example, the franchise organization should constantly strive to improve capacity utilization wherever possible (e.g., selling out games, maximizing advertising and media revenue). Recent revenue maximization trends by franchise owners in this context have included selling advertising on fixed or rotating panels in close proximity to playing surfaces, inside arena corridors, on building exteriors and on game tickets. Sports team management should also be seeking to optimize other areas of business potential (e.g., creation of team-alliance synergies, increase in the number of official sponsors or partners with the club, etc.).
Moreover, the sports organization should periodically assess what investments are required to expand or improve fixed-asset infrastructure (e.g., addition of seats, creation of premium or “club” seat categories, addition or expansion of facility restaurant, bar, concessions and parking facilities). Management should also be cognizant of ways to strengthen the franchise’s market position in the presence of other forms of entertainment competing for the same consumer, media and advertising spending sources.
The valuation professional must examine the ability of the sports organization to maximize the value of its intangible assets. Aside from traditional items such as the franchise logo, influencing the popularity of merchandising and licensing revenues, in recent years, savvy sports-marketing experts have derived new sources for professional sports franchises to obtain revenues, notably the leasing of stadium/arena naming rights. Typically, building naming rights are leased for several million dollars annually for terms of 10 to 20 years; these stable revenues often flow directly to the bottom line of the club/building owner.
Furthermore, in transactional contexts involving professional sports organizations, the valuation professional should assess the financial strength of the subject business. In particular, the valuator needs to place particular emphasis on the extent to which leverage has been (or may be) utilized to finance capital assets and franchise operations. Other financial issues should be reviewed, including the club’s ability to recognize and maximize all revenues (i.e., deferred revenues) from an accounting standpoint and to depreciate or amortize the franchise itself, player contracts, capital assets, etc. If the franchise is being positioned for sale, it may be desirable for the club to “clean up” the balance sheet, (e.g., eliminate redundant assets such as excess cash, marketable securities, non-operating real estate, inter-company or shareholder loans), adjust overvalued assets and other reserves in order to present the sports business’ true earning power, accelerate the collection of accounts receivable, etc.
Finally, sports business valuation experts have increasingly focused on a franchise’s ability to enhance value through the creative use of technology. In recent years, technology has been utilized by sports team owners through innovations such as the use of web-based resources featuring fan club sites and live or archived game broadcasts. Many sports business experts predict a proliferation of fee-based broadcasts of matches and related content through television, Internet audio and video, as well as mobile phone media. Other uses of technology that may create franchise value relate to the extent to which technology can be implemented to improve communications (e.g., within the internal organization, with the fan base and among the league and its members).
Value Drivers
Both of the concepts of price and fair market value are often influenced by numerous value drivers that relate specifically to professional sports franchises. Among the frequently encountered examples of “external” value drivers (over which a franchise owner exerts little, if any influence) are included, but are by no means restricted to:
- degree of control of franchise operations by league;
- finite number of teams permitted in league (i.e., barriers to or ease of entry through expansion);
- franchise expansion fee (this often constitutes a “floor” to franchise value, as well as a windfall profit to franchise owners when received). For example, in the NHL, the most recent expansion fee paid for a new franchise, occurring 15 years prior to the publication of this paper, was U.S. $85 million. Media reports have stated that the next potential round of NHL expansion could command franchise fees as high as U.S. $400 million;
- extent and terms of revenue sharing;
- presence of salary cap;
- local market barriers to ownership entry/exit;
- availability of government grants or other forms of financial assistance;
- market demographics;
- market radius protection (in the NHL, each franchise is protected by a 50-mile radius, within which another franchise in the league cannot be operated without the existing owner’s permission);
- ability of the franchise to relocate; and
- extent to which league approval is required for franchise ownership transactions.
Moreover, included among the various salient “internal” value drivers over which a franchise owner typically possesses some ability to influence are:
- ticket revenue (e.g., season ticket base, ability to increase or vary ticket prices);
- broadcast revenue (e.g., from television, radio and Internet media);
- team-alliance synergies (i.e., synergies and benefits derived from common ownership of two or more sports teams);
- player-transfer fees (i.e., these represent highly lucrative sources of revenue in international soccer);
- advertising revenue;
- playoff revenue (revenues from post-season play often contribute significantly to profits);
- concessions revenue;
- merchandising and memorabilia revenue (including revenues from licensing team name and logo); and
- stadium/arena ownership revenues (derived from building sources such as luxury “club” seating, corporate boxes, naming rights and ancillary events such as concerts, unrelated sporting events, conventions, etc.).
Interestingly, two factors that do not always constitute significant value drivers for a sports franchise are the win-loss record of the club, as well as the individual players comprising the team. The impact of possessing (or lacking) either championship trophies or superstar players must be assessed by the valuation professional as to the incremental contribution of each to the value of a particular sports organization.
Among the important items on the expense side of the income statement that may materially impact the value of a professional sports franchise are included player salaries, which are, in turn, influenced by permitted contractual increases, free agency, union collective bargaining agreements, long-term injuries to or retirements of players, etc.
Franchise owners who do not own the stadium/arena facility will also be subject to leases for building rental, as well as possibly leases for concessions, merchandising and/or parking facilities. Moreover, some teams, such as Canadian NHL franchises, must contend with material foreign currency risk, as their revenues will be received in the local currency while some of their expenses (e.g., player salaries) may be denominated in a foreign currency. Finally, the ability of a sports club to claim amortization expense on its franchise cost, player contracts and capital assets will impact its fiscal situation, as well as its operating cash flows.
Conclusion
While the sports business field may be a source of some exciting mandates for the valuation practitioner, as the above narrative indicates, sports properties encompass a highly specialized segment of our profession that is subject to its own distinct challenges.
This article originally appeared in Wolters Kluwer’s Business Valuation Alert, January 2015.
About the Authors
Drew Dorweiler, MBA, CPA, ABV, CBV, ASA, CBA, CFE, CVA, FRICS, is Managing Partner at IJW Co.
Don Erickson, ASA, is Managing Director of Mercer Capital.
Endnote
1 The word “highest” is added to the Fair Market Value definition in Canada.
Valuing Insurance Agencies
Like most professional services firms, much of the value of an insurance agency lies in its customer base, workforce, and the intangible factors that drive growth and margin. But not all insurance agencies are created equal. The recurring revenue streams, low fixed asset intensity, and favorable financing characteristics have drawn the interest of industry consolidators, private equity investors, financial institutions, and other participants, leading to a robust transaction environment. Join Lucas as he reviews the valuation methodologies and drivers of value for insurance agencies and brokerages.
Lucas M. Parris, CFA, ASA, presented this webinar sponsored by Business Valuation Resources on January 19, 2016.
