Analysis of the Spirit Fairness Opinions re the JetBlue Acquisition
As participants and observers in transactions, the pending acquisition of Spirit Airlines, Inc. (NYSE: SAVE) by JetBlue Airways Corporation (NASDAQGS: JBLU) offers a lot of fodder for us to comment on. In this post, we look at the fairness opinions delivered by Morgan Stanley and Barclays to the Spirit board before approving the deal and then ask a key transaction-related question.
On July 28, 2022, Spirit agreed to be acquired by JetBlue for cash consideration of $33.50 per share, or $3.8 billion. Inclusive of net debt, the transaction at announcement had an enterprise value of $7.6 billion. Deal multiples included 25.5x analysts’ consensus EPS for the next 12 months and 12.3x NTM EBITDA.
The deal value excluding ticking payments that could push the total consideration to $34.15 per share, represented a 38% premium to Spirit’s closing price on July 27 of $24.30 per share; however, the announcement was not a surprise because Spirit had been in play since February 5 when the company agreed to be acquired by Frontier Group Holding, Inc. (NASDAQGS: ULCC) for 1.93 Frontier shares and $2.13 per share of cash, which was then valued at $25.83 per share.
JetBlue subsequently made an unsolicited cash offer on March 29 (disclosed on April 5) of $33.00 per share that was rejected on May 2. JetBlue then commenced a $30.00 per share tender on May 16, noting the price was less than the $33.00 per share offer because of the board’s “unwillingness to negotiate in good faith with us.”
Ultimately, the Frontier deal was terminated on July 27, and Spirit then entered into an agreement with JetBlue that provided for the following:
- $33.50 per share of cash, including $2.50 per share payable upon approval of the transaction by Spirit stockholders;
- Monthly ticking fee of $0.10 per share up to $0.65 per share commencing January 2023 through mid-July 2023 whether the transaction is consummated or terminated; and
- Downside protection via $70 million payable to Spirit and up to $400 million, or $4.30 per share payable to stockholders inclusive of the approval payment and ticking fees in the event the merger agreement is terminated for failure to obtain regulatory approval.
The Barclays and Morgan Stanley Fairness Opinions
The proxy statement dated September 12 enumerated the reasons the Spirit board approved the merger agreement, including the fairness opinions that opined the consideration to be received by shareholders was fair from a financial point of view to the shareholders. Interestingly, both banks were retained by Spirit in late 2019 to assist in a review of strategic options that was interrupted by COVID.
A fairness opinion provides an analysis of the financial aspects of a proposed transaction from the point of view of one or more parties to the transaction, usually expressing an opinion about the consideration though sometimes the transaction itself. Ideally, the opinion is provided by an independent advisor that does not stand to receive a success fee, especially when the transaction is a close call or involves real or perceived conflicts. In the case of the JetBlue-Spirit transaction, both Spirit advisors will receive much larger contingent fees if the transaction is consummated compared to the fixed fee fairness opinions.[1]
Let’s look at a high-level comparison of each bank’s analysis, some of which were explicitly included in the fairness analyses and some of which were presented for reference only. (A link to the proxy statement can be found here.)
Guideline Public Company (“GPC”) Analysis
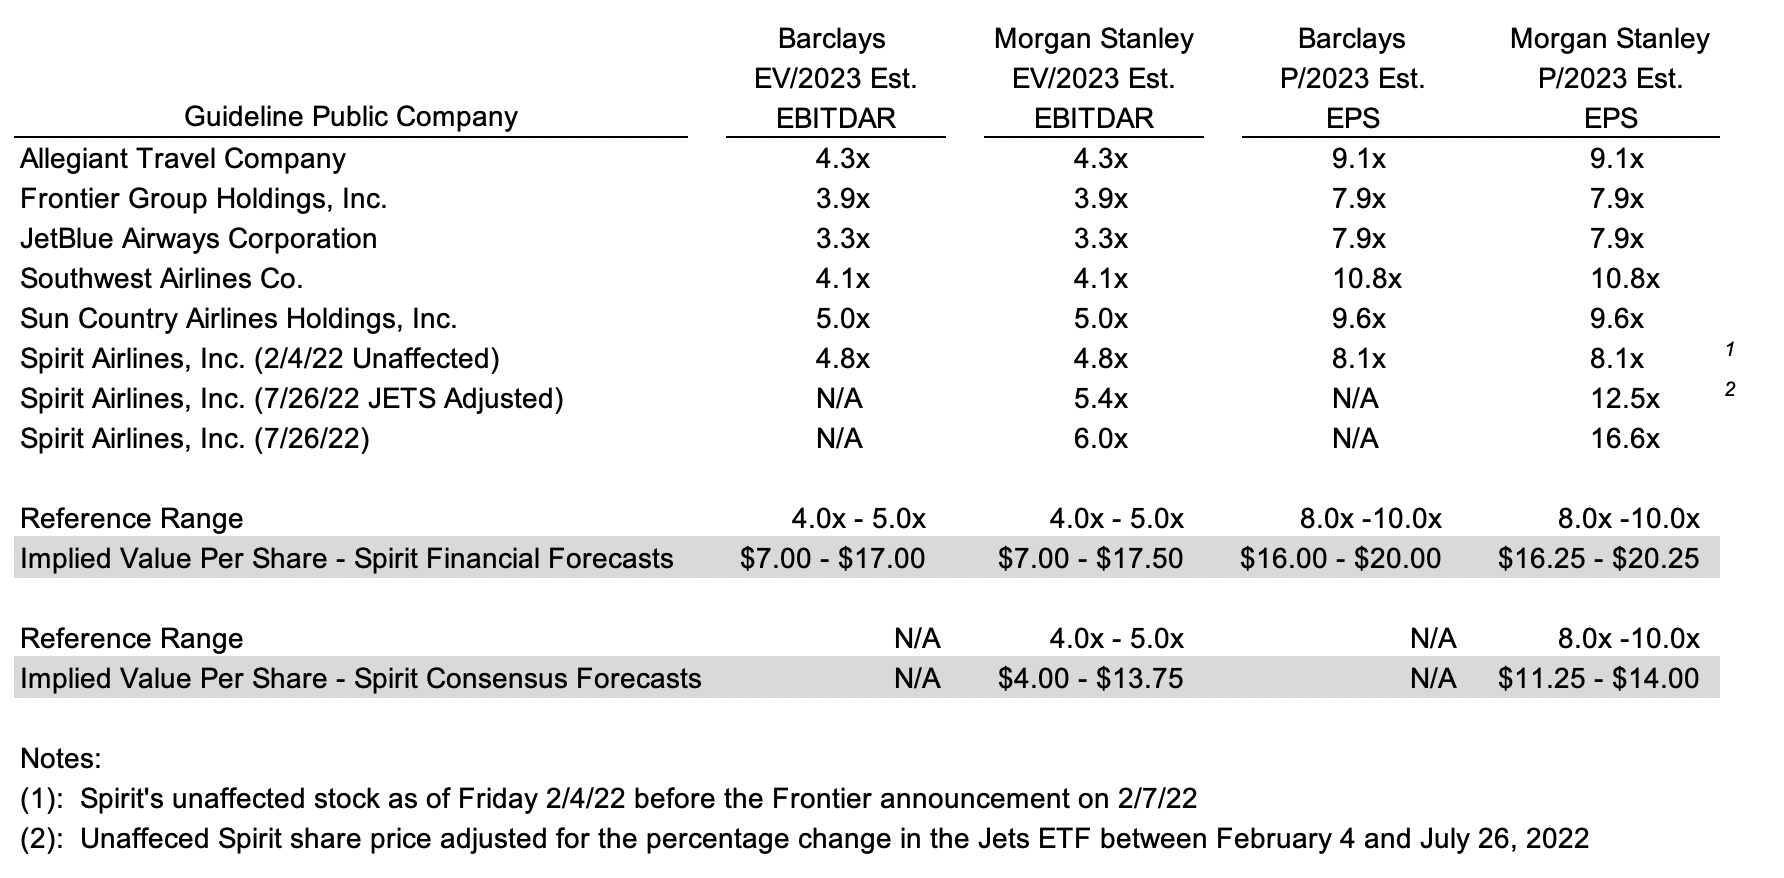
Barclays and Morgan Stanley reviewed and compared specific financial and operating data relating to Spirit with selected GPCs deemed comparable to Spirit. The following table compares the selected GPCs, the then-current multiples, the relevant multiple range, and indicated range of value for Spirit as calculated by each bank.
Click here to expand the image above
Both banks relied upon management’s forecast for net income and EBITDAR; however, Morgan Stanley also considered the Street’s consensus forecast for 2023. Spirit is included in the comp group to develop the applicable multiples with both banks relying upon pricing in early February immediately before the Frontier deal was announced; however, Morgan Stanley included alternate multiples based upon Spirit’s price as of July 26 and as of July 26 based upon the change in the industry ETF (JETS) from February 4. Nonetheless, the indicated values each developed based upon management’s forecast were the same.
Guideline Transaction (M&A) Analysis
The opinions did not include guideline transactions, presumably because there is limited M&A data involving U.S. carriers. The most recent significant acquisitions include Northwest Airlines and Continental Airlines in 2008, AirTran Holdings in 2010, and Virgin America in 2016. Nonetheless, we find it odd that a GT analysis was not addressed in the proxy.
Discounted Cash Flow Analysis
Both banks included a DCF analysis, a valuation method that is standard in virtually all valuation analyses. The gist of the analysis reflects the discounting of unlevered cash flows over a discrete period (2H22-2026) and the projected debt-free value of the company at the end of the projection period to present values based upon the weighted average cost of capital. Net debt is then subtracted to derive the indicated equity value.

Discounted Equity Analysis
Morgan Stanley but not Barclays derived indicated ranges of value per share by discounting management’s forecasted 2025 EBITDAR and EPS to present values based upon a 12.9% equity discount rate. If Spirit paid common dividends, the present value of the dividends through 2025 presumably would have been included, too. The analysis is similar to the DCF method except that cash flows are viewed from the perspective of what is received by shareholders compared to enterprise-level cash flows in the DCF analysis. Morgan Stanley derived a range of $24 to $43 per share based upon 5.0x to 6.5x EBITDAR and $39 to $47 per share based upon 9.0x to 11.0x forecasted 2025 EPS.
Historical Share Price Analysis
Both banks reviewed the 52-week trading history for Spirit for the period ended July 26, 2022 ($16-$29 per share) and in the case of Morgan Stanley for the 52 week period ended February 4, 2022 ($20-$40 per share). Although seemingly an important consideration for the fairness analyses, neither bank’s proxy write-up discussed the deal price premium relative to Spirit’s recent trading on a stand-alone basis or compared to M&A involving publicly traded midcap companies. The proxy did note that the board considered the premium in approving the merger agreement, however.
Research Analyst’s Price Targets
Both banks reviewed sell-side analysts’ one-year price targets ($24-$36 per share). Morgan Stanley discounted the price targets to a present value range of $21 to $32 per share using a discount rate of 12.9%, though the analysis was presented only for reference.
Barclay’s and Morgan Stanley’s Conclusion
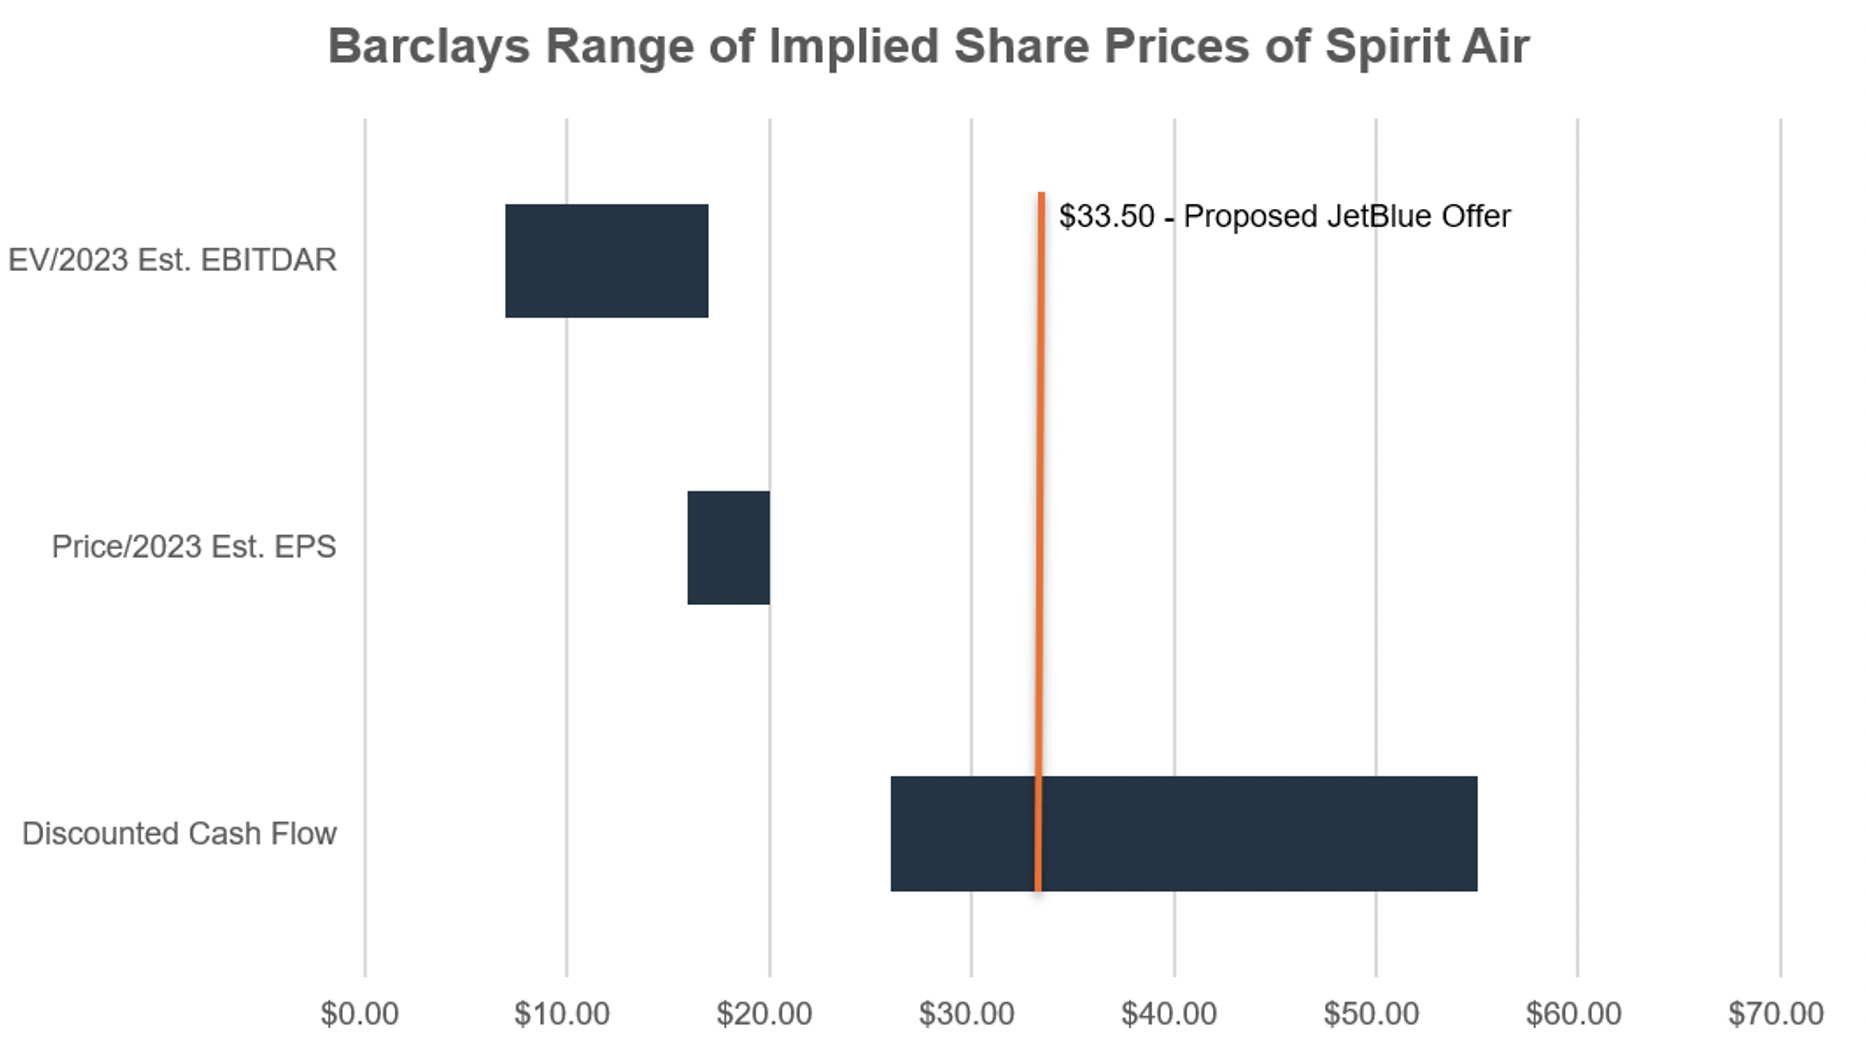
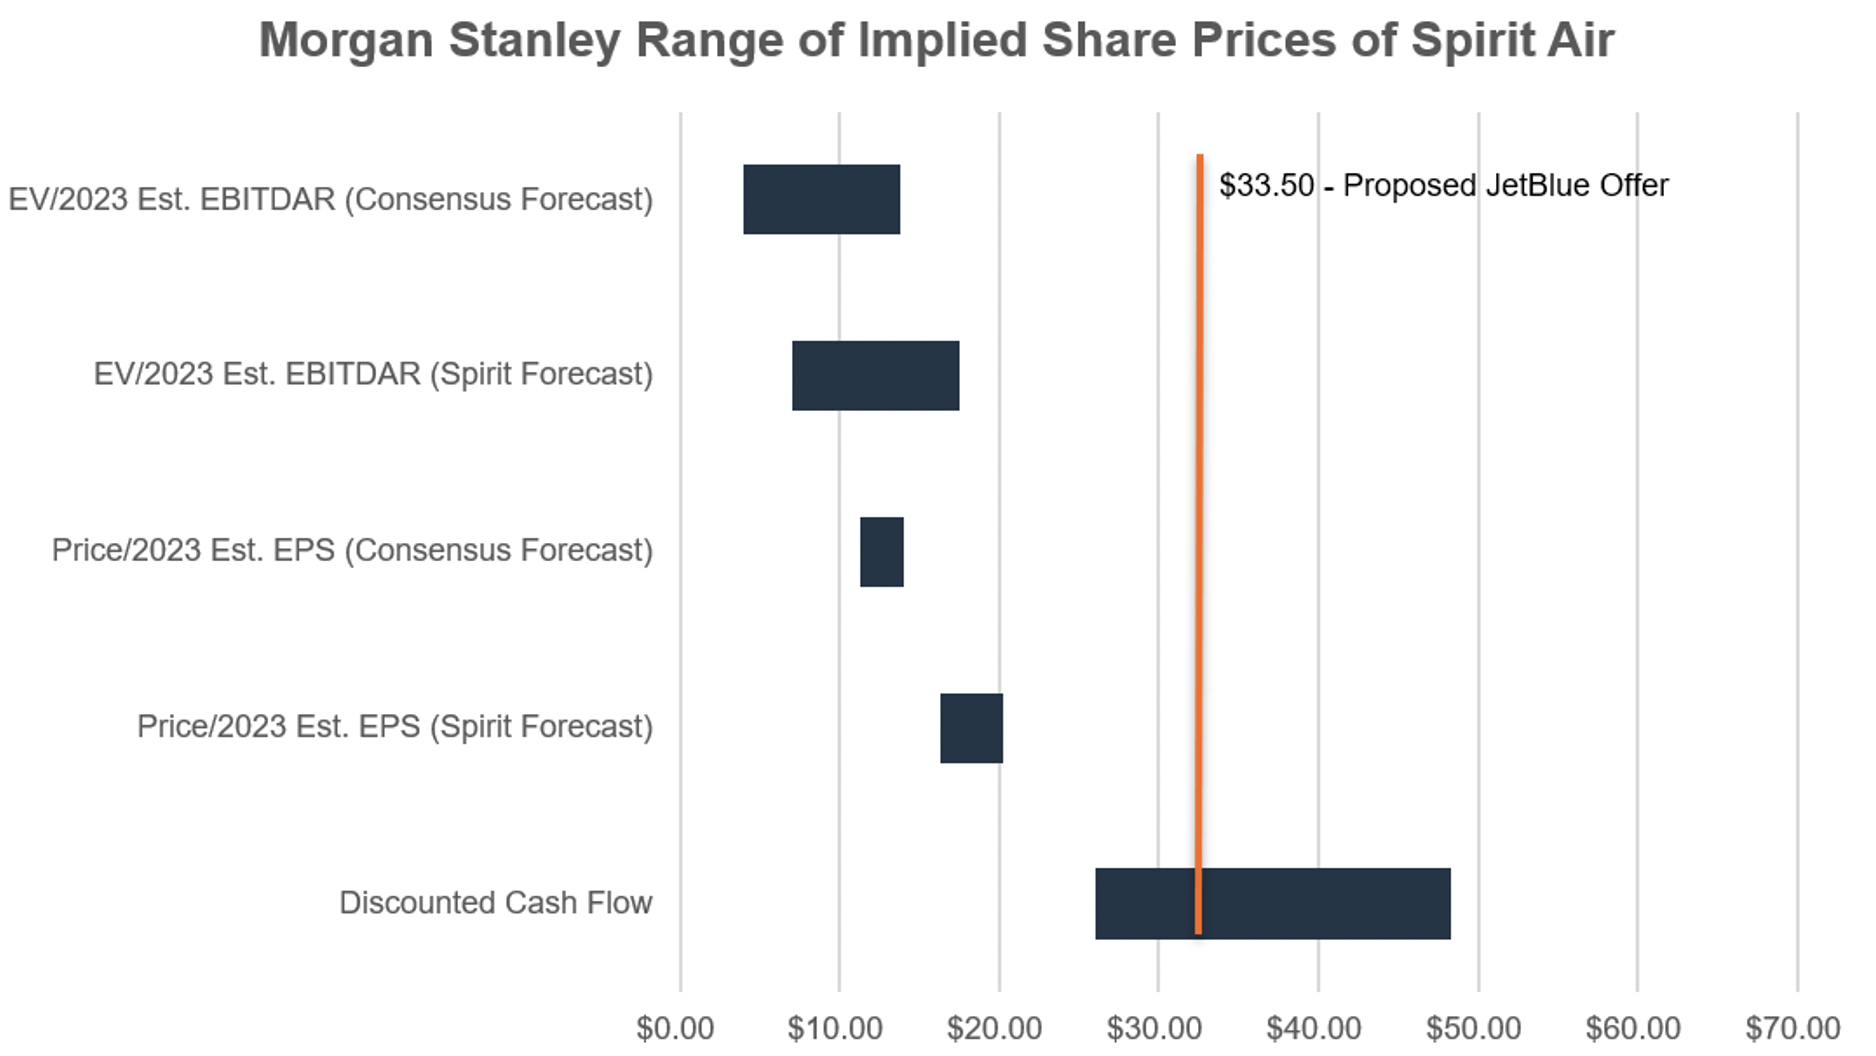
Both banks opined that, from a financial point of view, the consideration to be received by the stockholders of Spirit in the proposed transaction is fair to such stockholders. As can be seen in the graph below, the $33.50 share price falls within the range of values determined by both banks and decidedly above trading-based indications of value vs management’s forecast as reflected in the DCF valuations.
Current Status of the Transaction
Given the price and terms of the JetBlue deal, rendering the fairness opinions appears to have been a straightforward exercise; however, one deal point a board must always consider is the ability of a buyer to close. This begs the question: Can JetBlue close the deal?
The market’s answer to the question is “no” given the deep discount Spirit trades to the acquisition price net of the approval payment. The deep discount reflects the growing likelihood that the U.S. Department of Justice will sue to block the deal because it would eliminate another low-cost carrier and position JetBlue-Spirit as the USA’s fifth-largest airline behind American Airlines, Delta Air Lines, Southwest Airlines, and United Airlines.
Among the factors the board considered that weighed against approving the deal was the risk that regulators would block the deal. These concerns were voiced by Frontier and some investors when JetBlue made its unsolicited offer nearly a year ago, but the board approved the transaction nonetheless, perhaps figuring JetBlue offered downside payments and that Frontier would still be an option if Washington nixed the JetBlue transaction.
And for what it is worth, the terminated Frontier deal would be valued around $23 per share, with its shares trading near $11 per share as of February 21.

Source: S&P Global Market Intelligence
Click here to expand the image above
[1] Morgan Stanley received a fee of $1.75 million for the fairness opinion and will be paid a success fee of $20.0 million if the deal closes. Barclay’s opinion and success fees are $3.0 million and $14.0 million.
Meet the Team – Timothy R. Lee, ASA

Timothy R. Lee, ASA is the firm’s Managing Director of Corporate Valuation services and is a member of the firm’s board of directors. He provides litigation support services in cases involving economic damages, business valuation, dissenting shareholder rights, marital dissolution, and tax matters. Tim also provides valuation and corporate advisory services for purposes including mergers and acquisitions, employee stock ownership plans, profit sharing plans, trust & estate planning and compliance matters, corporate planning, and reorganizations.
What attracted you to a career in business valuation?
Timothy Lee: As a “late” starter in financial services, I sought a path that would leverage years of practical experience gained from real world selling and managing in my teens and 20s. Business valuation has exposed me to a great diversity of business models and allowed me to learn from the successes and challenges of our clients.
Over the years, the core valuation discipline bridged into a multi-line financial advisory practice that places me in a position to assist clients facing both difficult and opportunistic events in the lifecycle of business ownership. For me, the bet on valuation and the fortitude of nearly 30 years of financial and industry breadth has placed me and my Mercer Capital colleagues in the enviable position of offering services with uncompromising credibility and with broad ranging experience well beyond a pure-play valuation shop.
As a Managing Director at Mercer Capital, what services do you provide to clients?
Timothy Lee: Mercer Capital offers services across three broadly defined groupings: 1) valuation for tax, financial reporting, and other compliance and corporate finance purposes, 2) dispute resolution services ranging from unmatched buy-sell functionality to expert witness services for corporate and personal litigation matters, and 3) buy- and sell-side transaction advisory services primarily covering the middle-market M&A space and including large business concerns in numerous financial and non-financial industry verticals.
My personal practice has become more focused on the diverse needs of larger private companies whose regular needs require all three service buckets in real time and where reconciling these needs is essential for ownership success and strategic execution. Organizationally and personally, we are focused on the forest of client needs, which over time have become more business and industry centered while maintaining our legacy leadership in business valuation services.
What type of engagements give rise to your involvement in litigation matters?
Timothy Lee: Mercer Capital has worked diligently to parlay Chris Mercer’s longstanding success in significant litigation matters into a diverse dispute resolution practice with growing depth regarding industry coverage, legal setting, and dispute scenario. Today, we have several litigation-focused senior professionals who handle everything from business-heavy marital dissolution to corporate damages and fair value matters across the country.
Like most senior professionals at Mercer Capital, my litigation involvements are generally allied to certain industries and/or are related to certain dispute scenarios. For me, industry depth is broad ranging and particularly deep in numerous areas: construction contracting, trades, and building materials; food & beverage ranging from multi-unit franchise models to alcoholic beverage distribution; equipment dealership industries including earth-moving, agricultural, and material handling networks; manufacturing industries in metal fabrication and processing; vertically integrated agricultural concerns; real estate, hospitality, and hotels; specialty chemicals; professional practices; warehousing and merchant wholesale distribution models; transportation and logistics. I also have significant experience assisting clients in buy-sell design and dispute matters offering a functional path toward collaborative resolution.
What should clients understand about valuation and the services a firm like ours can provide?
Timothy Lee: Valuation perspective and financial market comprehension are lacking among a great many business owners, boards, and management teams. Relegating valuations to critical (often stressful) events as opposed to maintaining a programmatic discipline is very much like the saying: failing to prepare is preparing to fail. Self-serving as it may sound, I see basic business valuation as an elemental and regular need of business owners.
Businesses have employees dedicated to daily cash management, inventory control, and capital investment; but owners and boards rarely seek the all-important measurement of business value. Harsh as it sounds – that is preparation to fail and an abdication of wealth accountability. Understanding business value and how it changes in response to industry, market, and organic forces is what we help business owners understand. That is the essence of the service we provide.
What is one thing about your job that gets you excited to come to work every day?
Timothy Lee: Well, if I am limited to just one thing, I’d have to say the excitement is one of living up to the incredible trust and responsibility of informing clients with meaningful and actionable financial information. The derivatives (now I’m cheating) of that one thing are the countless benefits I get from interacting with clients and colleagues to do meaningful work.
2022 Bank Stock Performance Recap
We recall discussions in early 2022 with clients regarding their outlook for 2022 – three 25 basis point Fed rate increases, a “more normal” operating environment following the pandemic afflicted 2020 and 2021, and stable credit quality. The latter of those three items held true, but 2022 was anything but normal. Instead of three 25 basis point rate increases, the Fed delivered seven totaling 425 basis points. The bull market was routed for both equities and, most exceptionally, bonds.
Given this backdrop, publicly-traded banks did comparatively well. The median stock price change among the 343 banks and thrifts traded on the NASDAQ and NYSE was negative 9% in 2022, relative to negative 19% for the S&P 500 and negative 33% for the NASDAQ. Further, there was more dispersion in performance during 2022.

In 2020, only 13% of publicly-traded banks reported a rising stock price during the year, whereas in 2021 only 5% of banks reported a falling stock price from year-end 2020 to 2021. That is, banks generally moved in tandem—down in 2020 and up in 2021. While not evenly balanced, 30% of banks reported a positive year-over-year stock price change in 2022 (see Figure 1). We believe this positive performance for quite a few banks in 2022 was masked by the downbeat market sentiment and warrants further investigation.
Figure 2 distinguishes shares price changes in 2022 by asset size range. The largest banks, with assets exceeding $100 billion, performed the worst in 2022, with no banks reporting share price appreciation and a median stock price decline of 22%. Smaller banks performed better, led by banks with assets between $1 and $5 billion. This stratum reported a median share price decline of only 5%, with 38% of the banks experiencing positive share price appreciation in 2022.

Click here to expand the image above
While market performance remains a function of the market’s ever evolving view of a particular bank’s earning power, growth outlook, and risk attributes, we explore in this article some of the factors influencing the better and weaker performing banks in 2022.
What Goes Down Must Go Up?
One of the best predictors of share price appreciation in 2022 was, in fact, performance from year-end 2019 to year-end 2021. As indicated in Figure 3, banks with the strongest price appreciation during 2020 and 2021 performed the worst in 2022, while those banks that most lagged the market in 2020 and 2021 outperformed in 2022.

Some of the market leaders in 2020 and 2021 crashed out of favor in 2022, such as those embracing crypto or positioning themselves as technology leaders rather than stodgy, traditional banks. Figure 4 presents the ten banks with the largest negative returns in 2022.

Click here to expand the image above
A Question Answered
The most common question we received over the last twelve months was, “what is the effect of the unrealized securities portfolio loss on share value?” While there are possibly extenuating circumstances for some banks (see, e.g., Silvergate Capital Corp. in Figure 4), our general guidance is that the market emphasizes forward-looking earning power, not the magnitude of the unrealized loss.
Figure 5 correlates stock performance in 2022 with the magnitude of the unrealized securities portfolio loss.1 For example, banks in the first quartile had a median unrealized loss of 5% of equity.2 These banks experienced a median stock price change of negative 6%. Meanwhile, banks with the largest unrealized losses—ranging from 29% to 111% of tangible equity—reported a median stock price change of negative 5%. A more robust statistical analysis indicates a similar result; that is, virtually no relationship between the size of a bank’s unrealized securities portfolio loss and market performance in 2022.

Our view is that the unrealized loss on securities should be evaluated in the context of the entire balance sheet. We would be more concerned, from a valuation standpoint, when a large unrealized loss is coupled with a heavier exposure to fixed rate loans, particularly if the bank is facing pressure on deposit rates.
The “Corest” of Core Deposits
As we found out in 2022, some core deposits are more core than others. One of the strongest determinants of stock price performance in 2022 was the change in the cost of funds. We evaluated the change in the cost of funds from the first through the third quarters of 2022.3 As indicated in Figure 6, banks in the first quartile reported a median increase in the cost of funds of two basis points, whereas banks in the fourth quartile reported a median increase of 48 basis points. Further, banks in the first quartile reported a median stock price change of positive 5% in 2022, versus negative 16% for the fourth quartile banks.

An analysis of net interest margin expansion between the first and third quarters of 2022 shows a similar result. Banks in the first quartile reported a median change in NIM of six basis points and a stock price change of negative 18%, while banks in the quartile with the most NIM expansion—82 basis points for the median fourth quartile bank—eked out a 1% positive share price appreciation.

The preceding analysis masks the market’s concern for banks with tightening NIMs, however. Among the 205 banks in our analysis, eighteen reported NIM compression between the first and third quarters of 2022. These banks underperformed, with sixteen of the eighteen reporting lower stock prices in 2022 and a median stock price decline of 21%. This indicates the market’s sensitivity to NIM compression, which will be an issue for more banks in 2023 as rising deposit rates bite.
The Role of Balance Sheet Mix
From publicly-available disclosures, it is difficult to discern the sensitivity of a bank’s assets, including both loans and securities, to rising rates. In the recent zero rate environment, pressure existed to invest in anything but short-term liquid assets. Therefore, we evaluated whether balance sheet composition could explain market performance in 2022. We could find no discernable relationship between loan/deposit ratios and market performance in 2022. However, while the evidence is somewhat weak, banks with the largest exposures to short-term liquid assets performed better in 2022.4

Figure 8 shows short-term liquid assets as a percentage of total assets. Most banks operate with short-term liquid assets in a relatively tight range (under 5% of total assets); thus, limited correlation is evident between exposure to short-term liquid assets and performance. However, a more positive relationship begins to emerge in the tail of the distribution. Banks in the fourth quartile reported liquid assets of 9.9% and a positive 1% stock price change. Narrowing the fourth quartile banks to those with liquid assets exceeding 10% or 15% of total assets results in stronger share price changes of positive 9% and 16%, respectively.
Conclusion
As in 2022, no doubt some newfound concerns will emerge in 2023 to drive bank stock performance. We suspect that funding cost pressure will remain an overarching concern in 2023, with true core deposits proving their value in a way not evident for years. Loan repricing will be interesting to watch. With many Prime, LIBOR, and SOFR-based floating rate loans having already repriced, further expansion in asset yields will depend on the contractual repricing periods for existing adjustable rate loans and, for newly originated loans, the “rate beta” between origination rates and broad market rates. After a long period of near nil credit losses, it would not be surprising to see some upward pressure on credit losses, although this seems likely to remain episodic in 2023. Some banks with heavier exposure to consumer loans underperformed in 2022, and it will be interesting to watch if weaknesses emerge in any segments of banks’ commercial loan portfolios in 2023.
1 Figures 5 through 8 include banks traded on the NASDAQ or NYSE with total assets between $1 billion and $10 billion.
2 To create a more consistent analytical framework, the analysis considers the unrealized losses on securities classified as both available-for-sale and held-to-maturity, as a percentage of tangible common equity.
3 As of the drafting of this article, fourth quarter 2022 performance was not available for many publicly-traded banks.
4 We define short-term liquid assets as cash, balances at the Federal Reserve, Fed Funds sold, etc.
Navigating Tax Returns
This piece is designed to assist family law attorneys and their clients better understand tax returns because knowing how to navigate tax returns can be very useful in divorce proceedings. The information contained in tax returns can provide support for marital assets and liabilities, sources of income and potential further analyses. Reviewing multiple years of tax returns and accompanying supplemental schedules may provide helpful information on trends and/or changes and could indicate the need for potential forensic investigations.
This information originally appeared in Mercer Capital’s Family Law Valuation and Forensics Insights newsletter, a monthly publication distributed by email as well as located on our website. While we do not provide tax advice, Mercer Capital is a national business valuation and advisory firm and we provide expertise in the areas of financial, valuation, and forensic services.
To download the complimentary PDF, click “Add to Cart” or you can click here.
Understanding the Importance of Defining the Assignment in a Business Valuation
To celebrate a new year and everything that comes with new beginnings, the Mercer Capital Litigation Support Services Team has decided to start the year with a blog emphasizing the importance of the beginning of a family law engagement, defining the assignment.
What Is an “Assignment Definition” in a Business Valuation and Why Is it Important?
In an engagement that requires a business valuation, the first step that attorneys and valuation experts should take is to define the assignment. This process involves the following:
- What interest is being valued. Sometimes this answer is simple, but sometimes it can be complex with multi-tiered entities or multiple ownerships. It is not uncommon to receive organizational structures with multiple holding companies and operating businesses, and the engagement letter should clearly state what is being valued. However, sometimes just that falls within our scope of engagement, so, the engagement letter may allude to a “TBD” [to be determined] ownership percentage. Owning 100% of a Company is different than owning 10%. This discussion can also lead to conclusions around the “level of value” of the engagement, a concept which will be discussed later in this blog.
- The “as of” date for the appraisal. A valuation conclusion pertains to a specific subject interest (see above) as of a specific date. Markets change, business factors change, and the value of a business or business interest is not static across time. For reference, consider: the public market, where publicly traded companies change price and as a result, value, daily. For most engagements, the valuation report is issued after the “as of” date. In other words, there is usually lag between the effective date for the conclusion and when that conclusion is rendered. Some states require current date as close to dissolution as possible, which may in turn require additional services, such as an update, or another valuation as of a more current date. See this newsletter for a more detailed explanation of the importance of the valuation date in a valuation engagement.
- Fees. While some valuation engagements can be performed for a fixed fee, most litigation engagements are an hourly basis due to our open-ended involvement. This open-endedness comes from the nature of litigation, where depositions, testimonies and prep for the opposing experts may be required by the valuation expert. Throughout the course of the engagement, other requested services can include forensic accounting services or an estimation of damages. In either case, the engagement letter should spell out how fees will be calculated and terms on billings and collections.
- Standard of Value and Level of Value. The standard of value and level of value are both valuation concepts that are very important to the valuation experts work and conclusions. While we do not intend to dive too deep into valuation theory in this blog, we will briefly discuss the standard of value and level of value below:
Standard of Value
While defining the assignment, the Standard of Value is another important consideration. Some simple questions that can help determine the standard of value include: Will the business continue to operate as a going concern or is a liquidation value more appropriate? Is “fair market value” or “fair value” required by the letter of the law for that specific engagement?
There are four standards of value that should be considered when defining a valuation assignment:
- Fair Market Value (“FMV”) Business valuations performed using the FMV standard are valued from the perspective of a rational, third-party investor who is not under any compulsion to buy or sell. In marital dissolution matters, FMV is typically appropriate and most common. Depending on the assignment definition, it is important to note that valuations of a business interest under FMV can include valuation discounts like a minority interest discount or a discount for lack of marketability, which are explained in more detail in this whitepaper. Check out this blog post by Mercer Capital for a more in-depth look at Fair Market Value.
- Fair Value. Business valuations performed using the Fair Value standard are slightly different from FMV. Shareholder oppression cases are an example where Fair Value is typically used. It is important to note that valuation discounts are not typically applied under the Fair Value standard. Check out this whitepaper by Mercer Capital for a more in-depth look at Statutory Fair Value.
- Investment Value. Business valuations performed using the Investment Value standard represent the value of a business interest to a particular, specific investor. The value of the business to a party such as a competitor, supplier, or customer is typically higher than it would be for a rational third-party investor due to the expectation of business synergies. Investment value varies depending on the value of the business to the specific purchaser; the business may well be more valuable to one competitor than to another, for example.
- Liquidation Value. The other standards of value listed above all assume a “going concern” premise, where that the business will continue operations, either independently or as a part of an acquiring company. However, there are circumstances such as distressed companies or a sale of a material asset where the liquidation value is more applicable. As a result, liquidation value will look at value from the context of the business being terminated or materially altered.
Each of these four business valuation standards may result in a different number to represent the value of the business, depending on the circumstances. Selecting the appropriate Standard of Value is crucial, and an experienced business valuation professional should be well-versed in selecting the standard of value that is most appropriate for the subject business interest being valued.
Levels of Value
Business appraisers also refer to different kinds of values for businesses and business interests in terms of “levels of value.” As we noted in the Standards of Value section of this blog, the Fair Market Value standard of value opens the door for valuation discounts or premiums to be applied, which means that business appraisers may need to determine the appropriate Level of Value. See the chart below for the different Levels of Value that can be assigned to a valuation assignment:
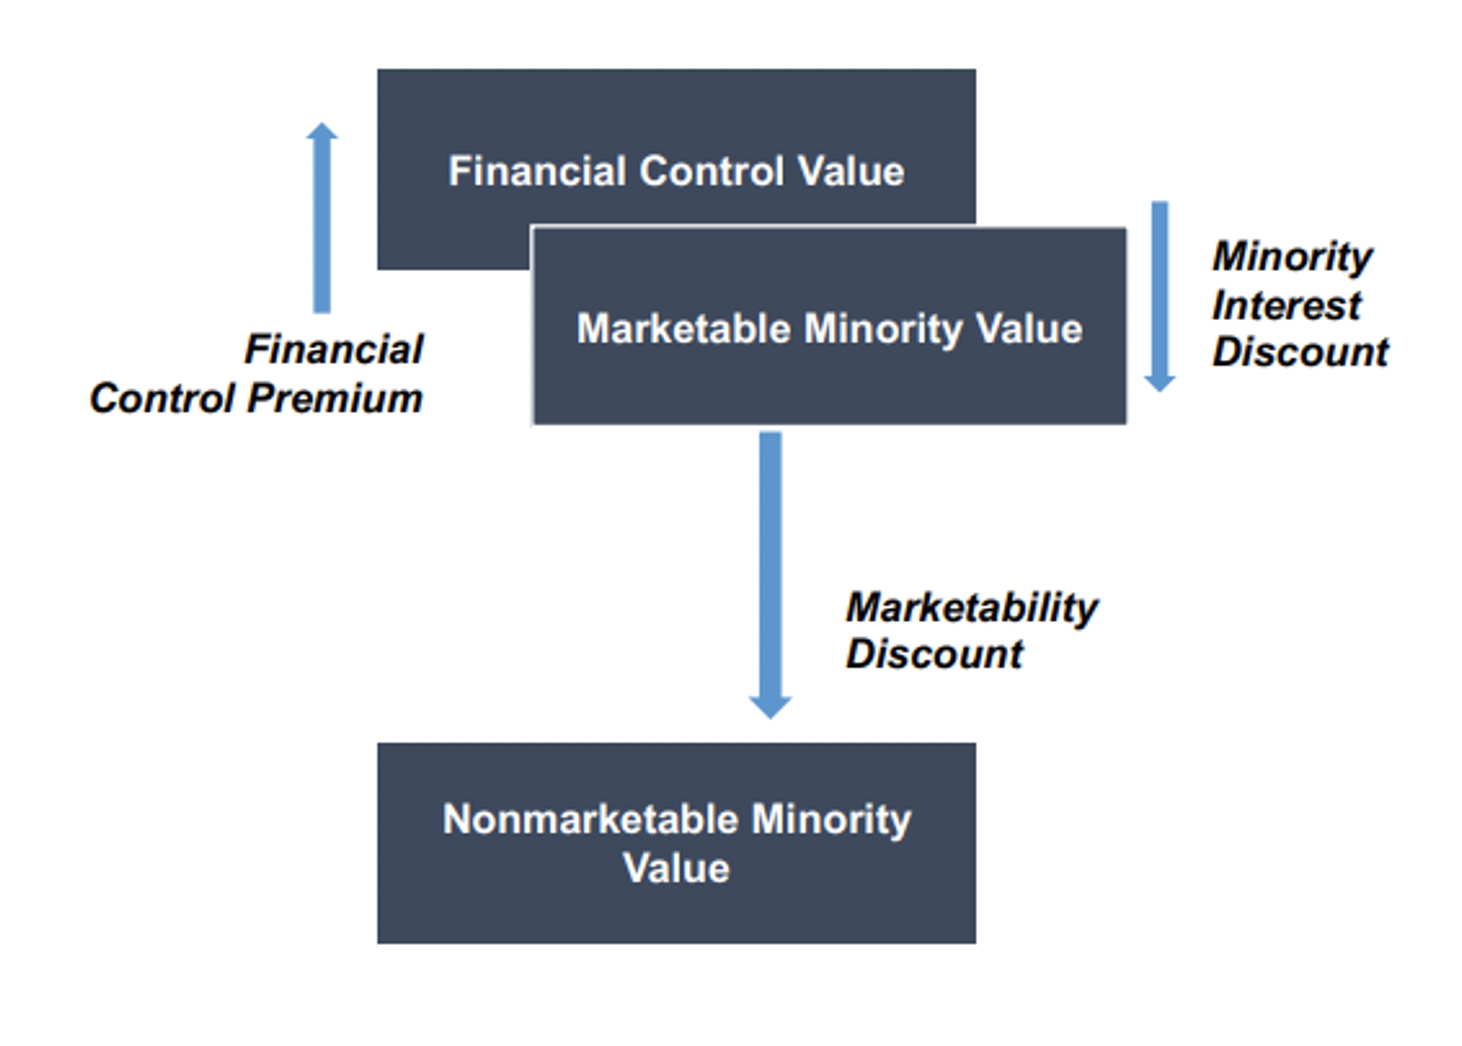
To provide some examples, if the subject interest in a valuation assignment is a non-controlling minority investor, then the Nonmarketable Minority Value would likely be most appropriate. If the subject interest is a controlling owner, then the Financial Control Value could be considered. An experienced valuation expert should be able to help determine the appropriate level of value for an engagement and should also be able to quantify any Minority Interest Discount or Discount for Lack of Marketability that is deemed necessary in that engagement. Check out this blog post by Mercer Capital for a more in-depth look at the Levels of Value.
Important Takeaways for Attorneys and Valuation Experts
Defining the assignment in a valuation engagement can seem like a tall task but asking the right questions and having the right discussions with the right valuation expert at the beginning of an engagement can assist the process. You can think of the assignment definition process as building a road map for the valuation. Mercer Capital has extensive experience with a variety of valuation matters, including industry-expertise and complex scopes.
Bank M&A 2022 — Turbulence
At this time last year, we thought bank M&A would be described as a second year of “gaining altitude” after 2020 was spent on the tarmac following the short, but deep recession in the spring of 2020. Our one caveat was that bank stocks would have to avoid a bear market following a strong performance in 2021 because bear markets are not conducive to bank M&A.
The caveat was correct. Bear markets developed in both bank stocks and fixed income that included the most deeply inverted U.S. Treasury curve since the early 1980s. Among the data points:
- The NASDAQ Bank Index declined 19% through December 28;
- The Fed raised the Fed Funds target rate 425bps to 4.25% to 4.50%;
- The yield on the 10-year US Treasury rose 236bps to 3.88%; and
- Credit spreads widened, including 150bps of option adjusted spread (OAS) on the ICE BofA High Yield Index to 4.55% from 3.05%.
The outlook for deal making in 2023 is challenged by significant interest rate marks (i.e., unrealized losses in fixed-rate assets), credit marks given a potential recession, soft real estate values, and the bear market for bank stocks that has depressed public market multiples. For larger deals, an additional headwind is the significant amount of time required to obtain regulatory approval.
However, core deposits are more attractive for acquirers than in a typical year given rising loan-to-deposit ratios, the high cost of wholesale borrowings and an inability to sell bonds to generate liquidity given sizable unrealized losses. A rebound in bank stocks and even a modest rally in the bond market that lessens interest rate marks could be the catalysts for an acceleration of activity in 2023 provided any recession is shallow.
A Recap of 2022
As of December 28, 2022, there have been 167 announced bank and thrift deals compared to 216 in 2021 and 117 in 2020. During the halcyon pre-COVID years, about 270 transactions were announced each year during 2017-2019.
As a percentage of charters, acquisition activity in 2022 accounted for 3.5% of the number of banks and thrifts as of January 1. Since 1990, the range is about 2% to 4%, although during 2014 to 2019 the number of banks absorbed each year exceeded 4% and topped 5% in 2019. As of September 30, there were 4,746 bank and thrift charters compared to 4,839 as of year-end 2021 and about 18,000 charters in 1985 when a ruling from the U.S. Supreme Court paved the way for national consolidation.
Also notable was the lack of many large deals. Toronto-Dominion’s (NYSE: TD) pending $13.7 billion cash acquisition of First Horizon (NYSE: FHN) represents 61% of the $23 billion of announced acquisitions this year compared to $78 billion in 2021 when divestitures of U.S. operations by MUFG and BNP and several larger transactions inflated the aggregate value.
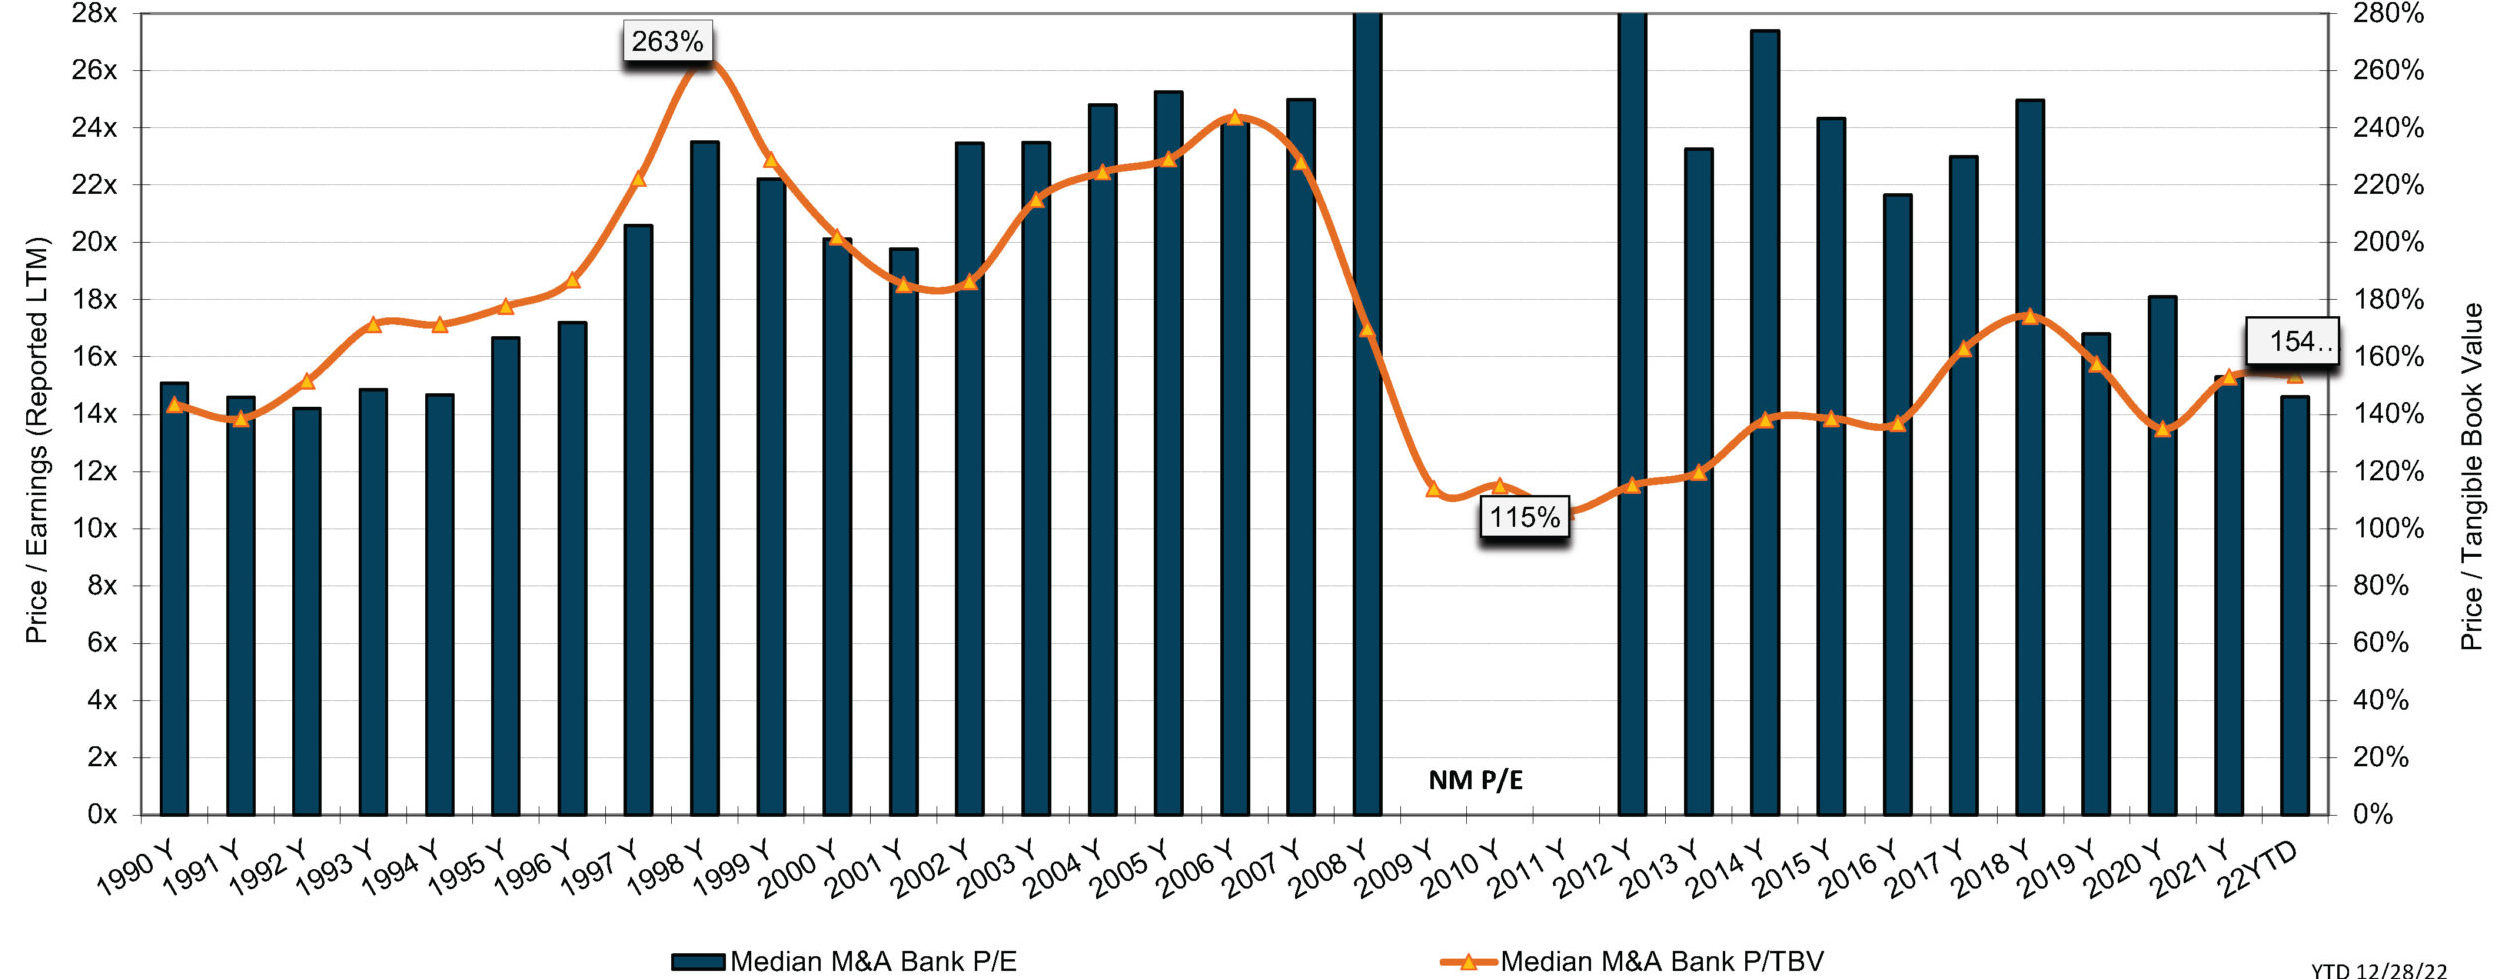
Pricing—as measured by the average price/tangible book value (P/TBV) multiple—was unchanged compared to 2021. As always, color is required to explain the price/earnings (P/E) multiple based upon reported earnings.
The median P/TBV multiple was 154% in 2022. As shown in Figure 1, the average transaction multiple since the Great Financial Crisis (GFC) peaked in 2018 at 174% then declined to 134% in 2020 due to the impact of the short but deep recession on economic activity and markets.
The median P/E in 2022 eased slightly to 14.6x from 15.3x in 2021; however, buyers focus on pro forma earnings with fully phased-in expense saves that often are on the order of 7x to 8x unless there are unusual circumstances. Accretion in EPS is required by buyers to offset day one dilution to TBVPS and to recoup the increase in TBVPS that would be realized on a stand-alone basis as investors expect TBVPS payback periods not to exceed three years.
Figure 1 :: 1990-2022 National Bank M&A Multiples
Click here to expand the image above
Public Market Multiples vs Acquisition Multiples
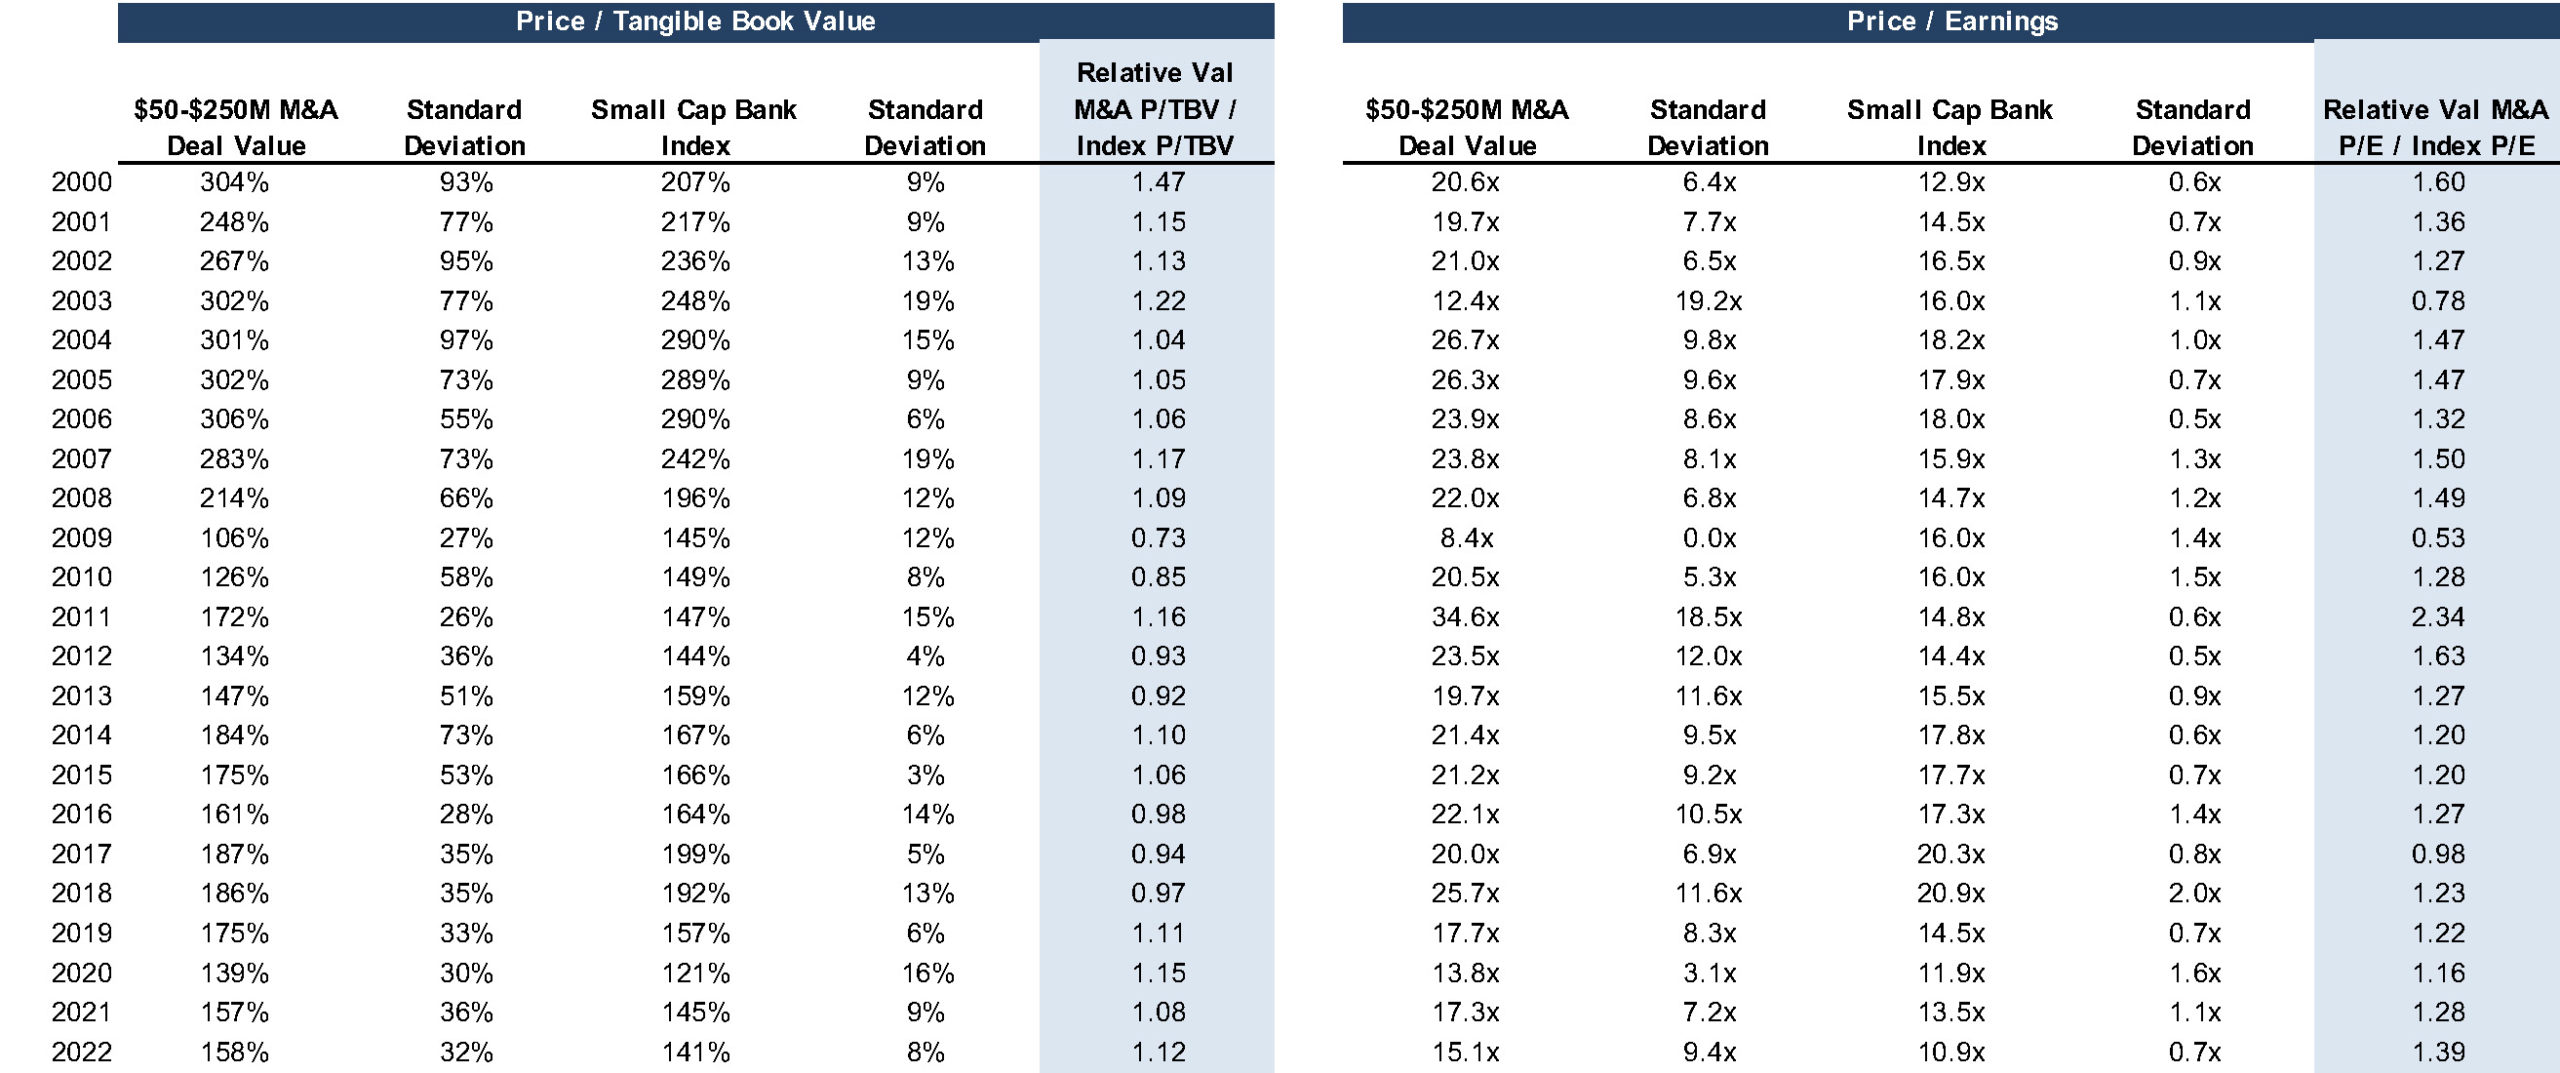
Figure 2 compares the annual average P/TBV and P/E for banks that were acquired for $50 million to $250 million since 2000 with the average daily public market multiple each year for the SNL Small Cap Bank Index.1 Among the takeaways are the following:
- Acquisition pricing prior to the GFC as measured by P/TBV multiples approximated 300% except for the recession years of 2001 and 2002 when the average multiples were 248% and 267%.
- Since 2014, average P/TBV multiples have been in the approximate range of 160% to 180% except for 2020.
- The reduction in both the public and acquisition P/TBV multiples since the GFC reflects a reduction in ROEs for the industry since the Fed adopted a zero-interest rate policy (ZIRP) other than 2017-2019 and 2022.
- Since pooling of interest accounting ended in 2001, the “pay-to-trade” multiple as measured by the average acquisition multiple relative to the average index multiple has remained in a relatively narrow range of roughly 0.9 to 1.15 other than during 2009 and 2010.
- P/E multiples based upon unadjusted LTM earnings have approximated or exceeded 20x prior to 2019 compared to 14-18x since then.
- Acquisition P/Es have tended to reflect a pay-to-trade multiple of 1.25 since the GFC but the pay-to-trade multiples are comfortably below 1.0x to the extent the pro forma earnings multiple is 7-8x, the result being EPS accretion for the buyer.
Figure 2 :: 2000-2022 Acquisition Multiples vs Public Market Multiples
Click here to expand the image above
Figure 3 :: 2000-2022 M&A TBV Multiples vs. Index TBV Multiples
Click here to expand the image above
Premium Trends Subdued
Investors often focus on what can be referred to as icing vs the cake in the form of acquisition premiums relative to public market prices. Investors tend to talk about acquisition premiums as an alpha generator, but long-term performance (or lack thereof) of the target is what drives shareholder returns.
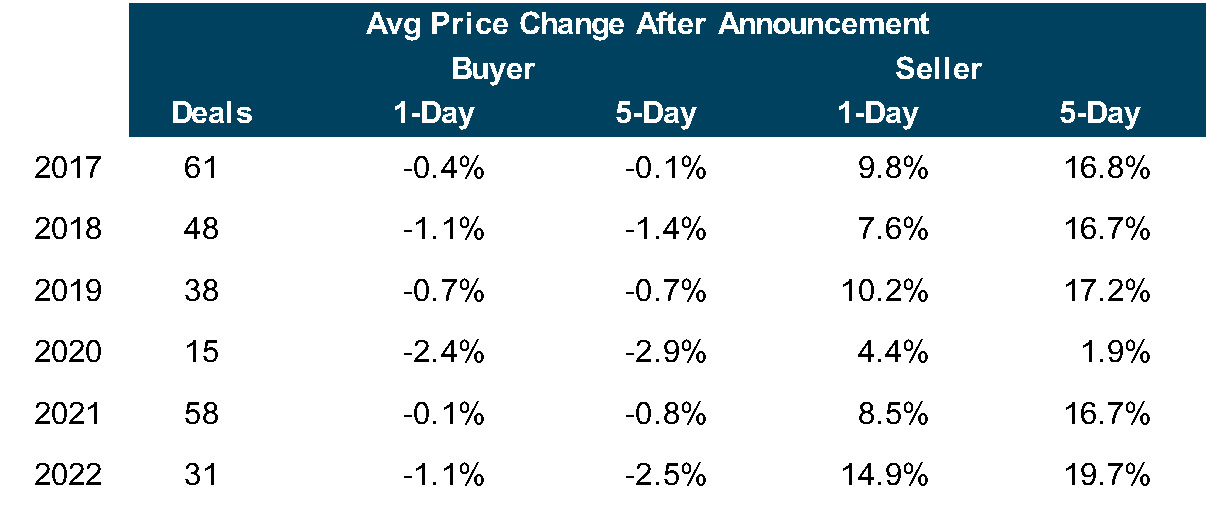
As shown in Figure 4, the average five-day premium for transactions announced in 2022 that exceeded $100 million in which the buyer and usually the seller were publicly traded was about 20%, a level that is comparable to recent years other than 2020. For buyers, the average reduction in price compared to five days prior to announcement was 2.5%. There are exceptions, of course, when investors question the pricing (actually, the exchange ratio), day one dilution to TBVPS and earn-back period. For instance, Provident Financial (NASDAQ: PFS) saw its shares drop 12.5% after it announced it would acquire Lakeland Bancorp (NASDAQ: LBAI) for $1.3 billion on September 27, 2022.
Figure 4
About Mercer Capital
M&A entails a lot of moving parts of which “price” is only one. It is especially important for would be sellers to have a level-headed assessment of the investment attributes of the acquirer’s shares to the extent merger consideration will include the buyer’s common shares. Mercer Capital has 40 years of experience in assessing mergers, the investment merits of the buyer’s shares and the like. Please call if we can help your board in 2023 assess a potential strategic transaction.
MedTech & Device – Industry Scan 2022
For this quarterly update, we bring together a couple of strands of our medtech and device industry practice. First, as long-term observers, public market developments in 2022 were interesting and perhaps marked an inflection point for the short to medium term. Second, in October, we attended a medtech industry conference, where we were able to gather a rich set of perspectives. The implications for some of the larger companies in the space are probably clear-cut. The downstream reverberations to private, development stage companies may be less straightforward. Nevertheless, since development stage companies are typically constrained by currently available funds and continually contemplating the next funding round, these developments are of critical importance.
2022: A Brief Review
A tumultuous year in the public markets is coming to a close. By the end of the third quarter 2022, the S&P 500 was down nearly 25%, marking a near-bottom for the year. The broader medtech and devices industry largely followed suit. On the brighter side, established large, diversified companies, while lagging their own previous benchmarks, outperformed the broader market. As a group, some biotech and life sciences companies (see next section) also seemed to fare relatively well. A closer look reveals that within the group some of the larger companies with more diversified revenue bases and, perhaps more importantly, profitable operations performed much better than smaller companies promising higher growth but deferred profits.
Current profitability also appeared to differentiate better stock price performers among the medical device and healthcare technology companies. At the same time, negative sentiment was more apparent for wide swathes of these two groups compared to the broader industry. It is obvious in hindsight but over the course of 2022, as interest rates rose and remained high, markets seemed to prefer existing earnings and nearer-term cash flows over future (rosier) prospects.
The shift towards more caution also manifested in other measures of market sentiment and activity. Wholesale downward revisions of earnings (growth) estimates have not occurred so far (this may yet come to pass), so much of the price decline reflects compressing valuation multiples. The pace of M&A transactions, which had gone from strength to strength during 2020 and 2021 despite myriad disruptions and distractions, decelerated significantly in 2022. By our measure, total transactions volume in the industry through the first three quarters of 2022 was roughly equal to that of just the fourth quarter of 2021. The number of IPOs also slowed to a trickle.
Looking Ahead to 2023 and Beyond: A Few Notes for Development Stage Companies
No industry is an island but as we and others have pointed out, several long-term trends, demographic and otherwise, suggest a favorable overall outlook for the medtech and device space. Even against the seemingly dour recent market backdrop, a multitude of attendees at the medtech conference agreed on the relative merits of the industry compared to the broader economy and market. We work with a number of development stage medtech and device companies over the course of a typical year. From that perspective, we find the long-term trends interesting because of the structural emphasis on continual innovation that improve outcomes for patients and clinicians.
A defining feature of medtech innovation funding is that it occurs over multiple tranches as the technologies and companies achieve various developmental milestones. In this context, some observations for development stage companies:
An obvious first order effect of the recent public market developments over the past year is that development stage companies should expect generally lower valuations for funding rounds (at least) over the next couple of years.
Lackluster exit activity, via either M&A or IPO, delays and/or reduces deployable capital for venture capital funds, which will make them more cautious in considering investment decisions.
The sentiment shift towards more caution is shared by all investors, although the degrees will differ. Accordingly, in addition to valuation compression, some types of companies (for example, those at the pre-clinical stage) will find fundraising to be extremely difficult.
As a corollary, investors are likely to prize clean clinical data. Companies focused on demonstrating good clinical outcomes will be better prepared for future funding rounds.
Similarly, companies that can stretch their existing funds until they can achieve a good (clinical) milestone will be better rewarded in the next funding round.
Commercial traction after hurdling regulatory approval remains an important structural consideration, especially for the non-corporate investors.
Wrap-up
Beyond the near-term market dynamics, a key conference takeaway for us was that the medtech funding eco-system is deep and diverse. We met and heard from traditional venture capital investors, corporate investors, and folks who operate in the continuum between them. The goals for the various investors differ to some degree, with some focused on financial attributes while others (like corporate VCs) include strategic considerations in the mix. Investors with broader goals and considerations are, to an extent, less sensitive to the prevailing market conditions and can afford to take a longer-term view. Even among these investors, financial terms and preferred deal structures vary considerably.
For development stage companies contemplating fundraising efforts, a deep and diverse investor eco-system can provide plenty of optionality. In keeping with a recurring theme of this update, a note of caution – evaluating a potential funding round requires both an examination of the financial terms and an understanding of the structural features and their longer-term implications.
Mercer Capital has broad experience in providing valuation services to medtech and device start-ups, larger public and private companies, and private equity and venture capital funds involved in the sector. Please contact us to discuss how we may be of help.
For a more in-depth review of the industry, take a look at our most recent newsletter.
5 Things to Know About the SEC’s New Pay Versus Performance Rules
In August 2022, the SEC adopted final rules implementing the Pay Versus Performance Disclosure required by Section 953(a) of the Dodd-Frank Act. These rules go into effect for the 2023 proxy season and introduce significant new valuation requirements related to equity-based compensation paid to company executives. What does this mean, and how does it apply to you? What are the requirements, and why might there be significant valuation challenges involved? We discuss all that and more below.
Executive Summary
- The new SEC proxy disclosure rules introduce several new requirements, including that registrants calculate and disclose a new figure (Compensation Actually Paid), alongside existing executive compensation information. For most registrants, the rules will apply to upcoming 2023 proxy season.
- A new Pay Versus Performance table will detail the relationship between the Compensation Actually Paid, the financial performance of the registrant over the time horizon of the disclosure, and comparisons of total shareholder return.
- The newly introduced concept of Compensation Actually Paid will require companies to measure the period-to-period change in the fair value of all equity-based compensation awarded to named executive officers.
- The type of equity awards that have been granted will determine the complexity of the valuation process. Equity-based awards such as stock options might require updated Black Scholes or lattice modeling, while awards with performance or market conditions may require more complex Monte Carlo simulations.
- Registrants should understand that if equity awards have been granted on a consistent basis for a period of years, the new rules could require a large number of historical valuations for this initial proxy season and a significant amount of disclosure complexity.
Advance planning and processes will be needed to establish the scope and complexity of complying with the new rules, including identifying how many equity-based awards will require updated valuations to measure the period-to-period changes.
1. Overview and Background
The new disclosures were mandated by the Dodd-Frank Wall Street Reform and Consumer Protection Act and were originally proposed by the SEC in 2015. These rules will add a new item 402(v) to Regulation S-K and are intended to provide investors with more transparent, readily comparable, and understandable disclosure of a registrant’s executive compensation. The new provisions apply to all reporting companies other than (i) foreign private issuers, (ii) registered investment companies, and (iii) emerging growth companies.
The rules apply to any proxy and information statement where shareholders are voting on directors or executive compensation that is filed in respect of a fiscal year ending on or after December 16, 2022. As such, the vast majority of registrants will be required to include related disclosure for their 2023 proxy statements, though there are relaxed requirements for smaller reporting companies.

The new SEC proxy disclosure rules introduce several new requirements, including that registrants calculate and disclose a new figure (Compensation Actually Paid), alongside existing executive compensation information. For most registrants, the rules will apply to upcoming 2023 proxy season.
2. The Pay Versus Performance Table
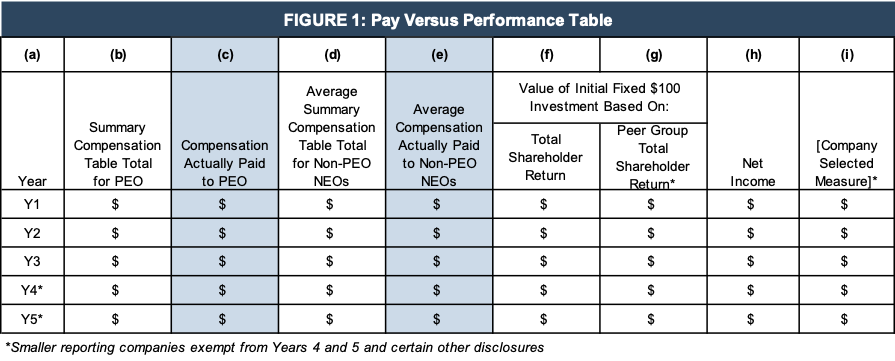
The new rules require registrants to describe the relationship between the Executive Compensation Actually Paid (“CAP”) and the financial performance of the registrant over the time horizon of the disclosure. Additional items include disclosure of the cumulative Total Shareholder Return (“TSR”) of the registrant, the TSR of the registrant’s peer group, the registrant’s net income, and a company-selected measure chosen by the registrant as a measure of financial performance. These items are to be disclosed in tabular form (based on an example included in the final rule), which is replicated below.
Click here to expand the table above
The table includes the following components:
- Year. The form applies to the five most recent fiscal years (or three years for smaller reporting companies)
- Summary Compensation Table Total for Primary Executive Officer (PEO). These are the same total compensation figures as reported under existing SEC proxy disclosure requirements. However, additional columns may need to be added if there was PEO turnover in the relevant periods.
- Compensation Actually Paid to PEO. For each fiscal year, registrants are required to make adjustments to the total PEO compensation reported in Item (b) for pension and equity awards that are calculated in accordance with US GAAP. This item is potentially complex and is discussed in detail below.
- Average Summary Compensation Table Total for Non-PEO Named Executive Officers (NEOs). These average figures would be calculated using the same compensation figures as reported under existing SEC proxy disclosure requirements for NEOs. Different individuals may be included in the average throughout the five (or three) year period. Footnote disclosure is required to list the individual NEOs.
- Average Compensation Actually Paid to Non-PEO NEOs. These amounts would be calculated using the same methodology as in Item (c), but then averaging the amounts in each year.
- Total Shareholder Return. The registrant’s TSR is to be determined in the same manner as is required by existing Regulation S-K guidance. TSR is calculated as the sum of (1) cumulative dividends (assuming dividend reinvestment) and (2) the increase or decrease in the company’s stock price for the year, divided by the share price at the beginning of the year.
- Peer Group Total Shareholder Return. This is calculated consistently with the methodology used for Item (f). Registrants are required to use the same peer group they use for existing performance graph disclosures or compensation discussion and analysis.
- Net Income. This is simply GAAP net income for the relevant period.
- Company Selected Measure. This item is intended to represent the most important financial performance measure the registrant uses to link compensation paid to its PEOs and other NEOs to company performance. The registrant can select a GAAP or non-GAAP financial measure.
The remainder of this article focuses on the two shaded columns (c) and (e) which address Compensation Actually Paid and the valuation inputs that support these disclosures.

A new Pay Versus Performance table will detail the relationship between the Compensation Actually Paid, the financial performance of the registrant over the time horizon of the disclosure, and comparisons of total shareholder return.
3. What Is Compensation Actually Paid?
For each fiscal year, registrants are required to adjust the total compensation reported in Columns (b) and (d) for pension and equity awards that are calculated in accordance with US GAAP. The following table describes these adjustments in detail.
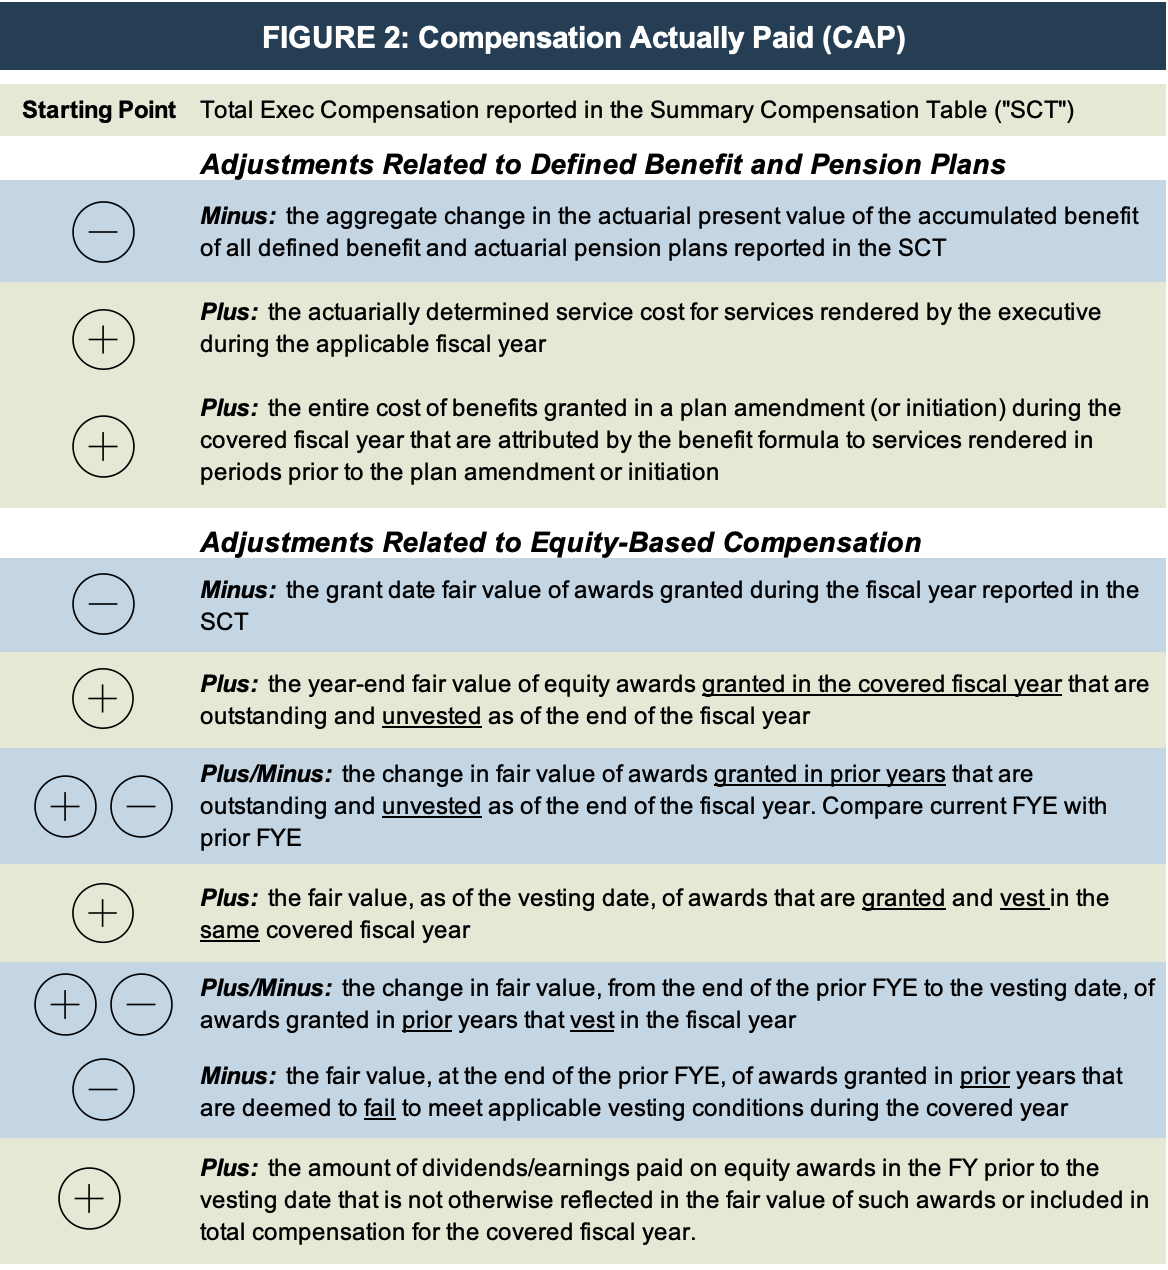
The pension-related adjustments should be calculated using the principles in ASC 715, Compensation – Retirement Benefits. The equity-based compensation adjustments will require registrants to disclose the fair value of equity awards in the year granted and report changes in the fair value of the awards until they vest. This means that it will be necessary to measure the year-end fair value of all outstanding and unvested equity awards for the PEO and other NEOs under a methodology consistent with what the registrant uses in its financial statements. For most registrants, this will be ASC 718, Compensation – Stock Compensation.
Appropriate footnote disclosure may also be required to identify the amount of each adjustment and any valuation assumptions that materially differ from those disclosed at the time of the equity grant.

The newly introduced concept of Compensation Actually Paid will require companies to measure the period-to-period change in the fair value of all equity-based compensation awarded to named executive officers.
4. What Are the Different Types of Equity Awards?
The procedures used to calculate fair value will vary depending on the type of equity award.
- For restricted stock and restricted stock units (RSUs), fair value can be calculated using observed share prices at the grant date, fiscal year-end, and the vesting date. The change in fair value would simply be the difference between these dates.
- For stock options and stock appreciation rights (SARs), fair value at the grant date is often calculated using a Black-Scholes or lattice model. Therefore, updated fair values at year-end and at the vesting date should be based on updated assumptions in those models, including current stock price, volatility, expected term, risk-free rate, dividend yield, and consideration of a sub-optimal exercise factor (in a lattice model). Care should be taken to ensure that expected term appropriately considers moneyness of the options at the new date. The use of historical and/or option-implied volatility should be evaluated for consistency and continued applicability.
- For performance shares and performance share units (PSUs), the fair value calculations may be more complex due to the presence of a performance condition (e.g., the award vests if revenues increase by 15% and EBITDA margin is at least 20%) or a market condition (e.g., the award vests if the registrant’s total shareholder return over a three-year period exceeds its peer group by at least 5%). The performance condition will require updated probability estimates at year-end and at the vesting date. Awards with market conditions are typically valued at their grant date using Monte Carlo simulation and so a reassessment at subsequent dates using a consistent simulation model with updated assumptions will be necessary.

The type of equity awards that have been granted will determine the complexity of the valuation process. Equity-based awards such as stock options might require updated Black Scholes or lattice modeling, while awards with performance or market conditions may require more complex Monte Carlo simulations.
5. Special Considerations for Market Condition Awards Using Monte Carlo Simulation
Market condition awards come in many different flavors. Three of the most common types of plans include:
- Market condition based upon performance in the registrant’s own stock. In this plan, vesting might be achieved if the registrant’s share price exceeds a certain level for a defined number of trading days or reaches an agreed-upon measure of total shareholder return.
- Market condition based upon relative total shareholder return. In this plan, the award vests based upon the registrant’s TSR in comparison to a similarly calculated TSR for a broad market benchmark index, an industry index, a peer company, or group of peer companies. Some plans employ a modification factor that adjusts the size of the award based upon varying levels of relative TSR performance.
- Market condition based upon ranked total shareholder return. In these plans, award vesting is based upon a numerical ranking of the registrant’s TSR against the TSRs of a group of peer companies or all of the companies on a particular broad market or industry index. The numerical or percentile ranking then determines the modification factor that adjusts the size of the award.
Each of the above plans has inputs and assumptions that drive the Monte Carlo simulation. When performing a subsequent year-end or vesting date fair value analysis, each of the grant-date assumptions will need to be reevaluated. For example, for a relative TSR plan with a three-year term, the subsequent year-end valuations will necessarily have shorter terms (2-year and 1-year), which will require new inputs for volatility and correlation factors. Shorter terms may make the use of option-implied volatility more relevant if sufficient market data is available.
For relative TSR plans that reference a group of companies or an index, some of the peers may have been acquired or merged in the subsequent periods. The plan documentation will often describe the steps to be taken when the composition of the peer group changes or there is a change in the benchmark index. A different group (or number) of companies will affect the correlation assumption as well as the percentile calculations in a ranked plan.
Regardless of the type of plan, it is important for registrants to understand how even a relatively simple award, if granted consistently for a period of years, can lead to a large number of Monte Carlo simulations for this initial proxy season and a significant amount of disclosure complexity.
As shown in Figure 3 below, if a company has made annual PSU grants (with a market condition) for each of the last five years, then up to eight Monte Carlo valuations could be required to calculate the CAP in each period.
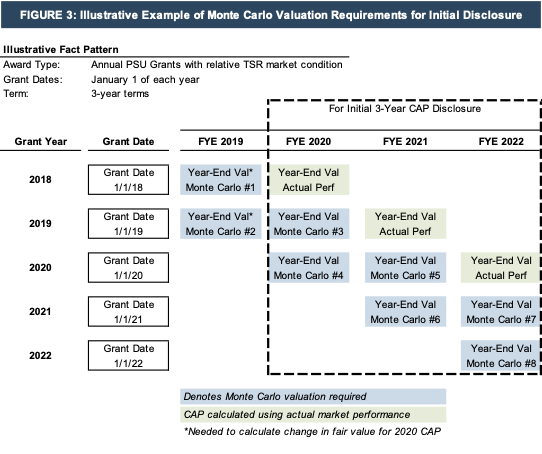
Click here to expand the example above
In the example above, the blue boxes indicate when a valuation of prior grants would be necessary to calculate the change in fair value for each period of the CAP disclosure. For the final period of a relative TSR market condition plan, the company could use the actual market performance of its stock (and the comparative index) to calculate the expected value of the award.

Registrants should understand that if equity awards have been granted on a consistent basis for a period of years, the new rules could require a large number of historical valuations for this initial proxy season and a significant amount of disclosure complexity.
Summary and Next Steps
While the new SEC Pay Versus Performance disclosure rules can seem daunting, they can be managed with proper planning and a systematic approach. For the CAP disclosures, registrants need to understand the details of all equity awards that have been awarded to named executive officers (how many and what type of award). The award characteristics will determine which valuation method is most appropriate and how many valuations need to be performed.
If you have questions about the valuation techniques used for the various types of equity compensation awards or would like to discuss the process, please contact a Mercer Capital professional.
Bond Portfolio Update
The U.S. bond market is undergoing its worst bear market in decades. Barclays U.S. Aggregate Bond Market Index produced a total return of negative 14.5% through September 30, 2022 and negative 16.0% through November 8, 2022. Excluding coupon income, the year-to-date loss was 17.2% which speaks to how low coupon income is given the nominal difference between price change and total return.

Click here to expand the image above
As shown in the figure below, U.S. commercial banks have suffered unrealized losses in their bond portfolios equal to roughly 10% of the cost basis of both AFS and HTM classified portfolios as of September 30, which compares to a price reduction of 15.6% in the Barclay’s index as of quarter end.
The less-worse performance by U.S. banks likely reflects less duration than the index, which has an effective duration of 6.25 years and weighted average maturity of 8.25 years. Our observation is that for the most part outsized losses among U.S. banks reflect an outsized position in municipals and/or MBS. The index composition is heavily skewed to U.S. Treasuries and U.S. Agency obligations given the heavy issuance of government backed debt the past 15 years or so.
While management and directors at most banks are unhappy with their bond portfolios, institutional investors have taken a more nuanced view of the impact of rising rates based upon the tenor of third quarter earnings calls and the reaction of most stocks upon the release of earnings. Rising rates have supported bank earnings even though fixed-rate loan and bond portfolios are slow to reprice as floating-rate loans have repriced and banks have lagged deposit rates.
Investor concern is more focused on liquidity risks. Some (or many) banks eventually may have to raise deposit rates sharply to stem outflows and/or fund loan growth because selling bonds is not a viable option given the magnitude of unrealized losses that if realized will reduce regulatory capital.
Our prior commentary on bank bond portfolios following the release of the first and second quarter Call Reports can be found here and here.
Community Bank Loan Portfolios Have Unrealized Losses Too
Fixed income is undergoing one of the deepest bear markets in decades this year. There has been a lot of discussion surrounding the impact of rising rates on bank bond portfolios and bank stocks as rising rates have resulted in large unrealized losses in bank bond portfolios. My colleague, Jeff Davis, provides an update to his previous commentary on the topic based on third quarter Call Report data here.
If subjected to mark-to-market accounting like the AFS securities portfolio, most bank loan portfolios would have sizable losses too given higher interest rates and wider credit spreads; however, unrealized “losses” in loan portfolios do not receive much attention because there is not an active market for most loans unlike most bonds that populate bank portfolios. Further, accounting standards do not mandate mark-to-market for loans other than those held-for-sale.
While the trend in loan portfolio fair values is harder to examine given the lack of data, the following charts provide some perspective based on a survey of periodic loan portfolio valuations by Mercer Capital. To properly evaluate a subject loan portfolio, the portfolio should be evaluated on its own merits, but markets do provide perspective on where the cycle is and how this compares to historical levels.
Fair value is guided by ASC 820 and defines value as the price received/paid by market participants in orderly transactions. It is a process that involves a number of assumptions about market conditions, loan portfolio segment cash flows inclusive of assumptions related to expected prepayments and expected credit losses, appropriate discount rates, and the like.
The fair value mark on a subject loan portfolio includes two components – an interest rate mark and a credit mark. The interest rate mark is driven by the difference in the weighted average discount rate and weighted average interest rate of the subject portfolio. The discount rate that is applied to a subject loan should reflect a rate consistent with the expectations of market participants for cash flows with similar risk characteristics. The credit mark captures the risk that the borrower will default on payments and not all contractual cash flows will be collected.
Since the end of 2021, rising market interest rates have been the predominant factor driving the change (i.e., reduction) in loan portfolio fair values. As shown in Figure 1, the median interest rate mark for our data sample has fallen from a modest 0.55% premium at December 31, 2021 to a 5.65% discount as of September 30, 2022. While bank earnings benefit from a higher rate environment and net interest margin expansion, it takes time for the increase in market rates to be passed on to customers via higher loan rates and for lower, fixed-rate loans to roll out of the portfolio. In talking with Mercer Capital clients and in our loan portfolio valuation practice, so far it seems that banks have been unable to fully pass on the increase in rates to loan customers.
Figure 1: Trends in Interest Rate Marks

Click here to expand the image above
The shift in the valuation adjustment attributable to interest rates reflects an increase in market interest rates. Figure 2 depicts the LIBOR forward curve at December 31, 2021, March 31, 2022, June 30, 2022, and September 30, 2022. Relative to December 31, 2021, forward LIBOR rates have increased 66 bps to 394 bps on average with the largest increases occurring for periods ranging from 1 to 12 months following the valuation date.
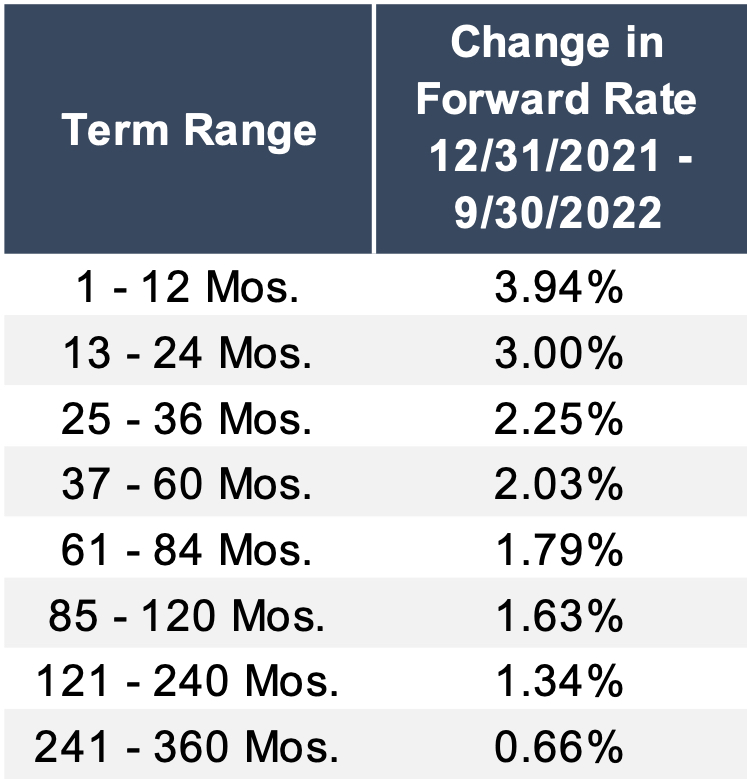
Figure 2: LIBOR Forward Curve
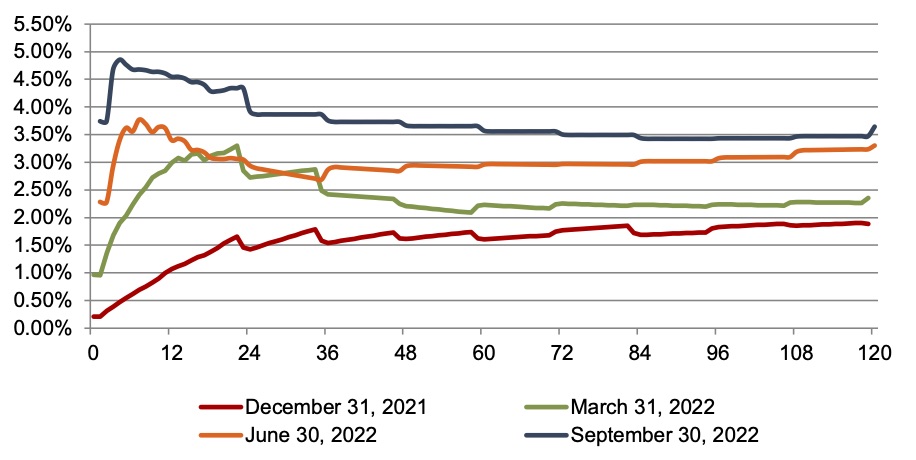
Figure 3 depicts the trend in the credit mark for our data sample relative to credit spreads. Credit spreads provide perspective on a number of factors, including where the credit cycle has been and where we may be headed.
Figure 3: Trends in Credit Marks

Click here to expand the image above
Over the period shown in Figure 3, credit marks peaked at the start of the pandemic given the uncertainty and expectation of higher losses on loan portfolios. Credit marks trended down from the March 31, 2020 peak through the first quarter of 2022, as did banks’ loan loss provisions, as credit quality remained stable. While credit quality continues to remain strong, both credit spreads and credit marks have ticked up in 2022 with the weakening economic outlook and concerns that the Federal Reserve’s tightening interest rate policy may trigger a sharper downturn in economic activity.
Mercer Capital has extensive experience in valuing loan portfolios and other financial assets and liabilities including depositor intangible assets, time deposits, and trust preferred securities. Please contact us if we can be of assistance.
2022 Family Law Team Conference Wrap-Up
In-person conferences are back in 2022 and so are we. Our professionals have been speaking at and attending numerous conferences, so we thought it a good idea to reflect on a few of these conferences and share selected PowerPoint decks with you. Why? Because there are valuable materials on valuation, forensic and financial topics included in these PowerPoint decks. If your organization needs a speaker at your next conference or meeting, feel free to contact us.
We hope you have enjoyed our content in 2022 and we look forward to connecting further in 2023!
Selected Speaking Engagements
Nashville Bar Association | February 28, 2022
Business Valuations in Litigation:
A Guide for Attorneys
Scott A. Womack, ASA, MAFF
In this presentation, we ask and answer the questions “what is the purpose of a business valuation?”, “when and why a valuation is needed?” and explore what to look for in a valuation expert. In addition, this presentation provides an overview of valuation approaches and common valuation discounts. Active vs. passive appreciation and personal vs. enterprise goodwill are also presented. If you need a solid valuation overview, download the deck.

Knoxville Estate Planning Council | March 24, 2022
The Art and Science of Business Valuations:
A Guide for Attorneys/Advisors
Scott A. Womack, ASA, MAFF
Is valuation an art or a science? This presentation begins with an overview of valuation theory. In addition, we include common flaws in valuations, provides an example of double/triple counting, and includes a valuation report checklist. For more, download the powerpoint deck.

AAML Connecticut Chapter May CLE Meeting | May 2, 2022
The Double Dip … Debate – Plus: Does Personal / Enterprise Goodwill Factor into the Analysis?
Karolina Calhoun, CPA, ABV, CFF
Particularly when the marital estate includes a business asset, subject to a valuation, the topic of double counting must be considered. Is the same income stream which is creating a valued asset on the marital balance sheet also being used for income determination for support? Or, has compensation and business earnings properly been allocated to the asset and to the income? Further, what if there is a carve out to personal goodwill – how, if at all, does this impact the asset division as well as the income basis for support? We address these questions in this presentation.

2022 Forensic Accounting and Litigation Conference:
Society of Kentucky Certified Public Accountants | August 18, 2022
Critical Issues in Valuation for Divorce Purposes
Karolina Calhoun, CPA, ABV, CFF
What are the nuances and critical issues of valuation, forensic, and other analyses for marital dissolution? In this presentation, we delve into specific issues that must be considered since they are unique to marital dissolution as well as state statute and precedent. Specifically, we touch on if a marital asset ever become a separate asset or vice-versa, personal vs. enterprise goodwill, valuation adjustments in marital dissolution engagements, double-dipping, asset tracing, and how to construct a lifestyle (pay and need) analysis.

NACVA 2022 Business Valuation & Financial Litigation Hybrid Super Conference | August 19, 2022
The State of the Business Valuation Profession
Z. Christopher Mercer, FASA, CFA, ABAR
Chris Mercer is one of the founding fathers of business valuation. Given his place in the profession, he is one of the few qualified to opine to the future of the business valuation profession. In this presentation, he begins by discussing the profession’s current realities and then ventures into what the future might hold about the profession, valuation theory, and how to reach the market.

2022 AAML/BVR National Divorce Conference 2022 | August 19, 2022
All in the Family-Related Companies in Divorce
Karolina Calhoun, CPA, ABV, CFF
In this presentation, our Karolina Calhoun along with Kevin Segler from Koons Fuller, covered all things related-party in divorce valuation, including entity structure issues, multi-layering with discounts, and tracing marital vs. separate asset ownership with complex multi-entity ownerships. Karolina and Kevin also discussed related parties in the business and said impact on ownership, valuation, and division – including the consideration of classes of stock in division, such as GP vs. LP or voting vs. non-voting.
The Association of Divorce Financial Planners 2022 Virtual Retreat | November 4, 2022
Business Valuation, Legal, and Tax Risks Panel
David W. R. Harkins, CFA, ABV
David Harkins joined Karen Shapiro of Stein Sperling and Michele Laws of Turning Point Financial Group on a panel moderated by Cheryl Panther of Panther Financial Planning, to discuss the nuances of a case study presented to members of the ADFP. The case had numerous potential pitfalls with considerations for attorneys and divorce financial planners alike. Topics included business valuation, fraud, forensics, separate vs marital, etc. The crowd had numerous thought-provoking questions which led to an enlightening dialogue for all involved.
The 2022 AICPA & CIMA Forensic & Valuation Services Conference | November 14, 2022
Personal vs. Enterprise Goodwill:
How the Analysis Lies Within the Facts
Karolina Calhoun, CPA, ABV, CFF
Karolina Calhoun and Audra Moncur of Wipfli, LLP tackled the questions: what is goodwill?; what is personal vs. enterprise goodwill?; and why is personal vs. enterprise goodwill important in valuations for divorce or transactions? They also presented an illustration of goodwill in transactions and presented case precedent for goodwill in divorce along with methods and considerations for determination allocation to personal and enterprise goodwill.
Selected Sponsorships
The AAML Florida Chapter 44th Annual Institute
As we assist with complex financial and valuation issues on many Florida matters, this year we decided to sponsor and attend the AAML Florida Chapter Annual Institute. We enjoyed meeting and seeing familiar faces, and also appreciated conversations about complex valuation and financial issues. Mercer Capital’s Litigation Team looks forward to attending in future years!
Attending the Conference was:
Karolina Calhoun, CPA, ABV, CFF
The AAML Foundation Lifetime Members Luncheon
November 10, 2022 | Chicago, Illinois
We were honored to be a Diamond Sponsor of the AAML Foundation Lifetime Members Luncheon, supporting the Foundation’s mission to assist families and children. Chris Mercer, Karolina Calhoun, and Scott Womack are members of the Forensic & Business Valuation Division of the AAML Foundation.
Attending the Luncheon were:
Scott A. Womack, ASA, MAFF
Karolina Calhoun, CPA, ABV, CFF
David W. R. Harkins, CFA, ABV
 |
 |
 |
The AAML Florida Chapter
|
2022 AICPA & CIMA Forensic & Valuation Services ConferencePictured (L-R): Bethany Hearn (CLA), Karolina Calhoun, Natalya Abdrasilova (BDM), and Nicole Lyons (WithumSmith+Brown) |
 |
 |
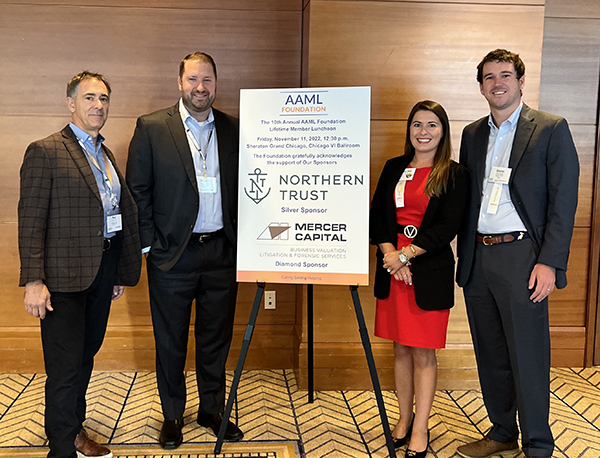 |
2022 AAML Foundation Lifetime Members LuncheonPictured (L-R): Scott Womack, Karolina Calhoun, and David Harkins |
2022 AAML Foundation Lifetime Members LuncheonPictured (;-R): David Harkins, Bill Dameworth (Forensic Strategic Solutions), Jay Fishman (Financial Research Associates), Karolina Calhoun, and Scott Womack |
2022 AAML Foundation Lifetime Members LuncheonPictured (L-R): Paul Thiel (Northern Trust), Scott Womack, Karolina Calhoun, and David Harkins |
How Are Tech-Forward Banks Performing?
In the year-to-date period, the KBW Nasdaq Bank Index has declined 22%, compared to a decline of 20% in the S&P 500 through October 27. Tech-forward banks have underperformed the broader banking sector, down 60% in the year-to-date period.1 This is a reversal of the trend in 2021 when tech-forward banks outperformed the broader banking sector, logging a 70% increase compared to an increase of 35% in the KBW Nasdaq Bank Index.
Figure 1 :: Year-To-Date Performance (Through October 27, 2022)
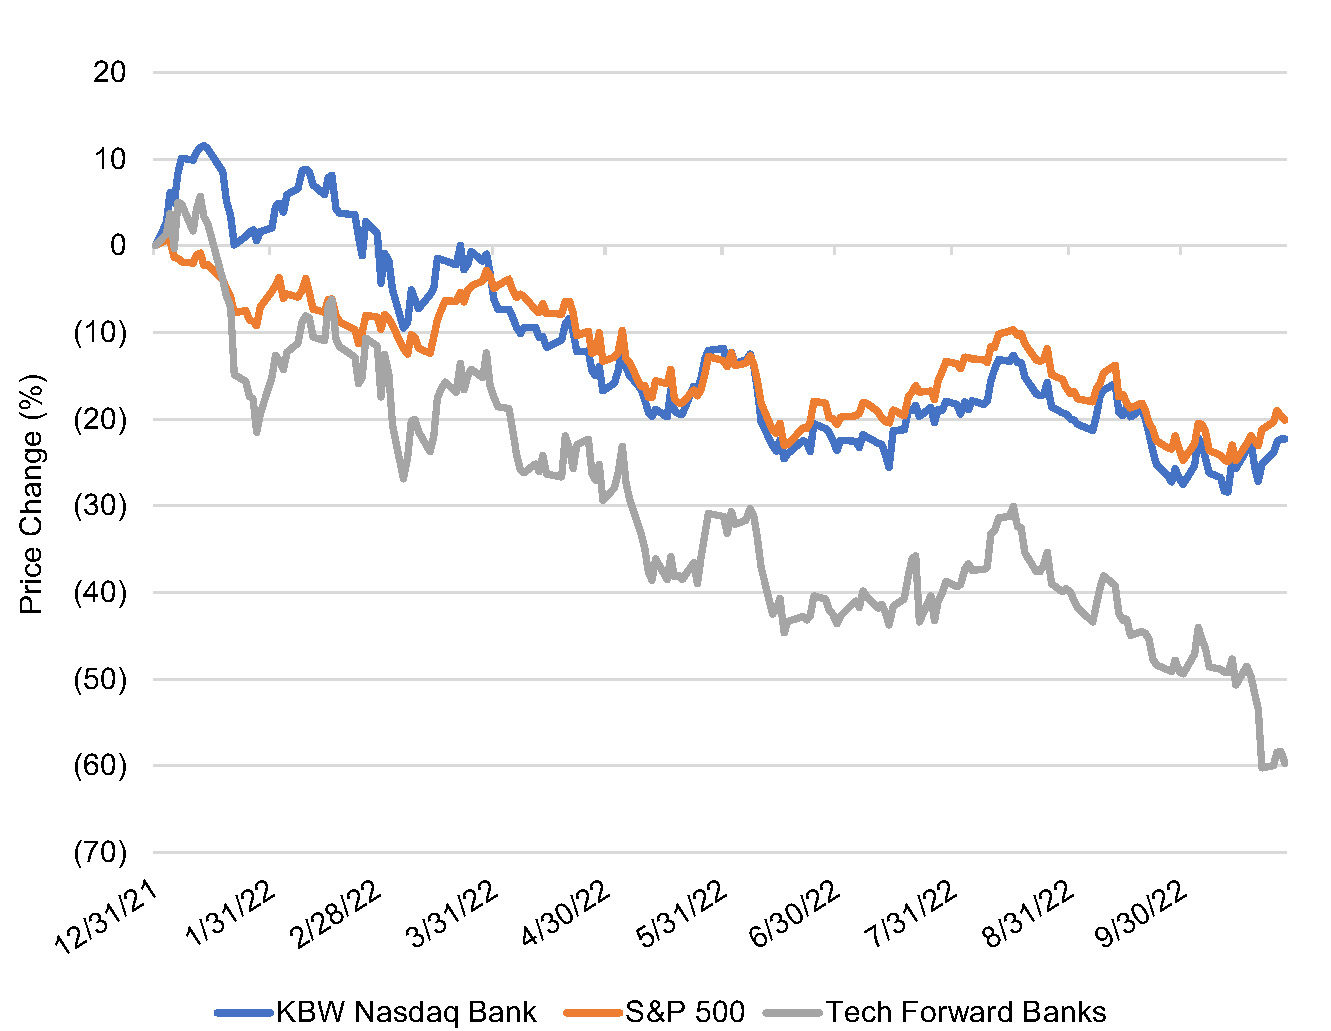 Source: S&P Capital IQ Pro.
Figure 2 :: 2021 Performance
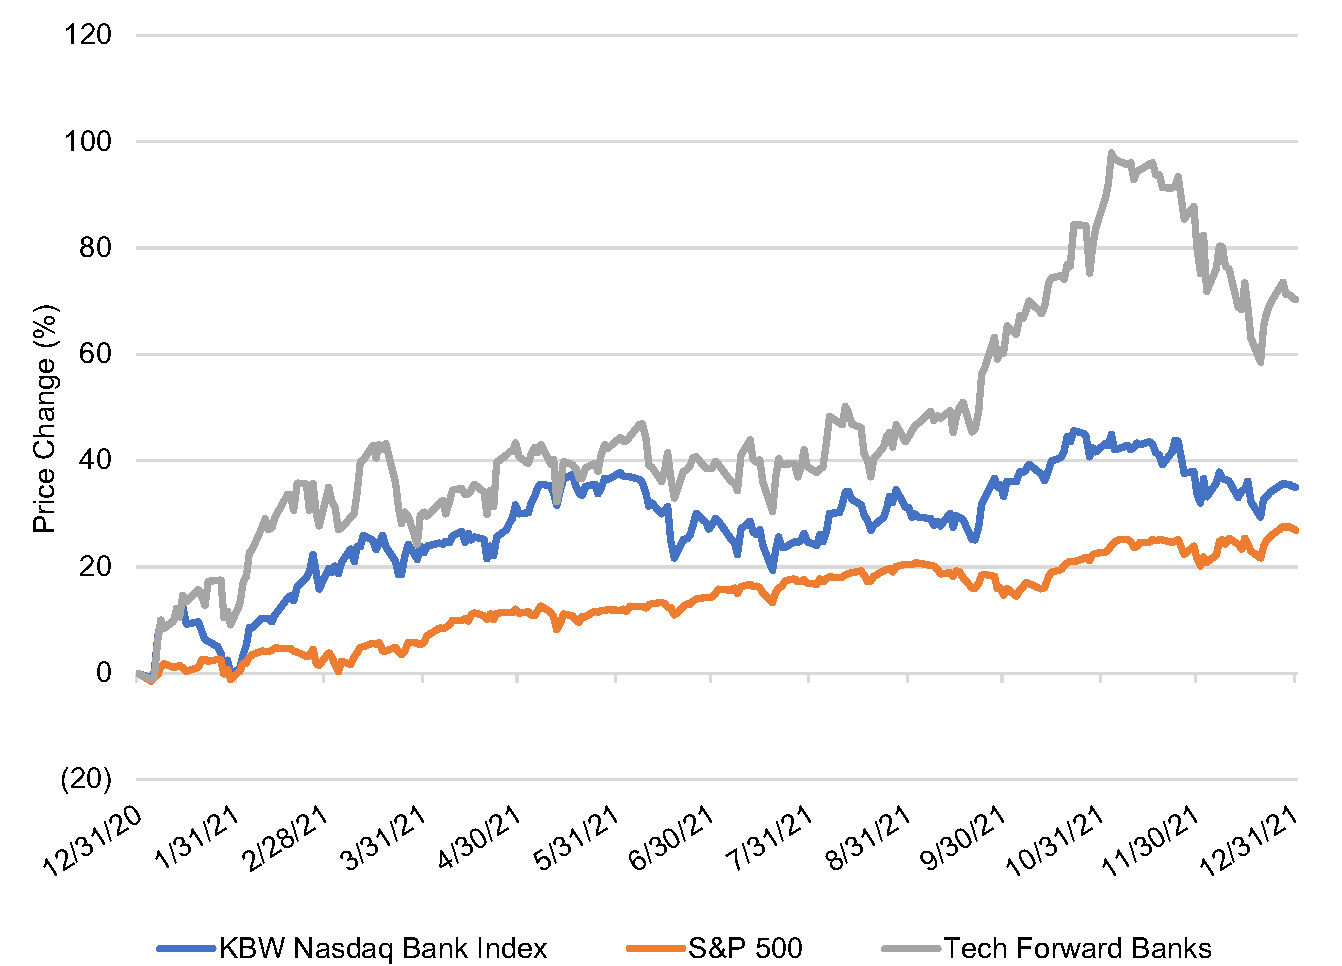
Source: S&P Capital IQ Pro.
The tech-forward bank landscape encompasses a variety of business models but generally refers to banks utilizing technology or partnering with fintechs to deliver financial products or services. Banks that partner with fintechs are often referred to as providing “banking as a service (BaaS)”. This model involves an FDIC member bank offering bank products to fintech customers, for example, credit and debit cards or personal loans. The bank holds the deposits associated with the accounts and earns a fee based on a percentage of interchange income specified in an agreement negotiated with the fintech partner. Other models are focused on facilitating payments or providing financial services to a specific niche, such as cryptocurrency.
While the largest banks have the resources to be at the forefront of technology adoption, many smaller banks have partnered with fintechs in recent years. This is due in part to the Durbin Amendment which places limits on interchange income for banks above $10 billion in assets. In many cases, the partnerships have accelerated growth and created new income streams for the bank partners.
However, bank partners also face unique risks. As displayed in the market performance, tech-forward banks have been more volatile than traditional banks. Tech-forward bank performance has been moored, to some degree, to more volatile technology stocks, which explains the stock market outperformance in 2021 followed by a larger retrenchment in 2022. For a community bank pursuing a fintech partnership strategy, there are multiple considerations, including the following.
Deposit Growth
Many fintech partner banks have continued growing deposits this year even though most banks have seen deposit growth stagnate or turn negative in the rising rate environment. An analysis performed by S&P Global Market Intelligence showed that fintech partner banks with assets between $1 billion and $3 billion experienced deposit growth of 15% (annualized) in the first half of 2022. This compares to deposit growth of 3% for commercial banks in the same asset size range.
The deposits generated from fintech partnerships are often noninterest bearing accounts, which are especially valuable in the current rising rate environment. Bank partners earn spread income from the deposits, often holding them at the Federal Reserve due to their volatility and uncertain duration. Balances at the Fed reprice immediately with changes to the Fed’s benchmark rate.
Noninterest Income
The largest impact on the revenue side typically shows up in noninterest income. Fintech partner banks tend to have a higher ratio of noninterest income to total income relative to traditional banks as they earn a share of the interchange income. In a period of flat or declining interest rates, this diversification of revenue can help to offset net interest margin compression.
For the tech-forward banks included in Figure 1 and 2, the median ratio of noninterest income to operating revenue was 29% in the trailing twelve
month period.
Concentration Risk
While fintech partnerships can be a source of growth, bank partners should be cautious about revenue or deposit concentrations. Fintechs can grow rapidly, and, as a result, a bank partner may develop a concentration within their deposit base or revenues. Banks must periodically renegotiate contracts with fintech partners, and there is a risk that the fintech will find another bank partner or demand more favorable terms. This single event could eliminate a major source of deposits or reduce noninterest income, causing a much greater impact than the ordinary loss of traditional bank customers.
For example, Green Dot Corporation (GDOT) provides the Walmart MoneyCard product and offers other deposit account products at Walmart. Green Dot’s second quarter 10-Q discloses that approximately 21% of its operating revenue in the year-to-date period was derived from products and services sold at Walmart locations.
Regulatory Risk
Regulators have stepped up their scrutiny of bank-fintech partnerships this year, focusing on risk management controls. Many banks partnering with fintechs have less than $10 billion in assets, and banks that do not currently serve fintechs may not have the necessary compliance infrastructure to effectively manage potential fintech relationships. Compliance capability must be built over a long period of time and serves as somewhat of a barrier to entry for banks desiring to pursue this strategy.
Additionally, certain fintech partnerships may present an added element of risk as the bank could be impacted by the regulatory and compliance practices of the fintechs or the evolving regulatory/compliance landscape. One recent example of this risk arose in the crypto fintech niche as the FDIC released an order to a crypto brokerage firm demanding that it cease and desist from making false and misleading statements about its deposit insurance status, while the FDIC contemporaneously issued an advisory to insured institutions regarding FDIC deposit insurance and dealings with crypto companies.2
Valuation & Performance
Bank stocks’ underperformance in 2022 has largely been attributed to economic uncertainty and the potential for recession brought on by the Fed’s aggressive rate hikes. Fintech partner banks have been more volatile than the broader banking market. The business models entail certain risks, as detailed above, that do not pertain to traditional banks to the same degree. In addition, the earnings from fintech partnerships are less predictable and potentially further out in the future.
As seen in figure 3, the range of valuation multiples observed for tech forward banks is wide, with forward P/Es ranging from 6.6x to 16.1x but most trade at 7x to 9x estimated 2023 earnings. It is important to note that the banks included in the table above represent a variety of sizes, strategies and niches, so comparability may be somewhat limited. Tangible book multiples likewise exhibit a wide range, but in general are high relative to the broader banking sector. In valuing fintech partner banks, investors weigh the growth potential provided by the partnership versus the risk that earnings growth does not materialize.
Figure 3 :: Multiples and Price Change of Tech-Forward Banks

Click here to expand the image above
Conclusion
Mercer Capital has experience valuing and advising both banks and fintechs. If you are considering partnership opportunities or have questions regarding their valuation implications, please contact us.
1Tech-forward banks include AX, CCB, GDOT, LC, LOB, MVBF, CASH, SI, SIVB, TBBK, and TBK. Year-to-date performance through 10/27/22
2https://www.arnoldporter.com/en/perspectives/advisories/2022/08/regulators-crack-down-on-fintechs
Five Trends to Watch in the Medical Device Industry: 2022 Update
Medical Devices Overview
The medical device manufacturing industry produces equipment designed to diagnose and treat patients within global healthcare systems. Medical devices range from simple tongue depressors and bandages to complex programmable pacemakers and sophisticated imaging systems. Major product categories include surgical implants and instruments, medical supplies, electro-medical equipment, in-vitro diagnostic equipment and reagents, irradiation apparatuses, and dental goods.
The following outlines five structural factors and trends that influence demand and supply of medical devices and related procedures.
1. Demographics
The aging population, driven by declining fertility rates and increasing life expectancy, represents a major demand driver for medical devices. The U.S. elderly population (persons aged 65 and above) totaled 40.3 million in 2021 (13% of the population). The U.S. Census Bureau estimates that the elderly will more than double by 2060 to 95 million, representing 23% of the total population.
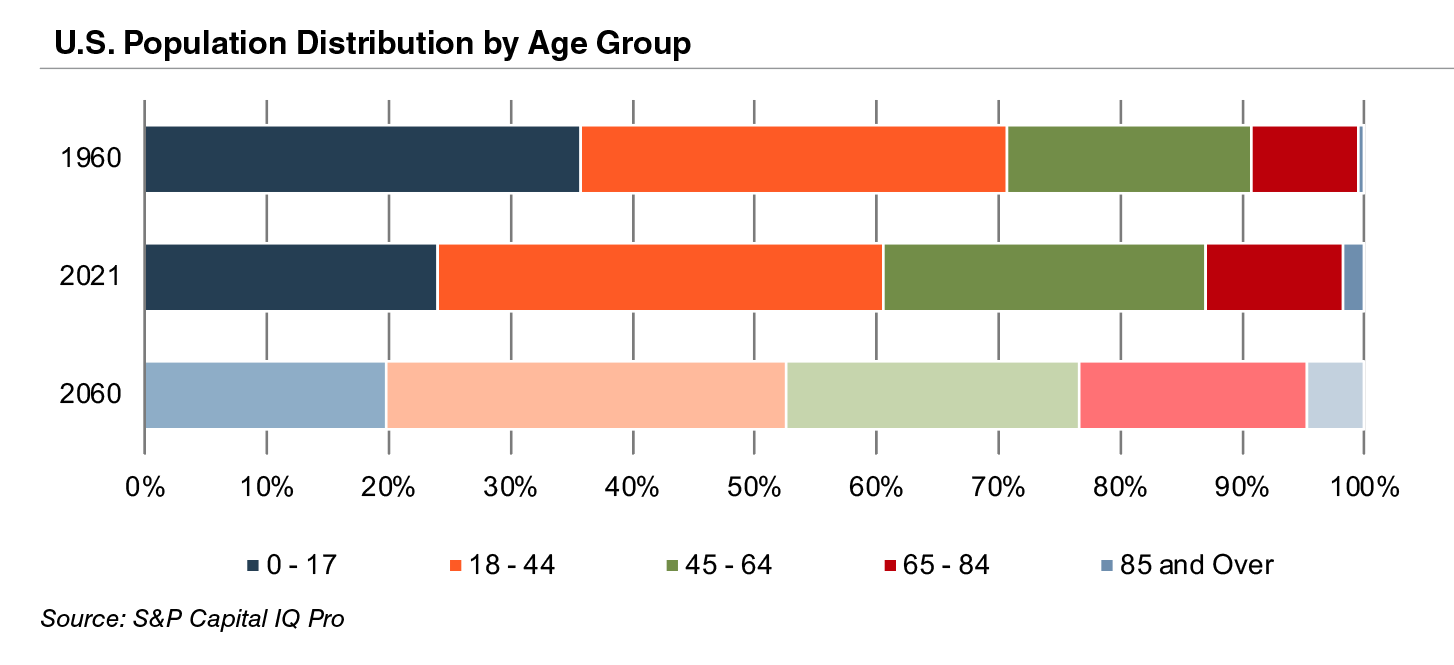
The elderly account for nearly one third of total healthcare consumption in the U.S. Personal healthcare spending for the population segment was approximately $19,000 per person in 2014, five times the spending per child (about $3,700) and almost triple the spending per working-age person (about $7,200).

According to United Nations projections, the global elderly population will rise from approximately 608 million (8.2% of world population) in 2015 to 1.8 billion (17.8% of world population) in 2060. Europe’s elderly are projected to reach approximately 29% of the population by 2060, making it the world’s oldest region. While Latin America and Asia are currently relatively young, these regions are expected to undergo drastic transformations over the next several decades, with the elderly population expected to expand from approximately 8% in 2015 to more than 21% of the total population by 2060.
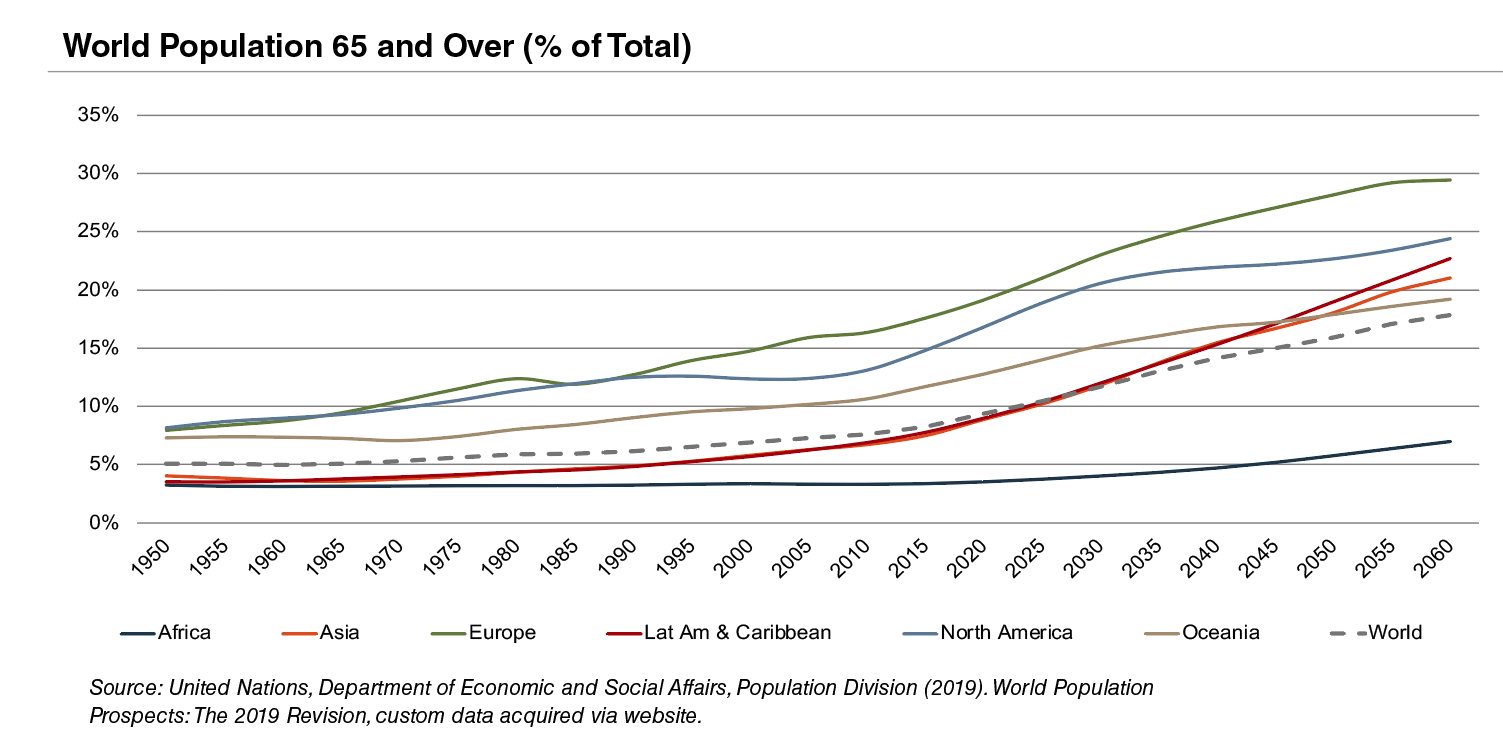
2. Healthcare Spending and the Legislative Landscape in the U.S.
Demographic shifts underlie the expected growth in total U.S. healthcare expenditure from $4.1 trillion in 2020 to $6.2 trillion in 2028, an average annual growth rate of 5.4%. This projected average annual growth rate is faster than the observed rate of 3.9% between 2009 and 2018. Projected growth in annual spending for Medicare (4.3%) and Medicaid (5.6%) is expected to contribute substantially to the increase in national health expenditure over the coming decade. However, growth in national healthcare spending has slowed in 2021 to 4.2%, down from 9.7% in 2020. Healthcare spending as a percentage of GDP is expected to remain virtually unchanged from 19.7% in 2020 to 19.6% by 2030.
Since inception, Medicare has accounted for an increasing proportion of total U.S. healthcare expenditures. Medicare currently provides healthcare benefits for an estimated 60 million elderly and disabled people, constituting approximately 15% of the federal budget in 2018 and is expected to rise to 18% by 2028. Medicare represents the largest portion of total healthcare costs, constituting 20% of total health spending in 2020. Medicare also accounts for 25% of hospital spending, 30% of retail prescription drugs sales, and 23% of physician services.
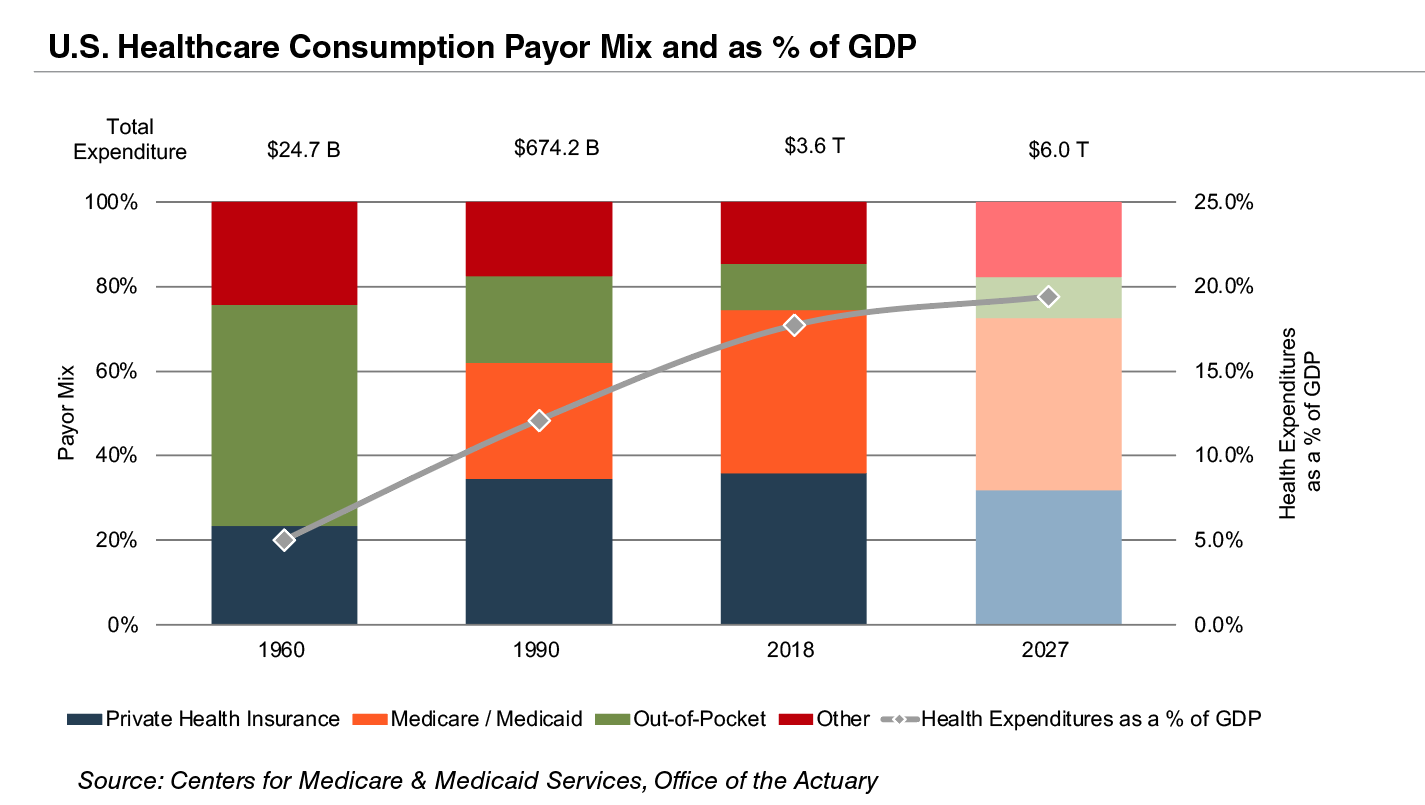
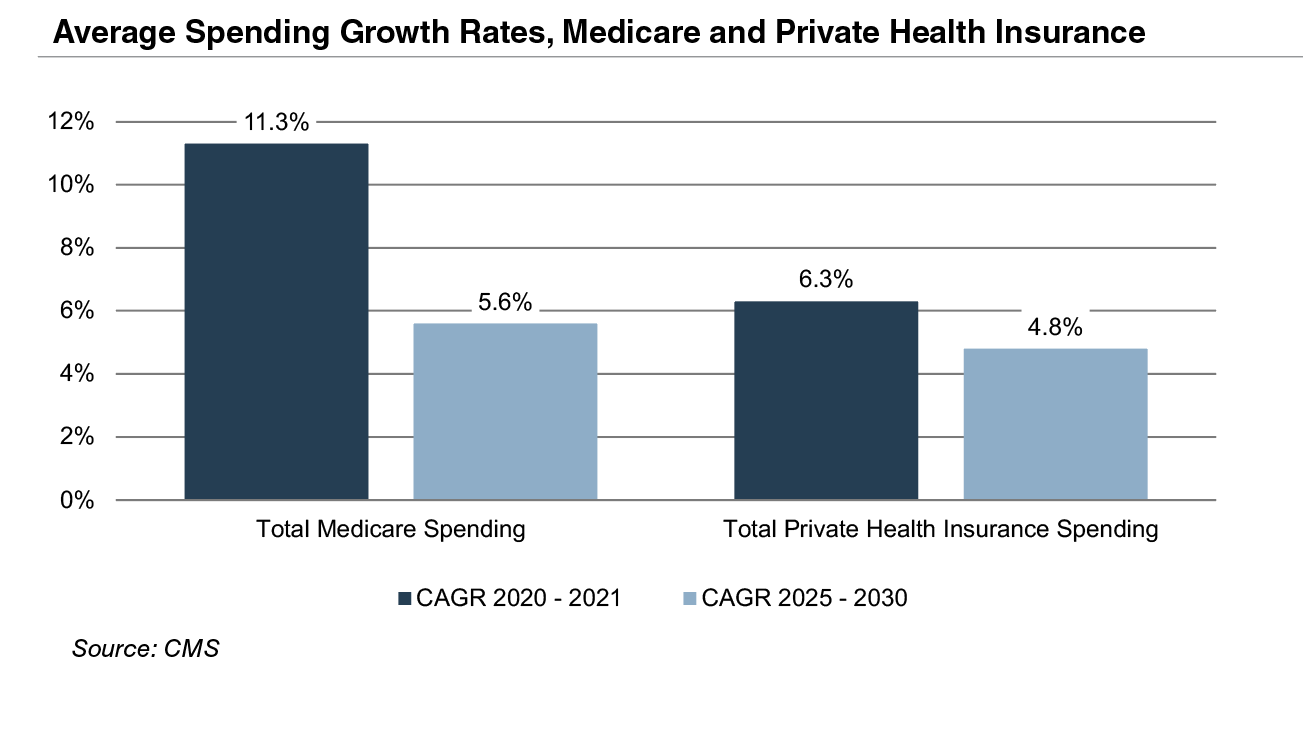
Due to the growing influence of Medicare in aggregate healthcare consumption, legislative developments can have a potentially outsized effect on the demand and pricing for medical products and services. Net mandatory benefit outlays (gross outlays less offsetting receipts) to Medicare totaled $776 billion in 2020 and are expected to reach $1.5 trillion by 2030.
The Patient Protection and Affordable Care Act (“ACA”) of 2010 incorporated changes that are expected to constrain annual growth in Medicare spending over the next several decades, including reductions in Medicare payments to plans and providers, increased revenues, and new delivery system reforms that aim to improve efficiency and quality of patient care and reduce costs. While political debate centered around altering the ACA has been a continuous fixture in American politics since its passing, it is unlikely that material reform to the ACA occurs in the near future under the Biden Administration. Total Medicare spending is projected to grow at 5.6% annually between 2025 and 2030, compared to year over year growth of 11.3% in 2021 and 3.5% in 2020.
3. Third-Party Coverage and Reimbursement
The primary customers of medical device companies are physicians (and/or product approval committees at their hospitals), who select the appropriate equipment for consumers (patients). In most developed economies, the consumers themselves are one (or more) step removed from interactions with manufacturers, and therefore pricing of medical devices. Device manufacturers ultimately receive payments from insurers, who usually reimburse healthcare providers for routine procedures (rather than for specific components like the devices used). Accordingly, medical device purchasing decisions tend to be largely disconnected from price.
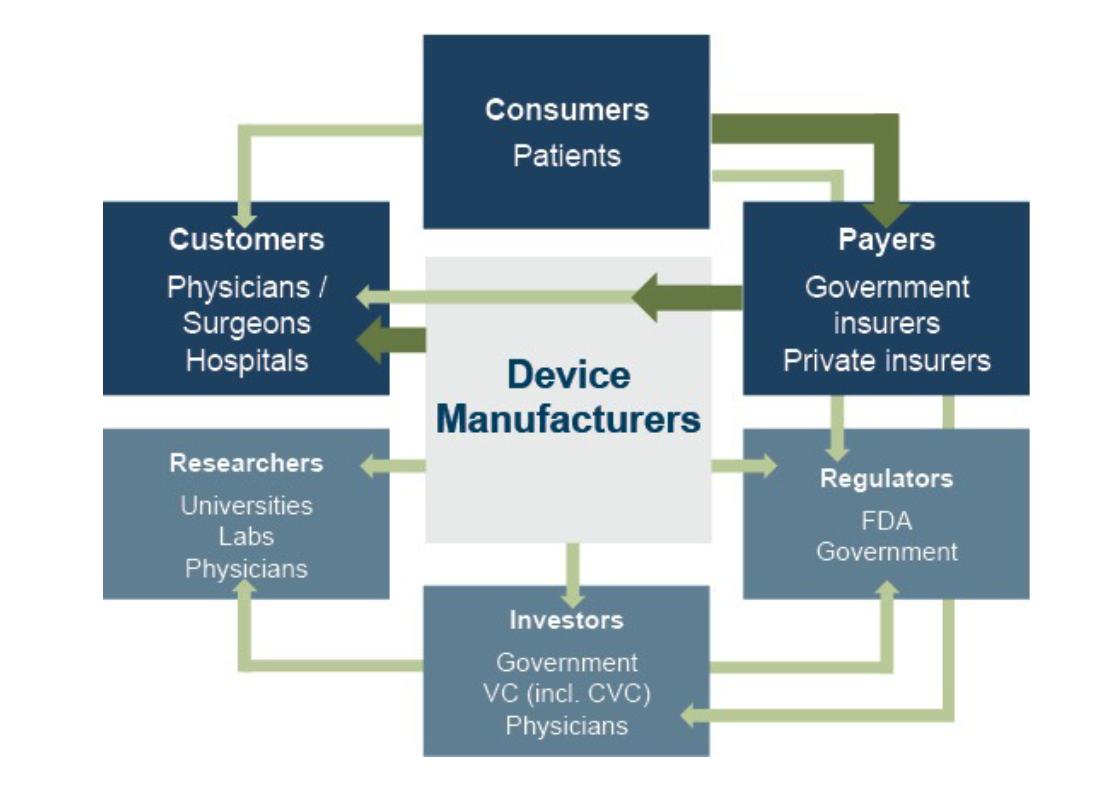
Third-party payors (both private and government programs) are keen to reevaluate their payment policies to constrain rising healthcare costs. Several elements of the ACA are expected to limit reimbursement growth for hospitals, which form the largest market for medical devices. Lower reimbursement growth will likely persuade hospitals to scrutinize medical purchases by adopting i) higher standards to evaluate the benefits of new procedures and devices, and ii) a more disciplined price bargaining stance.
The transition of the healthcare delivery paradigm from fee-for-service (FFS) to value models is expected to lead to fewer hospital admissions and procedures, given the focus on cost-cutting and efficiency. In 2015, the Department of Health and Human Services (HHS) announced goals to have 85% and 90% of all Medicare payments tied to quality or value by 2016 and 2018, respectively, and 30% and 50% of total Medicare payments tied to alternative payment models (APM) by the end of 2016 and 2018, respectively. A report issued by the Health Care Payment Learning & Action Network (LAN), a public-private partnership launched in March 2015 by HHS, found that 35.8% of payments were tied to Category 3 and 4 APMs in 2018, compared to 32.8% in 2017.
In 2020, CMS released guidance for states on how to advance value-based care across their healthcare systems, emphasizing Medicaid populations, and to share pathways for adoption of such approaches. Ultimately, lower reimbursement rates and reduced procedure volume will likely limit pricing gains for medical devices and equipment.
The medical device industry faces similar reimbursement issues globally, as the EU and other jurisdictions face similar increasing healthcare costs. A number of countries have instituted price ceilings on certain medical procedures, which could deflate the reimbursement rates of third-party payors, forcing down product prices. Industry participants are required to report manufacturing costs, and medical device reimbursement rates are set potentially below those figures in certain major markets like Germany, France, Japan, Taiwan, Korea, China, and Brazil. Whether third-party payors consider certain devices medically reasonable or necessary for operations presents a hurdle that device makers and manufacturers must overcome in bringing their devices to market.
4. Competitive Factors and Regulatory Regime
Historically, much of the growth of medical technology companies has been predicated on continual product innovations that make devices easier for doctors to use and improve health outcomes for the patients. Successful product development usually requires significant R&D outlays and a measure of luck. If viable, new devices can elevate average selling prices, market penetration, and market share.
Government regulations curb competition in two ways to foster an environment where firms may realize an acceptable level of returns on their R&D investments. First, firms that are first to the market with a new product can benefit from patents and intellectual property protection giving them a competitive advantage for a finite period. Second, regulations govern medical device design and development, preclinical and clinical testing, premarket clearance or approval, registration and listing, manufacturing, labeling, storage, advertising and promotions, sales and distribution, export and import, and post market surveillance.
Regulatory Overview in the U.S.
In the U.S., the FDA generally oversees the implementation of the second set of regulations. Some relatively simple devices deemed to pose low risk are exempt from the FDA’s clearance requirement and can be marketed in the US without prior authorization. For the remaining devices, commercial distribution requires marketing authorization from the FDA, which comes in primarily two flavors.
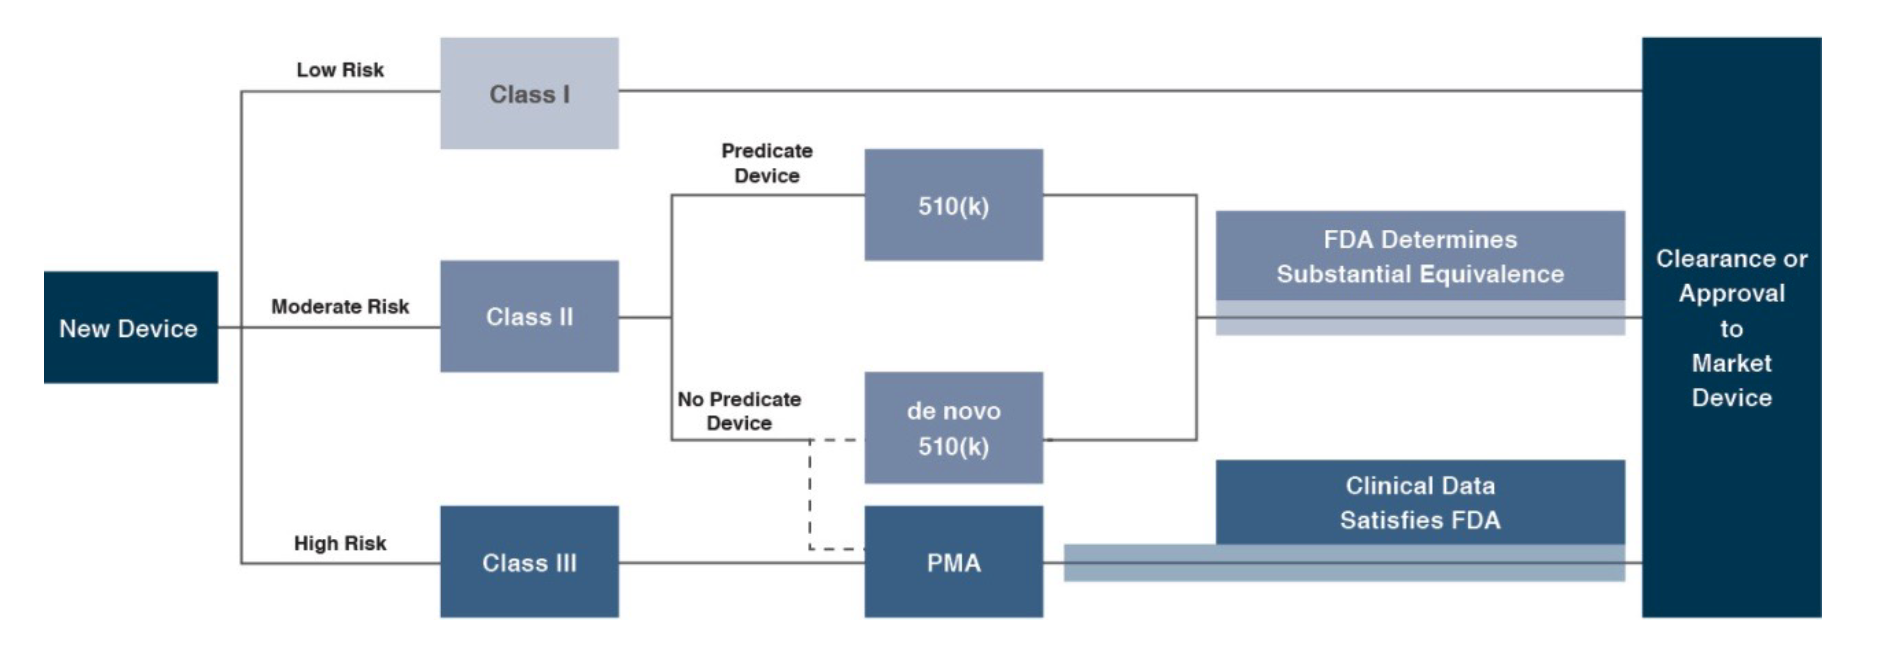
The premarket notification (“510(k) clearance”) process requires the manufacturer to demonstrate that a device is “substantially equivalent” to an existing device (“predicate device”) that is legally marketed in the U.S. The 510(k) clearance process may occasionally require clinical data and generally takes between 90 days and one year for completion. In November 2018, the FDA announced plans to change elements of the 510(k) clearance process. Specifically, the FDA plan includes measures to encourage device manufacturers to use predicate devices that have been on the market for no more than 10 years. In early 2019, the FDA announced an alternative 510(k) program to allow medical devices an easier approval process for manufacturers of certain “well-understood device types” to demonstrate substantial equivalence through objective safety and performance criteria. The plans materialized as the Abbreviated 510(k) Program later in the year.
The premarket approval (“PMA”) process is more stringent, time-consuming, and expensive. A PMA application must be supported by valid scientific evidence, which typically entails collection of extensive technical, preclinical, clinical, and manufacturing data. Once the PMA is submitted and found to be complete, the FDA begins an in-depth review, which is required by statute to take no longer than 180 days. However, the process typically takes significantly longer and may require several years to complete.
Pursuant to the Medical Device User Fee Modernization Act (MDUFA), the FDA collects user fees for the review of devices for marketing clearance or approval. The current iteration of the Medical Device User Fee Act (MDUFA IV) came into effect in October 2017. Under MDUFA IV, the FDA is authorized to collect almost $1 billion in user fees, an increase of more than $320 million over MDUFA III, between 2017 and 2022. Intended to begin in 2020, negotiations for MDUFA V were delayed due to the COVID-19 pandemic. The FDA and industry groups reached a deal for MDUFA V, slated to go into effect beginning fiscal 2023, which would generate up to $1.9 billion in fees to the agency over five years. The U.S. House of Representatives passed MDUFA V in June 2022 and the Senate is expected to follow suit by September 2022.
Regulatory Overview Outside the U.S.
The European Union (EU), along with countries such as Japan, Canada, and Australia all operate strict regulatory regimes similar to that of the FDA, and international consensus is moving towards more stringent regulations. Stricter regulations for new devices may slow release dates and may negatively affect companies within the industry.
Medical device manufacturers face a single regulatory body across the EU. In order for a medical device to be allowed on the market, it must meet the requirements set by the EU Medical Devices Directive. Devices must receive a Conformité Européenne (CE) Mark certificate before they are allowed to be sold in that market. This CE marking verifies that a device meets all regulatory requirements, including EU safety standards. A set of different directives apply to different types of devices, potentially increasing the complexity and cost of compliance.
5. Emerging Global Markets
Emerging economies are claiming a growing share of global healthcare consumption, including medical devices and related procedures, owing to relative economic prosperity, growing medical awareness, and increasing (and increasingly aging) populations. According to the WHO, middle income countries, such as Russia, China, Turkey, and Peru, among others, are rapidly converging towards outsized levels of spending as their incomes increase. When countries grow richer, the demand for health care increases along with people’s expectation for government financed healthcare. Middle income country share, the fastest growing economic sector, increased from 15% to 19% of global spending between 2000 and 2017. As global health expenditure continues to increase, sales to countries outside the U.S. represent a potential avenue for growth for domestic medical device companies. According to the World Bank, all regions (except Sub-Saharan Africa and South Asia) have seen an increase in healthcare spending as a percentage of total output over the last two decades.
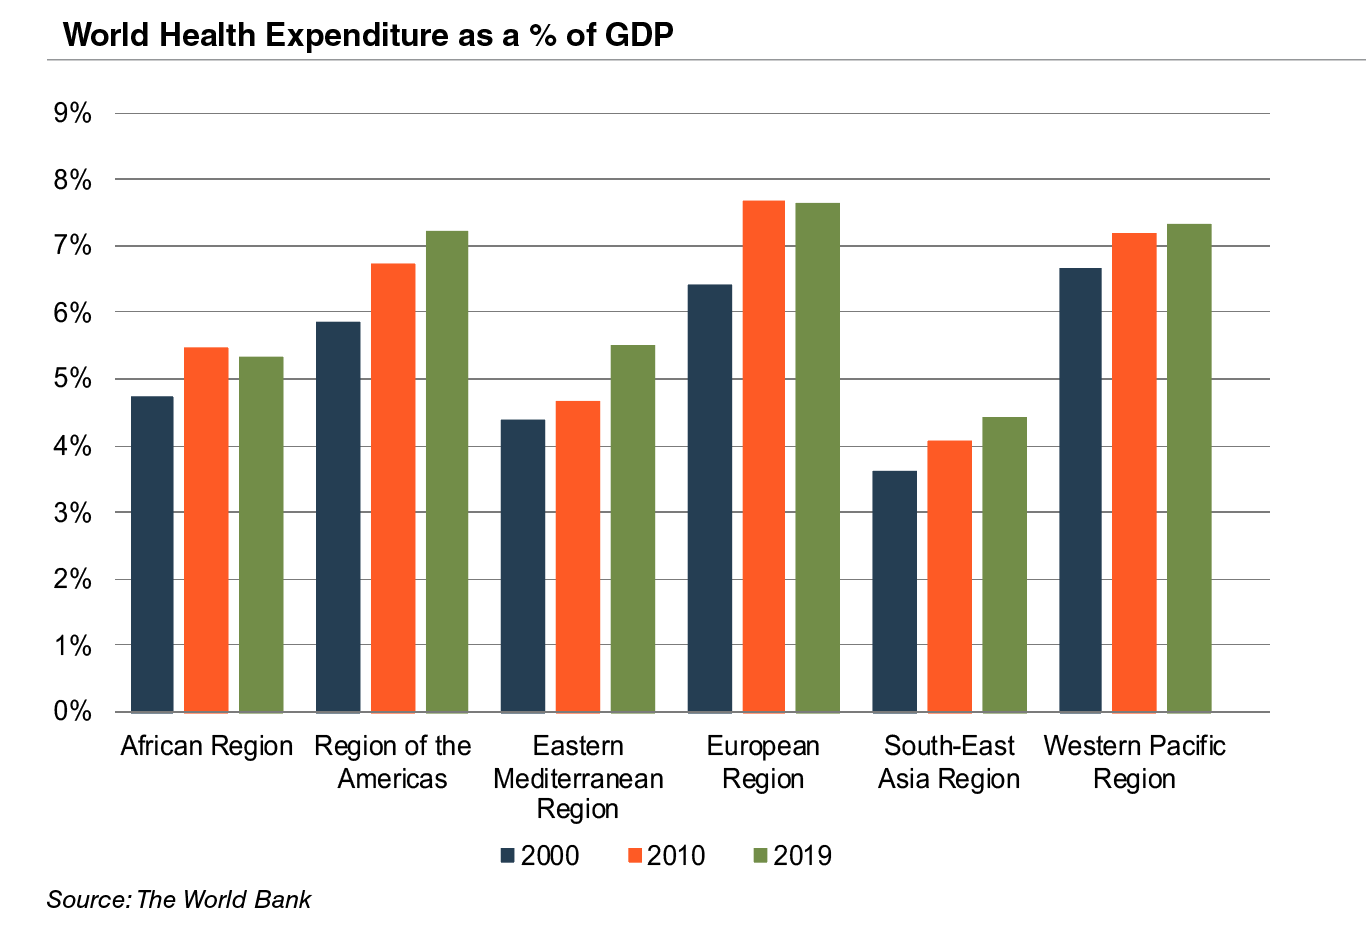
Global medical device sales are estimated to increase 5.4% annually from 2021 to 2028, reaching nearly $658 billion according to data from Fortune Business Insights. While the Americas are projected to remain the world’s largest medical device market, the Asia Pacific and Western Europe markets are expected to expand at a quicker pace over the next several years.
Summary
Demographic shifts underlie the long-term market opportunity for medical device manufacturers. While efforts to control costs on the part of the government insurer in the U.S. may limit future pricing growth for incumbent products, a growing global market provides domestic device manufacturers with an opportunity to broaden and diversify their geographic revenue base. Developing new products and procedures is risky and usually more resource intensive compared to some other growth sectors of the economy. However, barriers to entry in the form of existing regulations provide a measure of relief from competition, especially for
newly developed products.
FreightTech Update
Automated Trucks, VC Frenzy, and the Rise of Brokerages
The COVID-19 pandemic brought economic hardship to many. The second quarter of 2020 might go down as one of the quickest economic downturns ever recorded. However, in an effort to protect the economy, the Fed created an extremely hospitable environment for venture capital, and with the glaring supply chain issues, FreightTech became a cushy landing place for investor’s money. We have written about venture capital and FreightTech before, and it has only gotten bigger since then.
In the fourth quarter of 2020, American and European FreightTech companies raised a combined $4.1 billion from venture capitalists. This was a 21% increase quarter-over-quarter, and an increase of 49% on an annual basis. In less than twelve months, 2020 went from a dark and gloomy place for businesses to a 4th of July fireworks parade, during which $12.6 billion was poured into 555 deals in America and Europe.
The parade continued marching into 2021, with average pre-money valuations increasing by 28.4% to $30 million, and late-stage valuations increasing by 95.3% to $120 million. During these six quarters, companies like Loadsmith continued to introduce digital technologies that seek to revolutionize the brokerage industry and allow smaller brokerages and 3PLs to compete with the largest asset-based carriers.
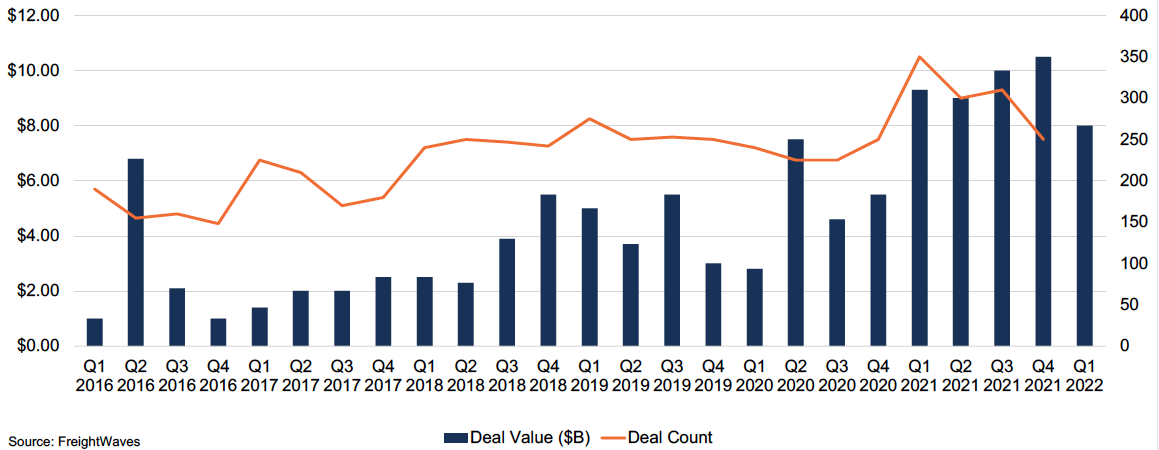
Click here to expand the image above
Self-driving trucks have also remained a point of focus. Though one of our clients maintains that self-driving trucks are “always ten years away,” they are the holy grail of FreightTech. The trucking industry has long struggled with an exodus of workers, and during COVID a large portion of its aging labor force decided to either retire due to fears of contracting the virus or moved on to less-regulated sectors. To prevent driver shortages and reduce turnover, many companies are increasing driver pay. For example, Walmart began paying their drivers $110,000 in their first year. With a fleet of 12,000 drivers, that is a very expensive endeavor, so it is no surprise that companies like TuSimple, that develop self-driving trucks, already have deals in place with ready-to-pay customers. The CEO of Werner Enterprises was quoted as saying that “We look forward to building a hybrid world where drivers continue to haul freight while autonomous trucks supplement rising demand,” showing that self-driving freight modes are no longer only a fantasy of Silicon Valley, but a future of the industry.
Despite all the positive growth between the third quarter of 2020 and the fourth quarter of 2021, the proverbial truck ran into a roadblock. As the Federal Reserve increased interest rates in its efforts to tame inflation, the first quarter of 2022 recorded decreases of 3.6% and 20.4% on a quarterly and annual basis, respectively. Startups raised only $14 billion. The number of IPO listings decreased dramatically, alongside the average valuations of FreightTech firms.
While the number of new FreightTech startups has decreased, an opportunity in the form of higher gas prices, created by the Russia-Ukraine conflict, emerged. High gas prices have made electric vehicles much more attractive both to the consumer as well as the manufacturers. Ford begun production on the first ever electric pickup truck (beating Tesla’s Batmobi…excuse me Cybertruck to the punch), and GM has promised to release its own fully electric truck in the spring of 2023. Artificial intelligence has also evolved in the FreightTech world, running robots in warehouses (which exponentially increases efficiency in over-capacity facilities) and even analyzing space and creating the mathematically most optimal way of storing items in a container for maritime shipping.
Even though the current economic outlook can appear somewhat gloomy, the transportation sector can still expect money to be available for startups, though it might be harder to get. Ryan Schreiber, Vice President of Growth and Industry for supply chain consultant Metafora stated that “One founder described it to me as saying in early ’21, if you had any revenue, you could raise and at a valuation you preferred,” compared to the current situation where “You’ve got to have a $1.5 million annual recurring revenue, and you are going to be grateful to get any valuation.” Schreiber advises FreightTech firms to not burn through their runway, and to not sell equity unless for a very good reason.
There is also good news for FreightTech entrepreneurs. A McKinsey survey revealed that 77% of supply chain executives intend on investing in supply chain visibility, among other things. That combined with the growth of the e-commerce industry, it is fair to anticipate a decent amount of investment to still be poured into the sector.
The best inventions often came from times of crisis. Nuclear fission was invented during World War II, antiseptic disinfectant was invented to stop a cholera epidemic in Germany, and in the midst of the ‘08 financial crisis, Beyonce released her hit single “Single Ladies.” So it is no surprise that the COVID-19 pandemic and the Russia-Ukraine war have sparked a new wave of innovation in the FreightTech industry. And while, perhaps, startups are no longer getting as much funding as they did in 2021, it is clear that it will remain a hot sector for as long as we face supply chain bottlenecks and restrictions.
The Importance of Normalizing Financial Statements for a Business Valuation
What is normal? A question we seem to have been asking ourselves for the last few years. When it comes to making sense of the “normal” in this new day and age, we cannot offer any advice there. But we can speak on the process and importance of normalizing financial statements for a business valuation.
It is common for a business valuator to make adjustments to reported financial statements to more accurately reflect ongoing, operating cash flows of a business. These adjustments are part of the “normalization” process, with an ultimate goal of determining the earnings capacity of the business.
In litigation, when two financial experts’ valuation reports are compared, both the adjustments deemed necessary, and the dollar amount attributed to each can be a factor in the differences in valuation conclusions.
Understanding Before Adjusting
To perform an accurate business valuation, appraisers must have a clear understanding of the subject company’s true financial position and historical earnings capacity. This knowledge is vital to comprehend the company’s future income-generating ability and assess its financial performance relative to industry peers as well as its own historical performance.
Valuators obtain multiple years of financial statements (typically 5 years), most commonly the income statement and balance sheet. These statements should be analyzed thoroughly to evaluate historical operating results and the conditions under which they were achieved, accounting methods, etc. This is generally the first step in the normalization process: holistically understanding the normal operating conditions of a company in context of itself, its industry, and the grander economy, to in turn understand if any conditions are potentially present for normalizations.
Reviewing historical trends of the subject business and its peers, comparing current financial results to prior year(s), utilizing ratio and margin analysis, as well as historical common-sized statements, are all examples of procedures to examine where potential adjustments could exist. Only once the appraiser has completed the due diligence required to understand the nature of a company’s operations and the industry in which it operates, can relevant and appropriate informed adjustments be made.
While adjustments can come in many shapes and sizes, we have selected a few common and/or recent types of adjustments that we regularly encounter.
Unusual, Nonrecurring Income or Expenses
A company may receive income or incur an expense as the result of an event that is abnormal, unrelated to the company’s ordinary day-to-day operations, or unlikely to reoccur in the foreseeable future.
As we discussed earlier, a thorough understanding of what the business does operationally on a day-to-day basis can pinpoint if an expenditure can be classified as non-recurring or a regular business expense. These items are often referred to as nonrecurring, extraordinary, or unusual gains/losses often the result of events such as:
- PPP income
- Litigation expenses which are related to non-recurring and/or one-off situation
- One-time expenses
- Gains/losses on sale of assets
- Insurance payouts
- Discontinued business operations
The objective of adjusting for unusual, extraordinary, and nonrecurring items is to present the financial results associated with normal operating conditions that can be indicative of future operating performance. Additionally, these adjustments enhance comparability among the subject company and guideline public companies, i.e., provide a ‘public equivalent.’
Owner/Officer Compensation & Other Discretionary Expenses
Privately held business owners may have discretion over the amount and type of compensation they receive, as well as perquisites paid for by the business such as vehicles, cell phones, travel, meals, insurance, etc. The goal is to understand the total compensation paid to management and the business owner(s) and for what roles and responsibilities.
From a business valuation perspective, we assume that a hypothetical buyer of subject company would need to pay market rates to replace subject management and/or owner(s). A review of historical salary trends for all owners, investigating potential deferral of bonus or payroll, as well as evaluating professional resources to examine the specific industry owner’s estimated compensation, is vital to determine if an adjustment is necessary.
Rent
A company may pay above or below-market rent to a related party, such as a holding company or a family member that owns the property. In this case, an appraiser may normalize rent expense to related parties by adjusting the rent expense to market rate for similar properties. By adjusting the rent to market rates, the financial statements are adjusted to be representative of a normal condition of the subject company as of the business valuation date.
In an alternative hypothetical scenario, the company may own facilities that it rents to a third party. If the company’s real estate is not related to the core operations of a business, it is a non-operating asset and should be treated as separate from the company’s operations, removed from the balance sheet, along with any loans associated on the real estate. Also, rental income and further related expenses would be removed.
Illustrative Examples
Fact Pattern #1: Manufacturing company has a plant fire that destroys the factory. The company did own an insurance policy covering part of the costs to repair the plant. Any reported loss resulting from the extraordinary event, and the income recognized from the insurance payout should be normalized. Additionally, adjustments to cash may be necessary representing unusual, one-time insurance proceeds.
Fact Pattern #2: Car dealership has an investment in an unrelated company. Although the investment may provide an income stream, this income typically would not be considered to represent the company’s normal operations. As a result, the income stream could be reasonably removed, as would the asset from the book value. Following this potential methodology, this investment would be added as a non-operating asset to the estimated operating value of the subject company for an adjusted value.
Fact Pattern #3: Manufacturing company incurs significant expense to update equipment. In this example, the business cycle must also be considered. During the analysis of the industry and its corresponding business cycle, the expert finds it is common for a manufacturing company to update its productive equipment every five years. Thus, these updates could be “normal” capital maintenance or investment, and would, therefore, not need to be adjusted or excluded. Alternatively, the appraiser could ‘smooth’ out the expense, meaning removing the hit from the single year and add an average expense for the five-year period analyzed.
This is an example where the appraiser must understand the accounting used by the company – have they depreciated the full expense in Year 1? Or have they used straight-line depreciation? There are variations from company to company and this is but one of the many factors a valuator reviews during due diligence.
Conclusion
Normalizing financial statements is a component of the valuation process. Further, this tends to be one of the more common areas where experts may disagree.
Adjusting for significant revenue or expense items that appear to be related to the operating interests of a company requires the informed judgment of a financial expert. A competent and qualified valuation expert is necessary to the process to diligently examine the historical financial statements and further information to understand the true nature of the company’s operations.
2022 Core Deposit Intangibles Update
On September 21, 2022, the Federal Reserve increased the target federal funds rate by 75 basis points, capping off a collective increase of 300 basis points since March 2022. With the expectation of additional rate increases this year, it’s a good time to evaluate recent trends in core deposit values and discuss expectations for deposit valuations in the coming months.
Mercer Capital previously published articles on core deposit trends in August 2020 during the early stages of the pandemic and again in August 2021. In those articles, we described a decreasing trend in core deposit intangible asset values. In response to the pandemic, the Fed cut rates effectively to zero, and the yield on the benchmark 10-year Treasury reached a record low. While many factors are pertinent to analyzing a deposit base, a significant driver of value is market interest rates. As shown below, we find ourselves in a very different interest rate environment today.
Figure 1 :: U.S. Treasury Yield Curve
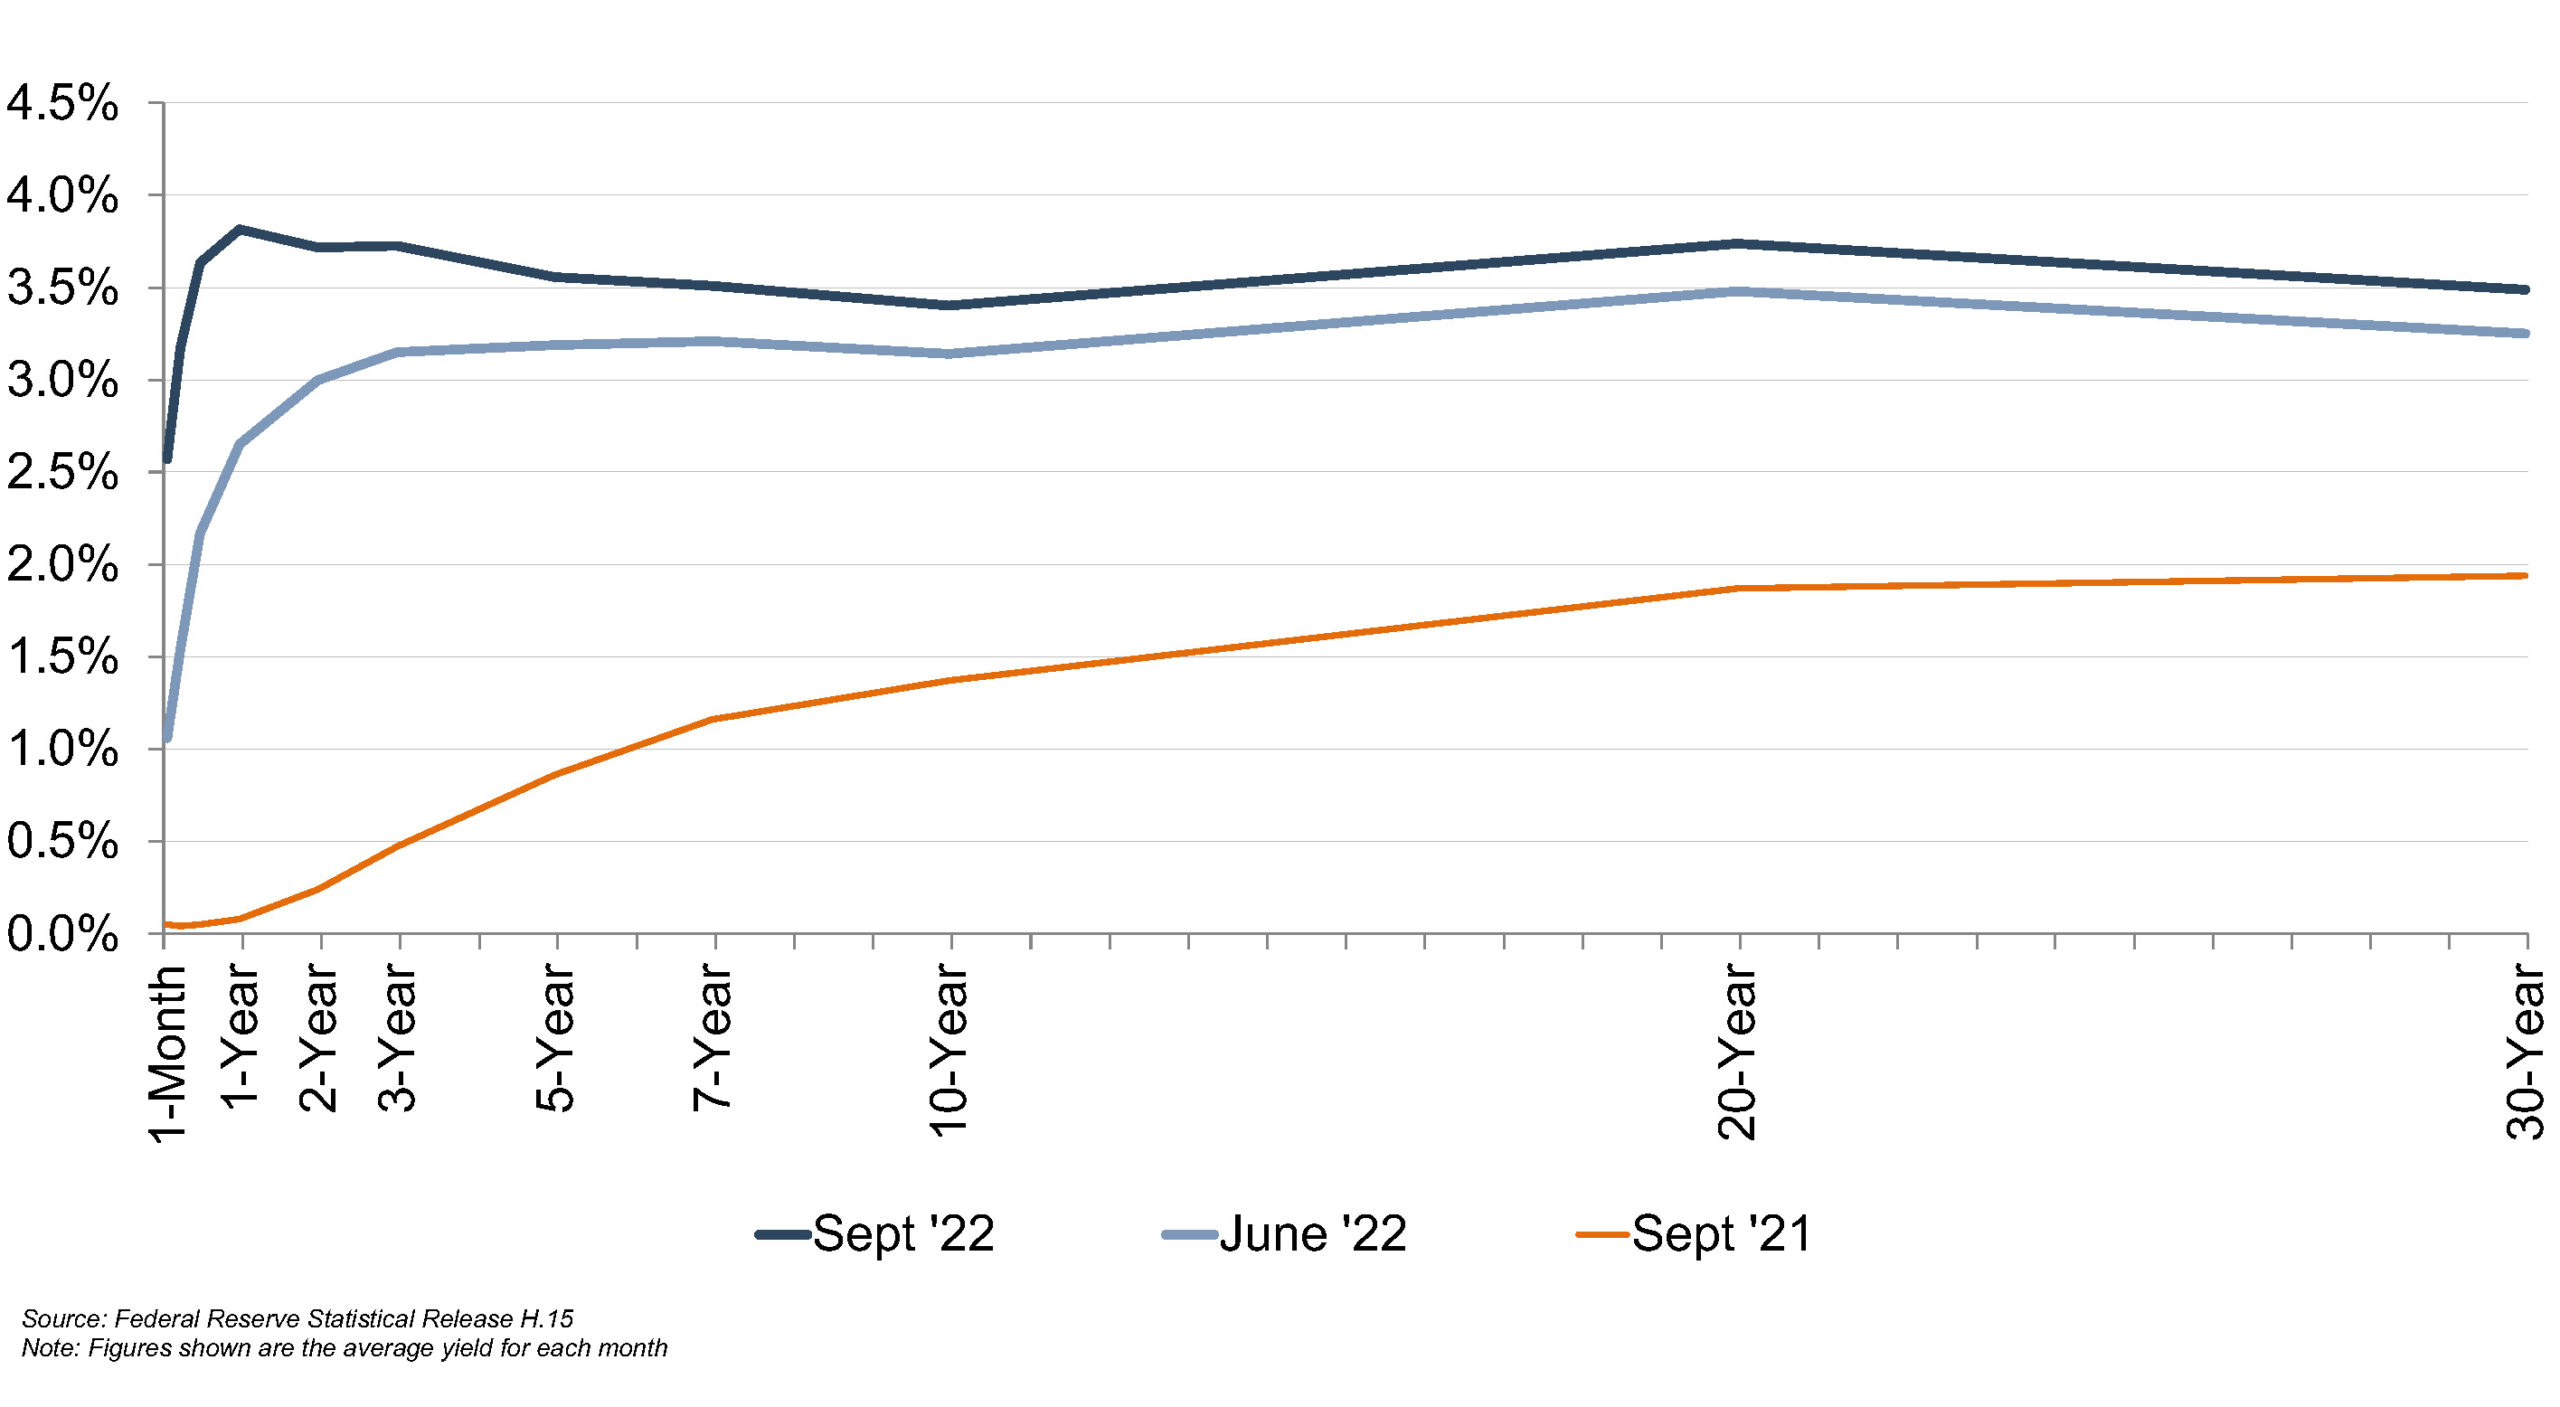
Trends In CDI Values
Using data compiled by S&P Capital IQ Pro, we analyzed trends in core deposit intangible (CDI) assets recorded in whole bank acquisitions completed from 2000 through mid-September 2022. CDI values represent the value of the depository customer relationships recorded by acquirers as an intangible asset. CDI values are driven by many factors, including the “stickiness” of a customer base, the types of deposit accounts assumed, the level of noninterest income generated, and the cost of the acquired deposit base compared to alternative sources of funding. For our analysis of industry trends in CDI values, we relied on S&P Capital IQ Pro’s definition of core deposits.1
In analyzing core deposit intangible assets for individual acquisitions, however, a more detailed analysis of the deposit base would consider the relative stability of various account types. In general, CDI assets derive most of their value from lower-cost demand deposit accounts, while often significantly less (if not zero) value is ascribed to more rate-sensitive time deposits and public funds. Non-retail funding sources such as listing service or brokered deposits are excluded from core deposits when determining the value of a CDI.
Figure 2 summarizes the trend in CDI values since the start of the 2008 recession, compared with rates on 5-year FHLB advances. Over the post-recession period, CDI values have largely followed the general trend in interest rates—as alternative funding recorded by acquirers became more costly in 2017 and 2018, CDI values generally ticked up as well, relative to post-recession average levels. Throughout 2019, CDI values exhibited a declining trend in light of yield curve inversion and Fed cuts to the target federal funds rate during the back half of 2019. This trend accelerated in March 2020 when rates were effectively cut to zero.
Figure 2 :: CDI as % of Acquired Core Deposits

Click here to expand the image above
CDI values have showed some recovery in the past few quarters (with an average CDI value of 93 basis points year-to-date in 2022 as compared to 64 basis points for all of 2021). Despite the recent uptick, CDI values remain below the post-recession average of 1.29% in the period presented in the chart and meaningfully lower than long-term historical levels which averaged closer to 2.5% to 3.0% in the early 2000s. They are also markedly lower than one might expect, given the current cost of wholesale funding.
As shown above, reported CDI values have not increased in tandem with the recent increase in FHLB rates. The average CDI value increased just 25 basis points from September 2021 to September 2022, while the five-year FHLB advance increased a dramatic 228 basis points over the same period. In late-2018 the 5-year FHLB rate approximated the current, mid-September 2022 level, but the average CDI value at that time was 2.42% (compared to the third quarter 2022 average value of 0.75%). The CDI values in recent quarters are somewhat counterintuitive. There are likely three drivers for the relationship between recently reported CDI values and market interest rates:
- Reporting time lag. The increase in the 5-year FHLB rate has occurred rapidly over the past few months. The deals that closed in the second and third quarters of 2022 were announced in an extremely low interest rate environment. Following third quarter 2022 filings, we expect some upward migration in CDI values to occur as recently announced deals are completed, which reflect the Federal Reserve’s recent rate actions.
- Deposit levels. Since the beginning of the pandemic, banks have been inundated with deposits. It was initially expected that the increase in deposits would be transient in nature as the economy re-opened, PPP funds were spent or invested, and consumer confidence improved. However, deposit growth continued through 2021 for nearly all banks and into 2022 for some banks. The growth rate in deposit balances is slowing, and September 2022 balances ($17.95 trillion) were lower than August 2022 balances ($18.0 trillion). Given the low average loan-to-deposit ratios, banks have not been in a hurry to increase deposit rates. With the excess of deposits, there may have been a tendency for bank acquirers to discount core deposit value given the lack of immediate funding needs or concern that, with higher market rates, the long anticipated reversal of the pandemic-related deposit influx may finally occur.
- Uncertain Rate Outlook. While rates are expected to continue rising in the near-term, some market participants may remain concerned that a zero rate environment will remain the long-term norm. If this view is correct, which implicitly assumes that the Federal Reserve can choke inflation, CDI values will remain constrained.
Nineteen deals were announced in August and September 2022, and five of those deals provided either investor presentations or earnings calls containing CDI estimates. These CDI estimates ranged from 1.5% to 2.0%, which is more in line with the numbers we have observed in our valuation analyses. We expect CDI values to continue rising in concert with market interest rates. However, market interest rates are not the only driver of CDI value, and there are some potentially mitigating factors to CDI values in the near term.
- Deposit levels. Over the past year, consumers were likely hesitant to go to the trouble of seeking higher interest rates as the marginal benefit of a rate enhancement would have been low in comparison to the necessary expenditure of effort. This inertia is not expected to last indefinitely. There is already evidence that excess deposit balances are beginning to exit the system. Higher attrition rates, all else equal, translate into a lower CDI value.
- Deposit mix. Over the past decade, nationwide average deposit mix has shifted in favor of noninterest bearing deposits. In 2007, retail time deposits constituted an average of 31% of financial institution deposits with noninterest bearing deposits comprising 16%. In 2022, this mix is nearly reversed (28% of balances in noninterest-bearing accounts and 15% in retail time deposits). As banks face increasing interest rate pressure, the deposit mix is likely to begin shifting in favor of interest-bearing deposits that have lower CDI values.
Figure 3 :: Deposit Mix Overtime
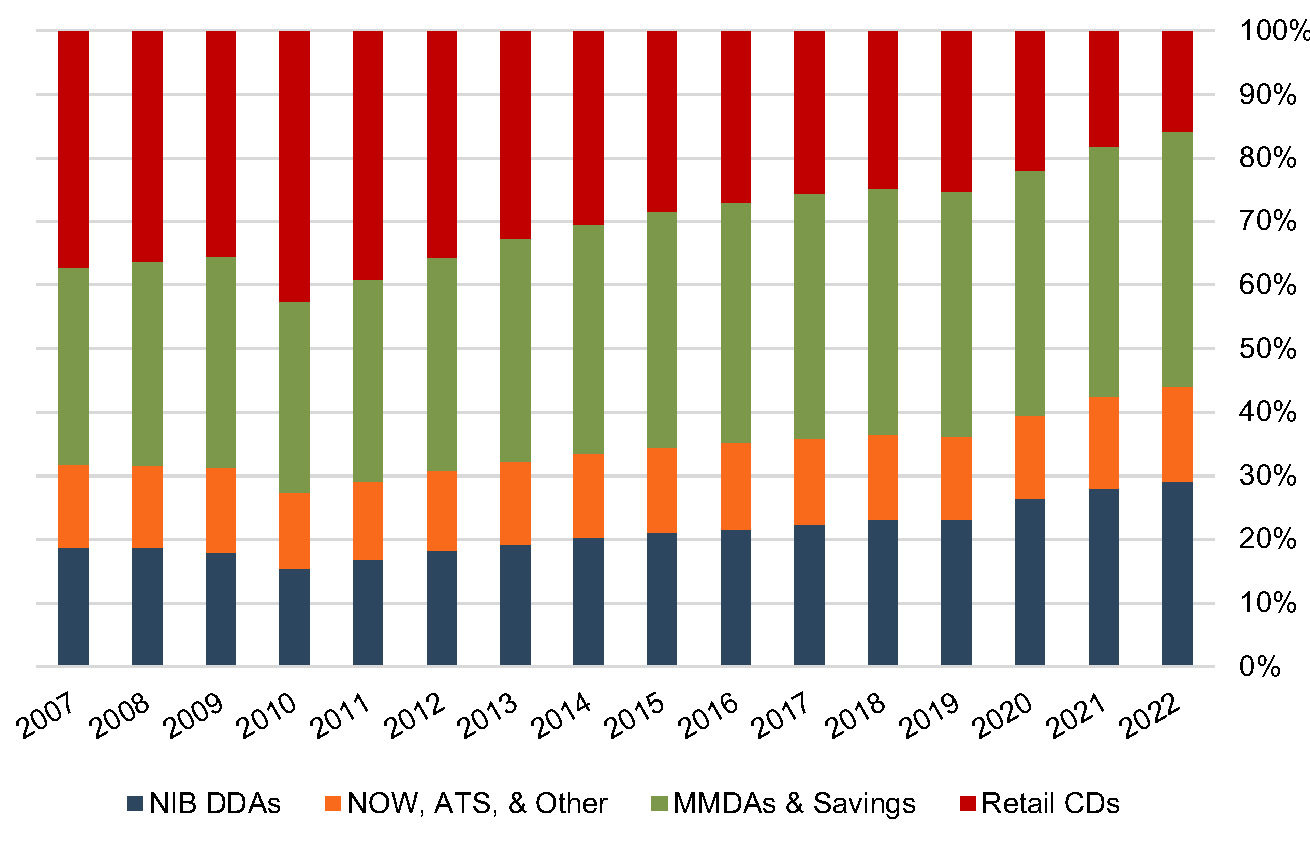
- Service charge income. The industry is facing pressure from regulators and the public to reduce overdraft charges and other fees. Lower service charge income produces lower CDI values, all else equal.
- Deposit interest rate betas. Historical average deposit betas may be insufficient to forecast future deposit interest rates over the life of an acquired deposit base. For example, deposit betas for money market accounts have historically averaged approximately 50%. At September 23, 2022 the national average money market rate was 0.15%. A 50% beta may not be aggressive enough to yield a reasonable ongoing interest rate for an acquired deposit base with a starting interest rate of 0.15%. Using an inappropriately low beta would artificially enhance core deposit value by understating future interest rates on the acquired deposit base.
Trends In Deposit Premiums Relative To CDI Asset Values
Core deposit intangible assets are related to, but not identical to, deposit premiums paid in acquisitions. While CDI assets are an intangible asset recorded in acquisitions to capture the value of the customer relationships the deposits represent, deposit premiums paid are a function of the purchase price of an acquisition.
Deposit premiums in whole bank acquisitions are computed based on the excess of the purchase price over the target’s tangible book value, as a percentage of the core deposit base. While deposit premiums often capture the value to the acquirer of assuming the established funding source of the core deposit base (that is, the value of the deposit franchise), the purchase price also reflects factors unrelated to the deposit base, such as the quality of the acquired loan portfolio, unique synergy opportunities anticipated by the acquirer, etc. As shown in Figure 4, deposit premiums paid in whole bank acquisitions have shown more volatility than CDI values. Deposit premiums in the range of 6% to 10% remain well below the pre-Great Recession levels when premiums for whole bank acquisitions averaged closer to 20%.
Additional factors may influence the purchase price to an extent that the calculated deposit premium doesn’t necessarily bear a strong relationship to the value of the core deposit base to the acquirer. This influence is often less relevant in branch transactions where the deposit base is the primary driver of the transaction and the relationship between the purchase price and the deposit base is more direct. Figure 5 (on the next page) presents deposit premiums paid in whole bank acquisitions as compared to premiums paid in branch transactions.
Deposit premiums paid in branch transactions have generally been less volatile than tangible book value premiums paid in whole bank acquisitions. Branch transaction deposit premiums averaged in the 3.0% to 7.5% range during 2020, up from the 2.0% to 4.0% range observed in the financial crisis. During 2021 and the first quarter of 2022, branch transaction deposit premiums averaged 2.5% to 5.25%. Unfortunately, none of the branch transactions completed in the second or third quarters of 2022 reported franchise premium data.
Figure 4 :: CDI Recorded vs. Deposit Premiums Paid
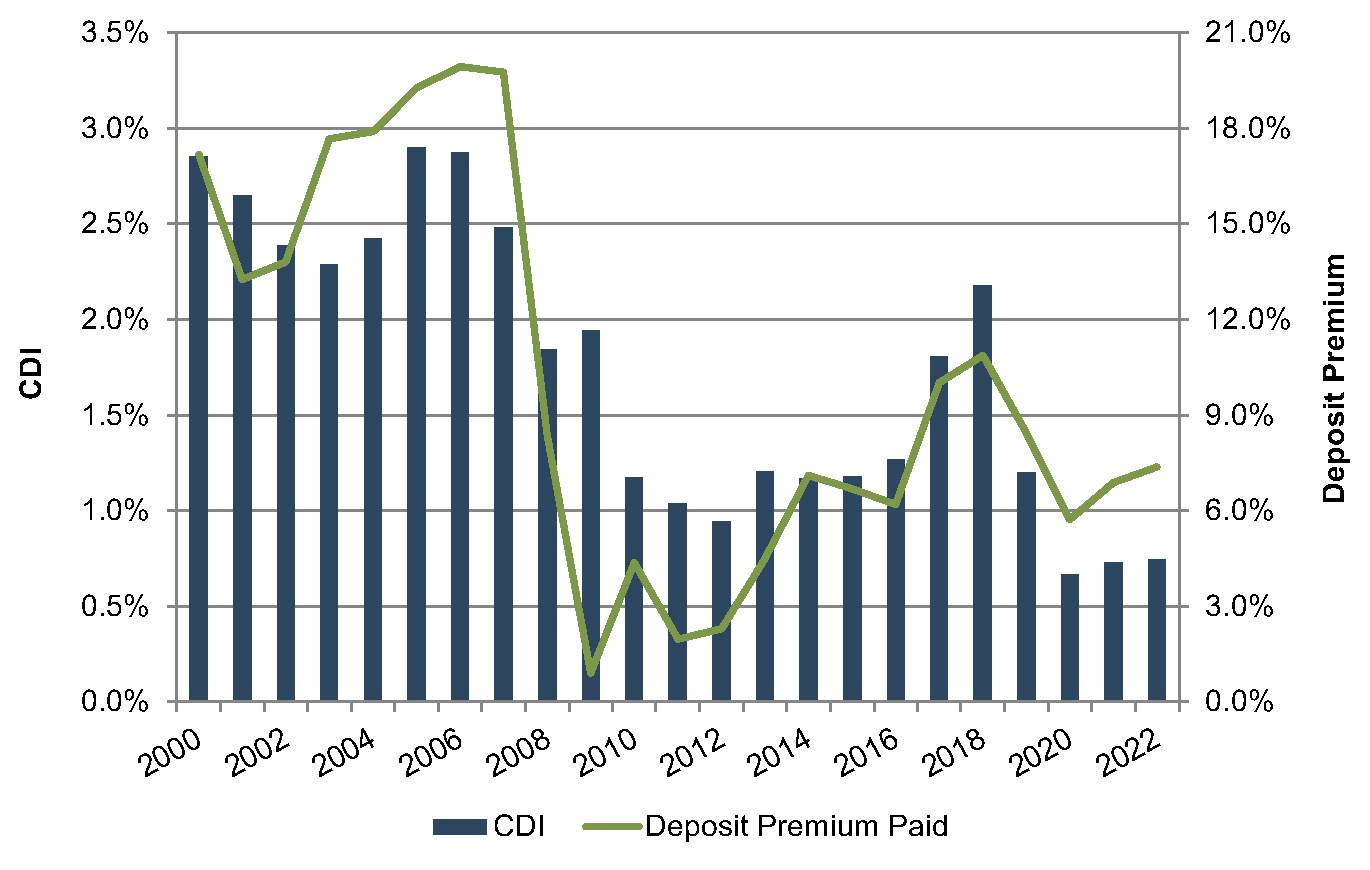
Figure 5 :: Average Deposit Premiums Paid

Click here to expand the image above
Some disconnect appears to exist between the prices paid in branch transactions and the CDI values recorded in bank M&A transactions. Beyond the relatively small sample size of branch transactions, one explanation might be the excess capital that continues to accumulate in the banking industry, resulting in strong bidding activity for the M&A opportunities that arise–even in situations where the potential buyers have ample deposits.
Accounting For CDI Assets
Based on the data for acquisitions for which core deposit intangible detail was reported, a majority of banks selected a ten-year amortization term for the CDI values booked. Less than 10% of transactions for which data was available selected amortization terms longer than ten years. Amortization methods were somewhat more varied, but an accelerated amortization method was selected in approximately half of these transactions.
Figure 6 :: Selected Amortization Term (Years)
Transactions Completed 2008 – September 25, 2022
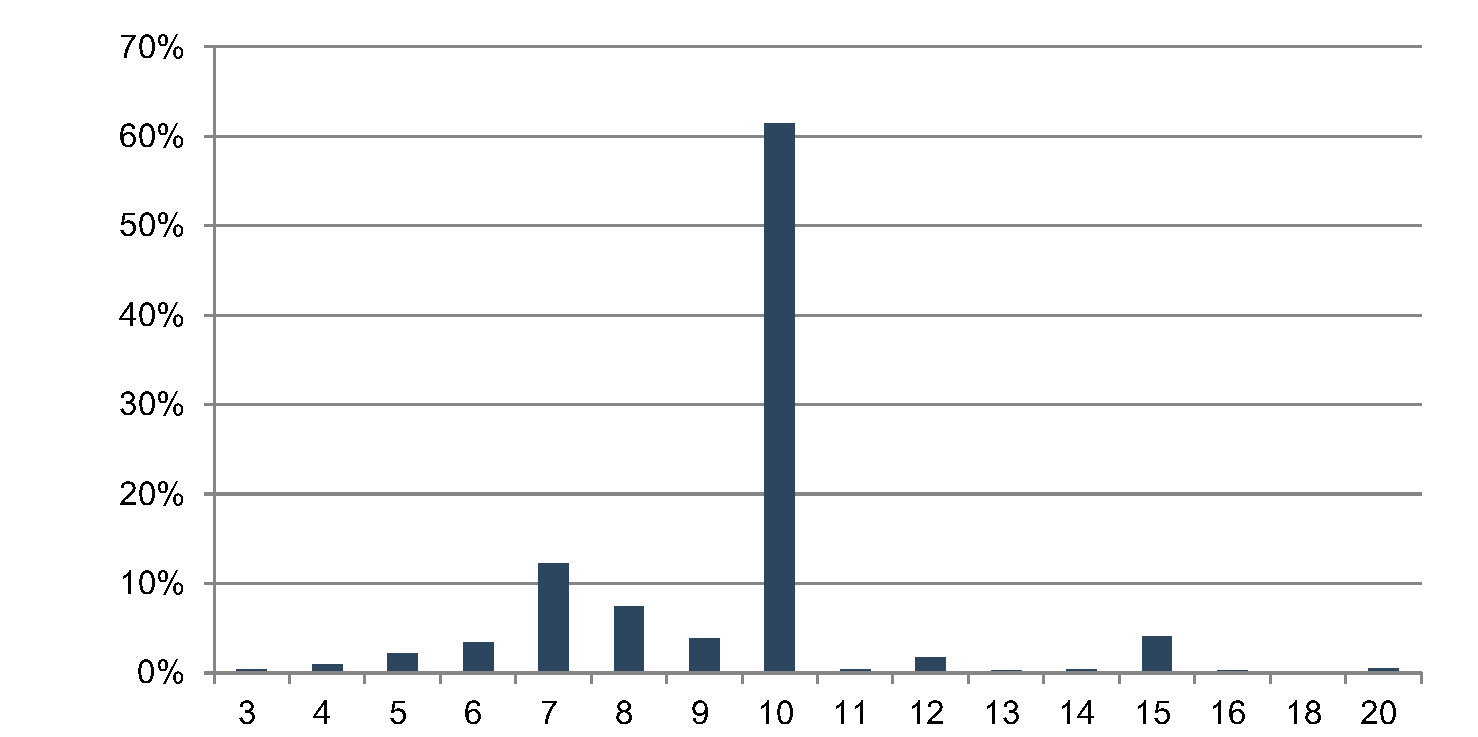
Figure 7 :: Selected Amortization Method
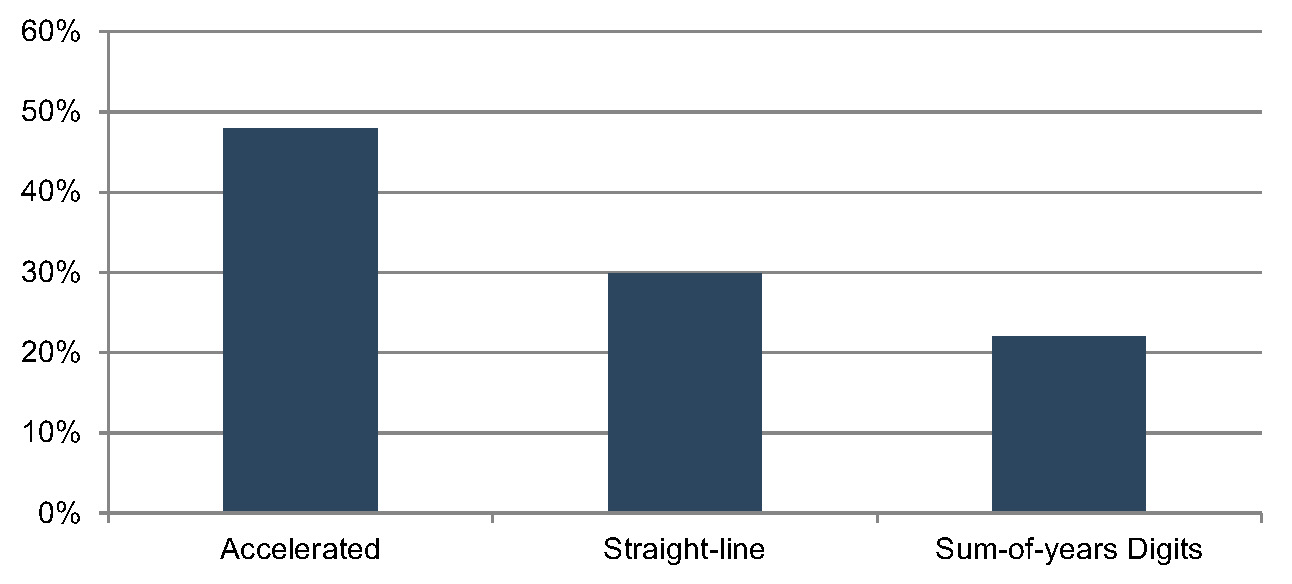
For more information about Mercer Capital’s core deposit valuation services, please contact a member of our Depository Institution Services Team.
1 S&P Capital IQ Pro defines core deposits as, “Deposits in U.S. offices excluding time deposits over $250,000 and brokered deposits of $250,000 or less.”
Importance of an Independent Informed Valuation
In contested cases where a business interest comprises a significant portion of a divorcing couple’s net worth, it is common for one or both parties to retain a business appraiser to value the business. Post-divorce, if only one spouse retains an interest in the business, all else equal, a higher business interest value typically implies the other party will receive a greater share of the remaining marital assets, as compared to a lower business interest value. As we will discuss in this article, the facts and circumstances of the business interest being valued may reasonably support various assumptions when comparing two valuation conclusions.
As the client, attorney, or judge, it can be difficult to receive two appraisals that differ significantly in their conclusions. Which one is right? While there is not typically an absolute “right” answer, one may well be more reasonable than the other. In this article, we examine how changes to one or a few assumptions can lead to possible material changes in valuation conclusions.
Setting the Scene
Disclaimer: the following examples and narrative are for instructional purposes and do not represent absolute opinions. Facts, circumstances, and time differ thus, no two valuations are the same, even for the same company as of different dates. Facts and circumstances should support assumptions and conclusions within a range of reasonableness. The goal of this article is to illustrate differences between valuations and the drivers behind those differences, not to opine that a specific discount rate, growth rate, or methodology to analyze earnings trends is “right” or “wrong.” Always and never should generally be avoided.
Ideally, appraisers would be given the same qualitative and factual overview of the company including history, future outlook, growth and risk. Sometimes, this isn’t the case, and appraisers may receive different versions leading to variations in interpreting the risk profile and/or earning potential of the business, which can lead to differences in concluded values between appraisers. An independent, prudent valuator will be able to analyze the ebbs and flows of historical earnings, though an important step in the valuation process is discussing these trends with management. Management’s perspective behind the numbers can be helpful in understanding the trajectory of the business. In the context of litigation, it may be important for the appraiser to consider the sources of the information they are receiving.
An Illustrative Example of Valuation Math
Under the income approach, there are two general methods to value a business:
- Single period earnings capitalization
- Discounted future earnings (or benefits)
If a company/management provides the two appraisers with projections of future financial performance, these may be assessed in the multi-period discounted cash flow method. However, projections may not be available, and in such cases, the single period earnings capitalization method is more commonly employed.
To value a business under the single period income capitalization method, appraisers must specify three valuation elements:
- the expected cash flow (earnings)
- the appropriate discount rate (r), and
- the expected long-term growth rate in earnings (g)
The basic valuation equation is:
Value = Expected Cash Flow / (r – g)
The denominator is (r – g), and 1 / (r – g) is the implied multiple of earnings. (r – g) is also sometimes referred to as a capitalization rate or cap rate.
This equation is generalized. Depending on the measure of expected earnings or cash flow, the appropriate discount rates and expected growth rates must be used.
For this example, assume the following:
- Ongoing earnings is $5.0 million.
- The discount rate is 16.0%.
- The expected long-term growth rate is 3.5%, which means that ongoing earnings will grow at that rate into the future.
- Based on the valuation equation above, we determine the appropriate multiple to be 8.0x, calculated by 1 / (16.0% – 3.5%).
With our assumptions, we can develop a valuation indication using the single-period income capitalization method.
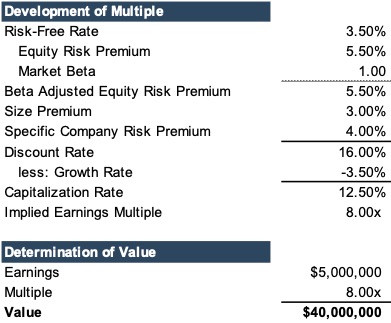
As seen in the figure above, the analysis can be synthesized into simple multiplication. Higher earnings or a higher multiple will lead to a higher value and vice-versa. The multiple is a function of a company’s discount rate (or risk profile) and growth rate. All else equal, companies that are growing slower or are deemed riskier, as compared to peers, the industry, and historical performance, typically
Both ongoing earnings and the multiple have numerous inputs and assumptions, and appraisers frequently use many of the same sources for the inputs in their analysis. For example, one of the first steps of a valuation is to request historical financials statements, to which appraisers make appropriate normalization adjustments to place the reported financial statements at market levels. Cost of capital data is used to assess risk and return, and appraisers commonly use similar sources in determining the risk of a business.
Range of Reasonableness
There are numerous reasons why appraisers may ultimately determine different values for the same subject business, so we won’t try list them all. Using our above example, if this valuation was the “right” answer for the purposes of this example, let’s make modest adjustments on both ends to show how much the answer might change with an optimist’s view and a pessimists’ view.
For simplicity, we will assume the appraisers used the same risk-free rate, beta, size premium, growth rate, and level of earnings (which are highlighted in the below diagram in gray). The scenarios differ in the equity risk premium and specific company risk premium.
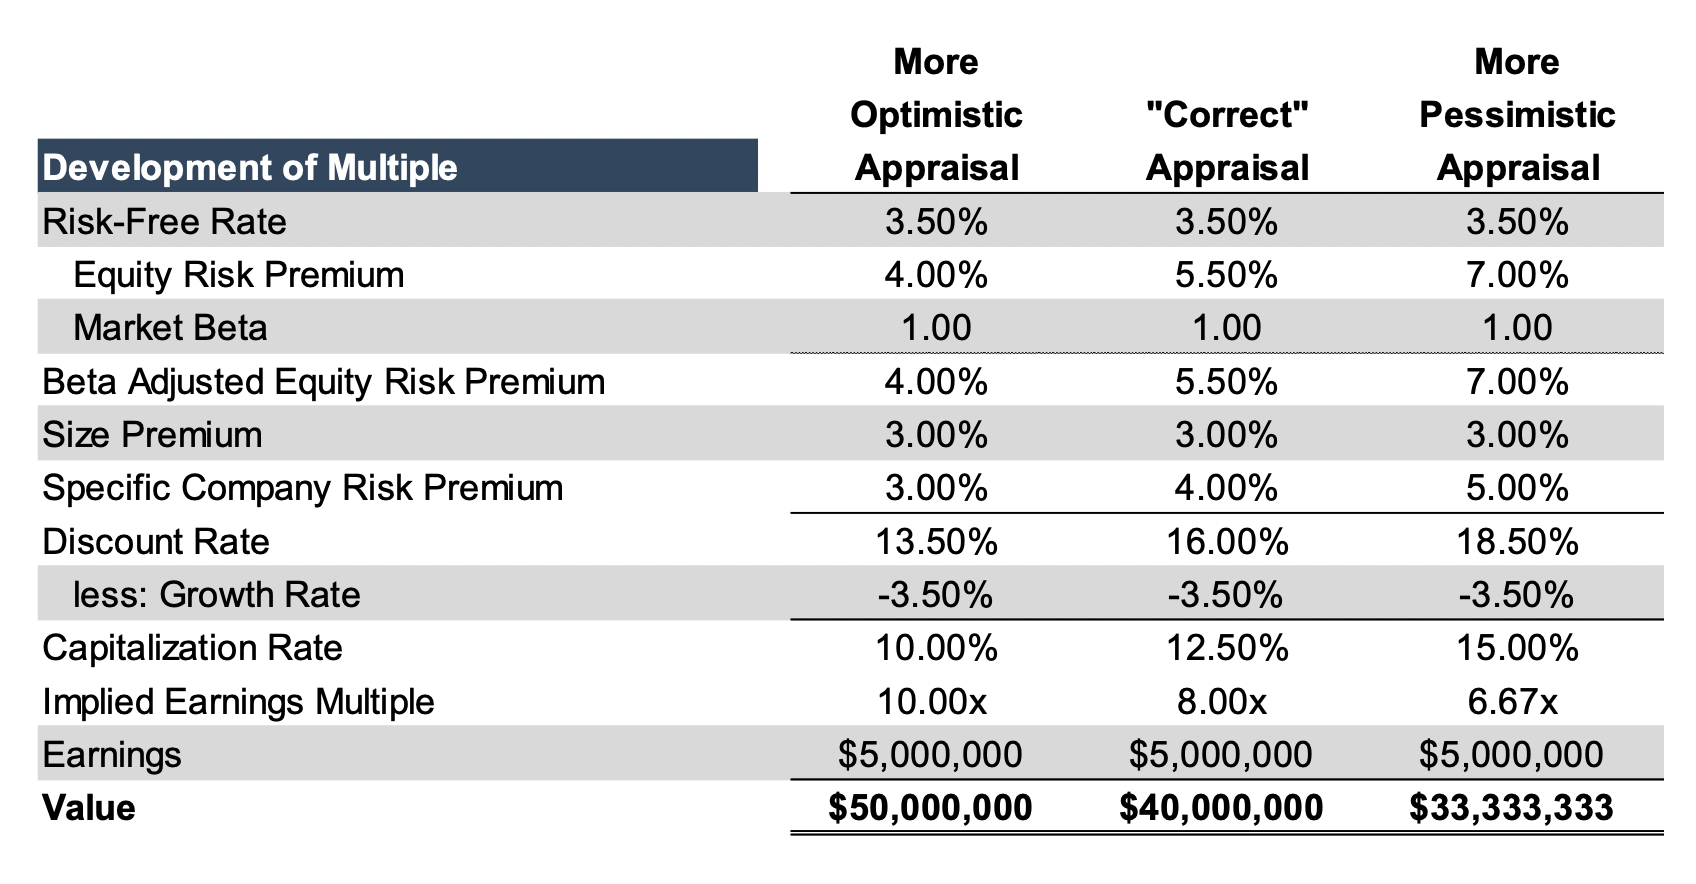
While many of the components of the discount rate are similar, the concluded discount rates are different and range from 13.5% to 18.5%. On the surface, neither the equity risk premium nor specific company risk premium utilized by either the optimist or pessimist appear “too far” away from what we are calling the “correct” appraisal, based on the facts and circumstances of this hypothetical case.
Despite seemingly small differences, the optimist’s conclusion is 50% higher than that of the pessimist. This is where the expertise and experience of an independent appraiser is key in determining what makes the most sense within a range of reasonableness. In an ideal world, two appraisers would not be 50% apart, but, as we’ve demonstrated above, reasonable assumptions could lead appraisers to have conclusions that are significantly apart.>>>
Appraisals Bordering on Advocacy
While reasonable appraisers may disagree, there comes a point at which certain assumptions border on aggressive and in the context of other assumptions, yield a conclusion that is unreasonable based on the facts and circumstances present. An appraiser might be on the high side of earnings and growth assumptions and on the low side on the corresponding risk assumption. Unless the assumptions are supported by the facts and circumstances for the specific company, the conclusion may become too aggressive and vice versa.
In the figure below, we have illustrated how different assumptions can impact value. Only the risk-free rate, beta, and size premium (all highlighted gray) are the same. For the highest and lowest indications, we use more even more divergent specific company risk premiums, growth rates, and ongoing earnings levels.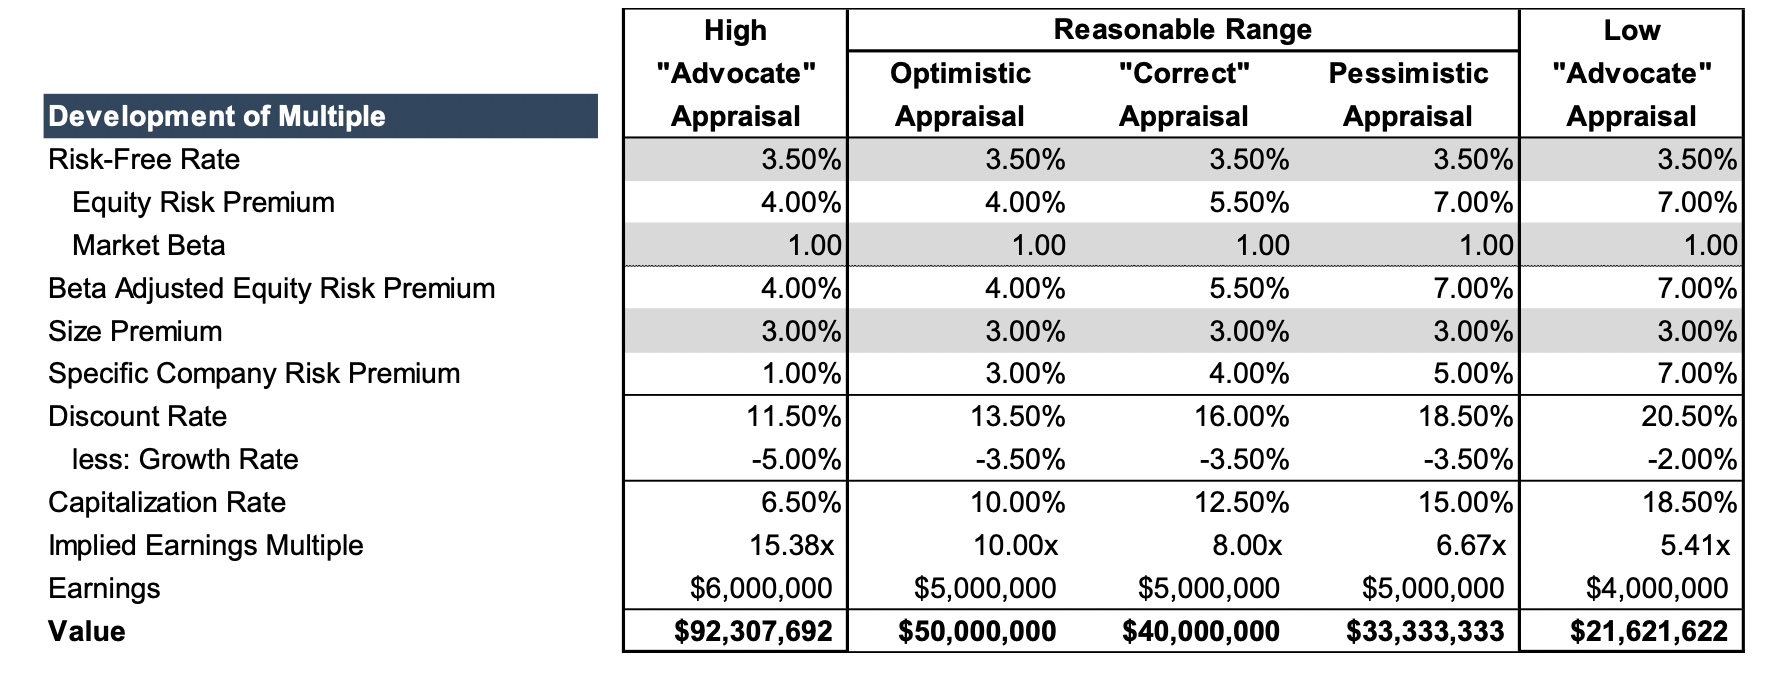
Given the assumptions in the figure, the “high” conclusion is more than quadruple the conclusion of the “low” appraisal ($92.3 million versus $21.6 million). As presented above among the scenarios, i.e., next to the more reasonable range, neither the high or low is reasonable and are examples of conclusions that are likely advocative in nature, rather than providing independent conclusions of value.
Concluding Thoughts
Many assumptions that make up an appraisal are interrelated. Risk is a function of the assessment of ongoing earnings. If earnings are assumed to be much lower than the company has recently demonstrated, it makes sense that the risk in achieving lower performance would be lower than assuming the status quo or further increases in earnings. With earnings and risk being two of the key inputs in a valuation, it is important that each are reasonable on their own and when considered together.
In the “high” example above, the appraiser uses high-end earnings and growth and low-end risk assumptions. There is likely a double counting of positive factors. In the “low” example, the appraiser uses low-end earnings and growth, and high-end risk assumptions. There is likely some double counting of negative factors there.
NIB Deposits Anesthetize Bond Pain
The August Bank Watch looks at unrealized losses in bank bond portfolios based upon Call Report data as of June 30, 2022. Our review of unrealized losses as of March 31 can be found here.
Fed Chair Powell gave a short 8-minute speech on August 26 at the annual Jackson Hole, Wyoming economic summit that is hosted by the Federal Reserve Bank of Kansas City. The gist of Powell’s speech is that the Fed is solely focused on reducing inflation. Powell’s speech in 2021 discussed “transitory” inflation and the timing of when the Fed might begin to reduce its monthly purchase of $120 billion of U.S. Treasuries (“UST”) and Agency MBS. At the time consumer prices were then advancing around 5% vs 9% now.
Last year, equity markets liked what it heard from Powell at Jackson Hole regarding the liquidity spigot; not so this year as the S&P 500 declined 3.4% and the NASDAQ declined 3.9% the day Powell spoke. The NASDAQ Bank Index declined 2.4% and is down 12.8% year-to-date through August 26.
Interestingly, UST yields did not move much even though Powell said it would not be appropriate to stop hiking at a “neutral” rate. As such, bank bond portfolios did not incur additional losses. In fact, the peak loss for most bank bond portfolios was in mid-June when the yield on the 10-year UST rose to 3.49% compared to 2.98% on June 30 and 3.04% on August 26.
Based upon our review of bank second quarter earnings calls and analysts’ write-ups, investors seem to be taking the losses in stride given solid growth in spread revenues as NIM expansion has been dramatic. Last spring that was not the case when the ~150bps increase in intermediate- and long-term rates produced significant losses in bond portfolios given little coupon to cushion the higher term structure.
As shown in Figure 1, the Fed has hiked the Funds target rate much faster and by a greater magnitude than it did in 1994 when the Fed waylaid the bond market with 300bps of hikes. Bond portfolios were hammered as the hikes and an upturn in inflation drove longer-term rates higher by ~275bps. The curve became flatter but never inverted as investors assumed a recession would not develop.1
Figure 1: 1994 Bond Bear Market vs 2022 Bond Bear Market
Powell’s comments last week imply short-term policy rates may go as high as 4% by next Spring based upon futures markets. Given little movement in UST yields, bond investors are pricing in slowing economic activity and possibly lower yields to come. If so, the inverted UST curve prospectively will become more inverted if the Powell Fed can stomach the seemingly probable fallout as it pushes short rates higher.
Figure 2: Unrealized Bond Portfolio Losses vs Cost Basis and Tier 1 Capital
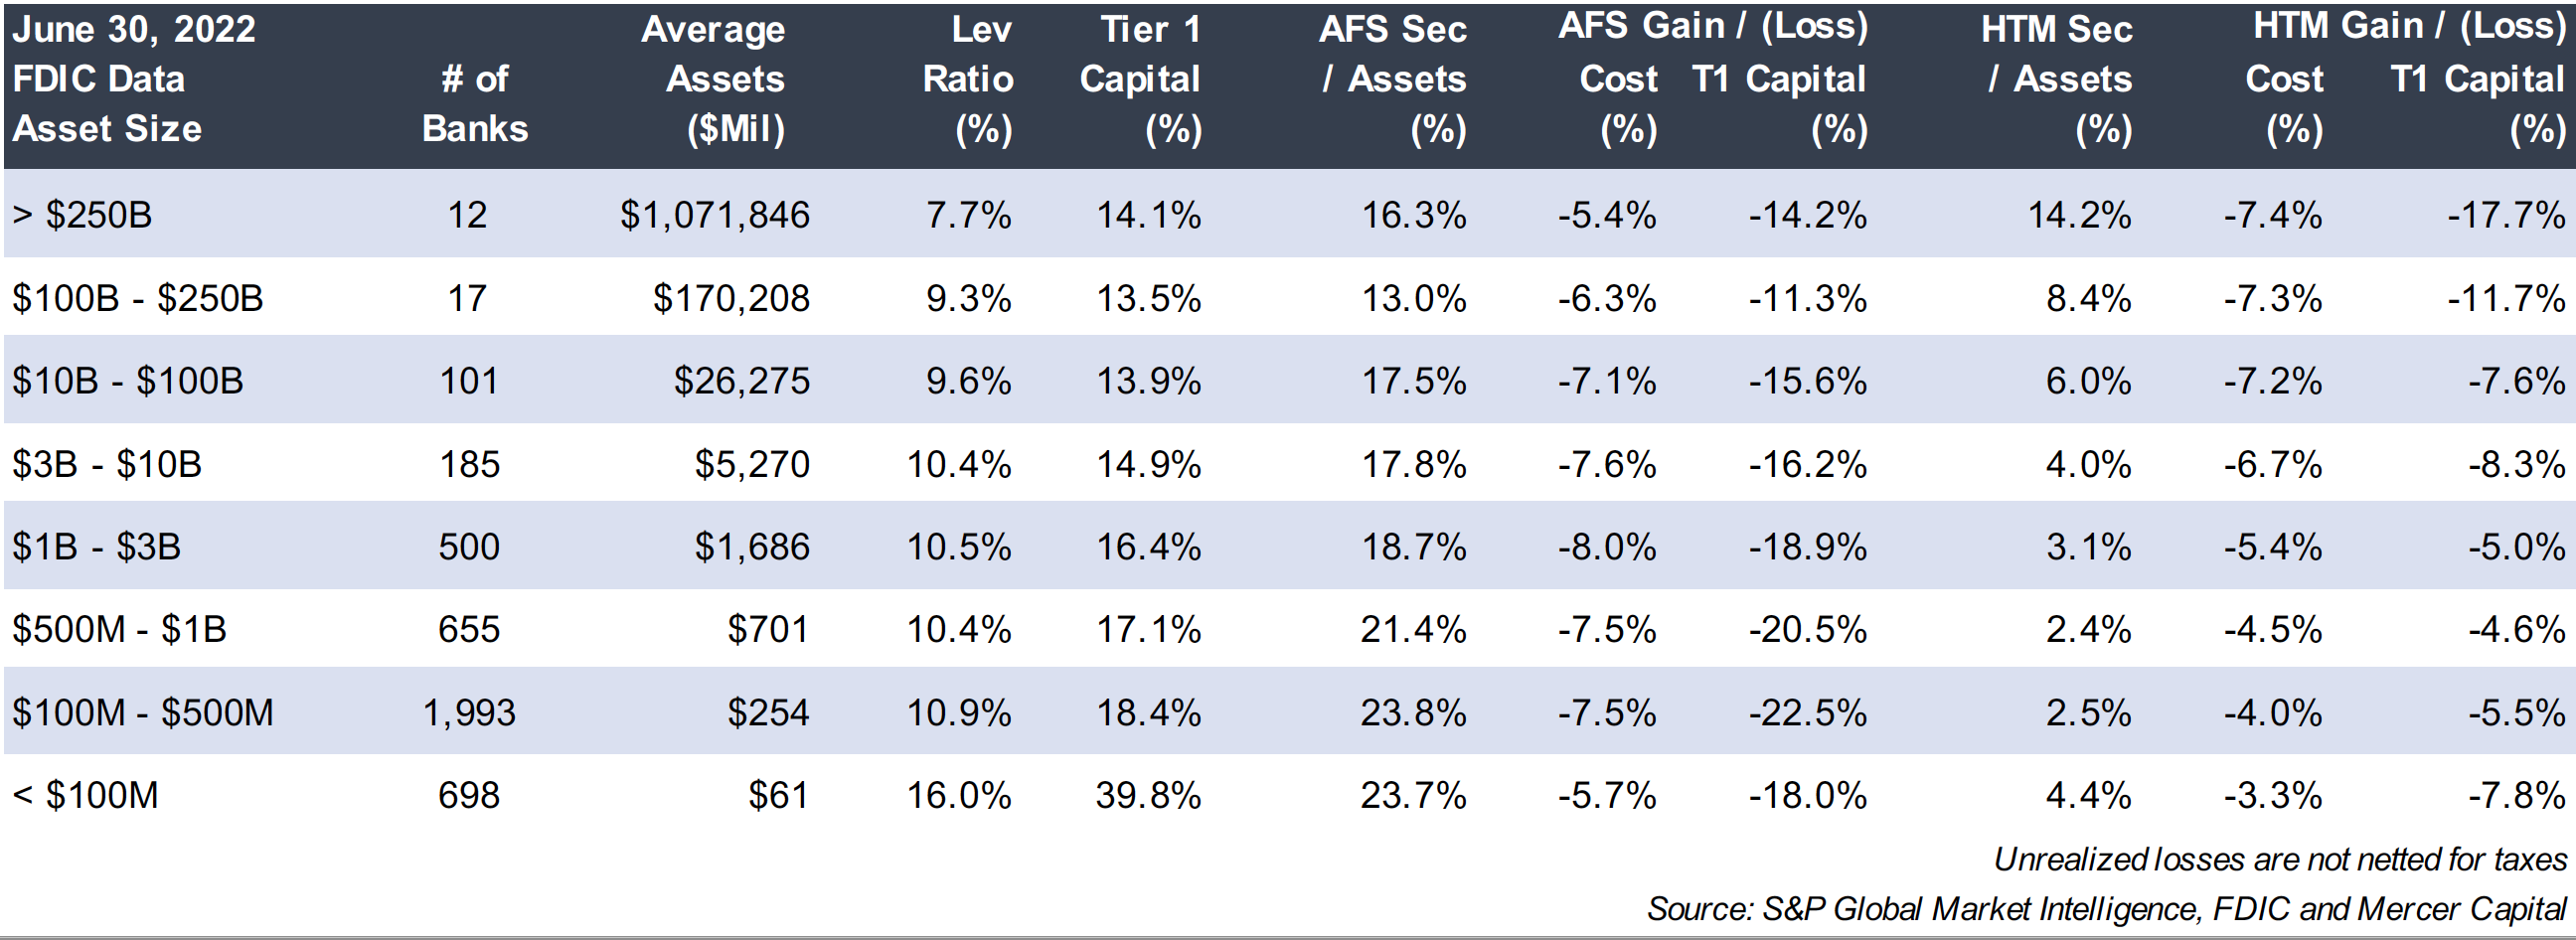
Click here to enlarge the image above
Figure 3: Unrealized Bond Portfolio Losses vs Cost Basis and Tier 1 Capital
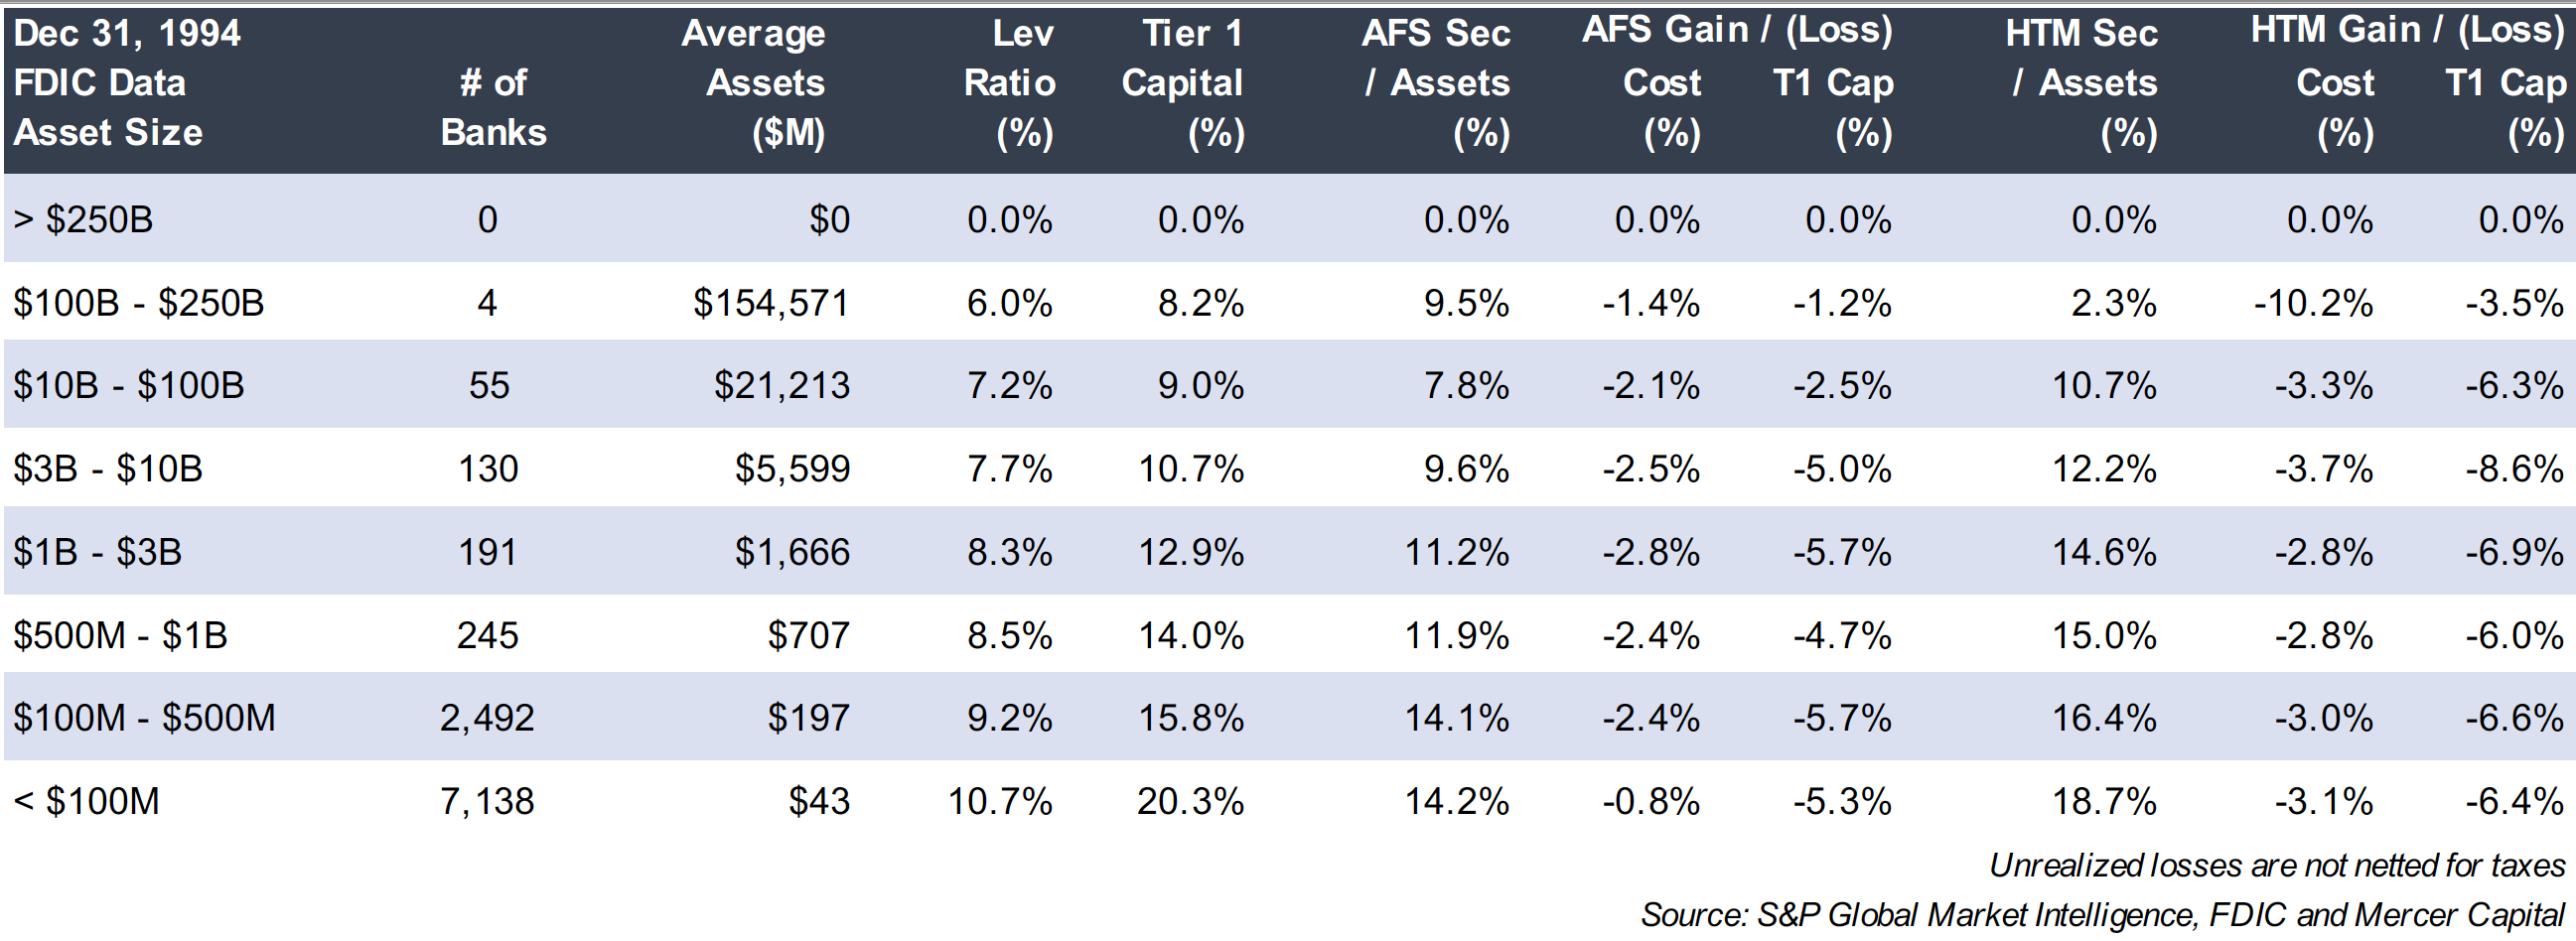
Click here to enlarge the image above
As shown in Figure 2, unrealized losses as of June 30 were significant though losses and gains are excluded from regulatory capital for all but the largest banks.
Unrealized losses in available-for-sale (“AFS”) designated portfolios ranged from an average of 5.7% of cost for banks with less than $100 million of assets to 8.0% for banks with $1 billion to $3 billion of assets. As a percent of tier one capital the range was from 11.3% for banks with $100 billion to $250 billion of assets to 22.5% for banks with $100 million to $500 million of assets.
Figure 3 provides the same data as of year-end 1994 when the ten-year UST was near a cyclical peak of ~8%. The bear market of 2022 is far worse than the 1994 bear market. Unlike 1994, portfolios today have little coupon to cushion the impact of rising rates. Also, duration may be longer today.
The “coupon issue” today is reflected in low portfolio yields. As an example, the average taxable equivalent portfolio yield for banks with $1 billion to $3 billion of assets was only 1.96% in 2Q22 compared to 1.80% in 4Q21 immediately before the Fed began to hike. By way of comparison, the yield on one-month T-bills as of August 26 was 2.21% and 30-day LIBOR was 2.49%. Cash yields more than bond portfolios and prospectively will yield much more if the Fed pushes the Funds target to 4% by next spring.
The good news is that portfolio cash flow should be reinvested at much higher yields to the extent it is not used to fund loan growth or deposit run-off. The same applies to fixed rate loans, which are not marked-to-market but may have comparable losses given both higher rates and wider credit spreads.
The exceptionally good news is that non-interest-bearing (“NIB”) deposits, which are the core of core deposits, are driving NIM expansion and growth in spread revenues. Rate hikes this year are inflating the value of NIB deposits. There is no mark-to-market report for a board to see this; rather, the value is in the income statement.
The unknowable question is if the Fed can push short-term rates higher without producing a sharp downturn or serious credit event that forces the Fed to blink again. The downturn in bank stocks this year primarily reflects investor expectations about the potential impact a recession would have on credit costs next year; it is not about unrealized losses in bond portfolios.
Figure 4: Credit Spreads Widen
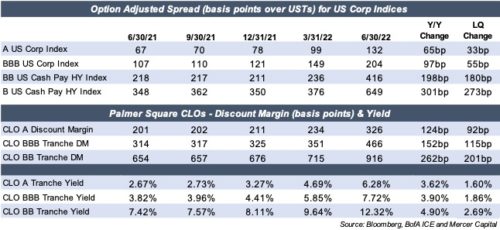
Click here to enlarge the image above
About Mercer Capital
Mercer Capital is a national valuation and transaction advisory firm that has advised banks for 40 years through bear and bull markets. Please call if we can be of assistance.
1 The Fed rate hiking campaigns of 2004-2006 (425bps of cumulative hikes to 5.25%) and 2015-2018 (225bps to 2.50%) did not produce as great of losses as the current cycle and 1994. The curve was exceptionally steep in 2004 such that long-term UST rates rose less than 100 bps (Greenspan called it a “conundrum”) while it took a couple of years for long-term yields to peak in 2018 around 3% vs the “all-at-once” episode this year.
The Importance of Purchase Price Allocations to Acquirers
This is the final article in a series on buy-side considerations. In this series, we will cover buy-side topics from the perspective of middle-market companies looking to enter the acquisition market. If you wish to read the rest of the series, click here.
Growing up an avid sports fan, I always enjoyed picking up the paper and flipping to the sports section to see the box scores from the prior day’s games. While the headline score told you who won or lost, the box score gave more information and insights into who played well and the narrative of the game. For example, the box score might tell you that even though your favorite team won, they were dominated by the other team in all the categories except turnovers, or that the team that lost actually “won” each quarter except the fourth and their star player had a bad game.
In my view, a purchase price allocation is similar to a box score in that it provides greater detail from which to derive insights on a particular transaction. While a purchase price allocation (PPA) analysis is primarily an accounting (and compliance driven) exercise, it is also a window into the objectives and motivations behind the transaction. When used proactively and/or during the M&A process, the disciplines of PPA analysis can provide buyers with important perspective concerning the unique value attributes of the target’s intangible asset base, which can help rationalize strategic acquisition consideration or forewarn of potentially unstable or short-lived intangible asset value.
Below we explore PPAs further with a broad overview and then a deeper look into the pitfalls and best practices related to them.
Introduction to PPAs
Acquirers conduct PPAs to measure the fair value of various tangible and intangible assets of the acquired business. Any excess of the total asset value implied by the transaction over the fair values of identified assets is ascribed to the residual asset, goodwill.
Intangible assets commonly identified and measured as part of PPA analyses include:
- Trade name – Trade name intangibles may be valuable if they enhance the expected future cash flows of the firm, either through higher revenue or superior margins. The relief from royalty method, which seeks to simulate cost savings due to the ownership of the name, is frequently used to measure the value of trade names.
- Customer relationships – Customer relationships can be valuable because of the expectation of recurring revenue.
- Technology – Technologies developed by the target business are valuable because the acquirer avoids associated development or acquisition costs. Patents and other forms of intellectual property may provide legal protection from competition and help secure uniqueness and/or differentiation.
- IPR&D – Ongoing R&D projects can give rise to in-process research and development intangible assets, whose values are predicated on expected future cash flows.
- Contractual assets – Contracts that lock in pricing advantages – above market sales prices or below market costs – create value by enhancing cash flow.
- Employment / Non-competition agreements – Employment and non-competition agreements with key executives ensure a smooth transition following an M&A transaction, which can be vital in reducing the likelihood of employee or customer defection.
The value of an enterprise is often greater than the sum of its identified parts (both tangible and intangible), and the excess is usually reflected in the residual asset, goodwill. GAAP goodwill also captures facets of the target that may be value-accretive, but do not meet certain criteria to be identified as an intangible asset. Notably, fair value measurement presumes a market participant perspective. Goodwill may also include acquirer-specific synergistic or strategic considerations that are not available to other market participants. Consequently, goodwill has tended to account for a significant portion of allocated value in truly strategic business combinations.
Pitfalls and Best Practices of PPAs
Below we highlight some pitfalls and best practices gleaned from providing purchase price allocations to acquirers since the advent of fair value accounting.
What are some of the pitfalls in purchase price allocations?
Sometimes differences arise between expectations or estimates prior to the transaction and fair value measurements performed after the transaction. An example is contingent consideration arrangements – estimates from the deal team’s calculations could vary from the fair value of the corresponding liability measured and reported for GAAP purposes. To the extent amortization estimates are prepared prior to the transaction, any variance in the allocation of total transaction value to amortizable intangible assets and non-amortized, indefinite lived assets – be they identifiable intangible assets or goodwill – could also lead to different future EPS estimates for the acquirer.
What are the benefits of looking at the allocation process early?
The opportunity to think through and talk about some of the unusual elements of the more involved transactions can be enormously helpful. Similar to a coach who may look at the box score from the first half of a game during the halftime break, we view the dialogue we have with clients when we prepare a preliminary PPA estimate prior to closing as a particularly important part of the M&A project. This deliberative process results in a more robust – well-reasoned analysis that is easier for the external auditors to review, and better stands the test of time requiring fewer true-ups or other adjustments in the future. Surprises are difficult to eliminate, but as they say, forewarned is forearmed.
Can goodwill be broken into different components?If so, what are the different components and how are they delineated?
In the world of FASB, goodwill is not delineated into personal goodwill and corporate or enterprise goodwill. However, in the tax world, this distinction can be of critical importance and can create significant savings to the sellers of a C corporation business.
Many sellers prefer that a transaction be structured as a stock sale, rather than an asset sale, thereby avoiding a built in gains issue and its related tax liability. Buyers want to do the opposite for a variety of reasons. When a C corporation’s assets are sold, the shareholders must realize the gain and face the issue of double taxation whereby the gain is taxed at both the corporate level, and again at the individual level when proceeds are distributed to the shareholders. Proceeds that can be allocated to the sale of a personal asset, such as personal goodwill, may mitigate the double taxation issue.
The Internal Revenue Service defines goodwill as “the value of a trade or business based on expected continued customer patronage due to its name, reputation, or any other factor.”1 Recent Tax Court decisions have recognized a distinction between the goodwill of a business itself and the goodwill attributable to the owners/professionals of that business. This second type is typically referred to as personal (or professional) goodwill (a term used interchangeably in tax cases).
Personal goodwill differs from enterprise goodwill in that personal goodwill represents the value stemming from an individual’s personal service to that business, and is an asset owned by the individual, not the business itself. This value would encompass an individual’s professional reputation, personal relationships with customers or suppliers, technical expertise, or other distinctly personal abilities which provide economic benefit to a business. This economic benefit is in excess of any normal return earned on other tangible or intangible assets of the company.
What other problems/issues beyond a PPA can you help acquirers navigate?
As part of our full suite of services for acquirers, we can handle a number of different kinds of special projects that corporate finance departments may be looking to outsource, completely or partially. For example, our firm helps clients think through certain financial or strategic questions – what level of cash flow reinvestment will best balance competing shareholder interests? Or, what is the appropriate hurdle rate when evaluating internal projects vs. acquisitions for capital budgeting exercises? In other instances, we perform financial due diligence and quality of earnings analyses for transactions.
Conclusion
As the “box score” of transactions, PPAs can be an important tool for acquirers and provide greater insight into the motivations and narrative behind a transaction by illustrating the value of various intangible components of a business beyond the collection of tangible assets and how those compare to the purchase price being paid. Our purchase price allocations can be more robust with fewer surprises when we have also worked with the clients before the close of the transaction on elements such as financial due diligence or contingent consideration estimates, or even broader corporate finance and PPA studies.
Mercer Capital has extensive experience valuing intangible assets for purchase price allocations (ASC 805), impairment testing (ASC 350), and fresh-start accounting (ASC 852) and assisting buyers during financial due diligence. Call us – we would like to help.
1 IRS Publication 535: Business Expenses, Ch. 9, Cat. No. 15065Z
Navigating Tax Returns | Tips and Key Focus Areas for Family Law Attorneys and Divorcing Individuals/Business Owners
This piece is designed to help you better understand how to navigate tax returns on behalf of your clients. Why? The information contained in tax returns can provide support for marital assets and liabilities, sources of income, business ownership(s), and can lend cause for further analysis. Reviewing multiple years of tax returns and accompanying supplemental schedules may provide helpful information on trends and/or changes and could indicate the need for forensic investigations.
We know you are not a forensic or finance specialist but in your role as a family law attorney, understanding the tax returns schedules, disclosures, and why that information is important can be valuable. That is what this short piece provides you. Form 1040, Schedule A (Itemized Deductions), Schedule K-1 and other relevant business-related schedules are addressed in this short, easy to read and easy to understand piece. We hope you will find this a handy reference that will become a well-worn resource in your practice.
Mercer Capital is a national business valuation and advisory firm providing subject matter and industry-related expertise in financial, valuation, and forensic services. You’ll find more information about our national litigation team in this piece and here. When your clients have business valuation and/or forensic needs, please don’t hesitate to contact us.
Buy-Side Solvency Opinions
This is the ninth article in a series on buy-side considerations. In this series, we will cover buy-side topics from the perspective of middle-market companies looking to enter the acquisition market. If you wish to read the rest of the series, click here.
With the potential rise of corporate bankruptcies, if the U.S. enters a sufficiently deep recession next year, debt funded acquisitions and dividend recap transactions that were common the past couple of years after rates plunged may be subject to intense scrutiny. Of course, if there is no recession or only a shallow recession, then these musings may be premature.
Nonetheless, acquirers who anticipate levering a target’s capital structure and owners who are contemplating a dividend recap should be familiar with solvency opinions and the concept of fraudulent conveyance, concepts that were litigated in the 2020 bankruptcy of Neiman Marcus.
Neiman Marcus: A Restructuring Case Study
What Is a Solvency Opinion?
The Business Judgement Rule, an English case law doctrine followed in the US and Canada, provides directors with great latitude in running the affairs of a corporation provided directors do not breach their fiduciary duties to act in good faith, loyalty and due care. However, there are instances when state law prohibits certain actions including the fraudulent transfer of assets to stockholders that would leave a company insolvent.
This straightforward statutory prescription has taken on more meaning over the past decade because Corporate America has significantly increased its use of debt given very low interest rates. Investors have been willing to fund the increase because negligible rates on “safe” assets have pushed individuals and institutions further out the risk curve to produce income.
Transactions that may meaningfully alter the capitalization of a company include leveraged dividend recapitalizations, leveraged buyouts, significant share repurchases, and special dividends funded with existing assets. Often a board contemplating such actions will be required to obtain a solvency opinion at the direction of its lenders or corporate counsel to provide evidence that the board exercised its duty of care to make an informed decision should the decision be challenged.
A solvency opinion addresses four questions
- Does the fair value of the company’s assets exceed its liabilities after giving effect to the proposed action?
- Will the company be able to pay its debts (or refinance them) as they mature?
- Will the company be left with inadequate capital?
- Does the fair value of the company’s assets exceed its liabilities and surplus to fund the transaction?
A solvency opinion is typically performed by a financial advisor who is independent, meaning the advisor has not arranged financing or provided other services related to the contemplated transaction. The opinion is based upon financial analysis to address the valuation of the corporation and its cash flow potential to assess its debt service capacity.
Also, the opinion is just that—it is an informed opinion. It is not a pseudo statement of fact predicated upon the “known” future performance of the Company. It provides a reasonable perspective concerning the future performance of the Company while neither promising to stakeholders that those projections will be met, nor obligating the Company to meet those projections.
Test 1: The Balance Sheet Test
Does the fair value and present fair saleable value of the Company’s total assets exceed the Company’s total liabilities, including all identified contingent liabilities?
The balance sheet test is a valuation test in which the value of the company’s liabilities are subtracted not from the assets recorded on the balance sheet, but rather the fair market value of the firm on a total invested capital basis. The value of the firm on a debt-free basis is estimated via traditional valuation methodologies, including Discounted Cash Flow (“DCF”), Guideline Public Company and Guideline Transactions (M&A) Methods. In some instances, the Net Asset Value (“NAV”) Method may be appropriate for certain types of holding companies in which assets can be marked-to-market.
Test 2: The Cash Flow Test
Will the Company be able to pay its liabilities, including any identified contingent liabilities, as they become due or mature?
This question addresses whether projected cash flows are sufficient for debt service. A more nuanced view evaluates the question along three general dimensions:
- Revolver Capacity: If financial results approximate the forecast, does the Company have sufficient capacity, relying upon its revolving credit facility if necessary, to manage cash flow needs through each year?
- Covenant Violations: Does the projected financial performance imply that the Company will violate covenants of the credit or loan agreement, or the terms of any other credit facility currently in place or under consideration as part of the subject transaction?
- Ability to Refinance: Is it likely that the Company will be able to refinance any remaining balance at maturity?
Test 3: The Capital Adequacy Test
Does the Company have unreasonably small capital with which to operate the business in which it is engaged, as management has indicated such businesses are now conducted and as management has indicated such businesses are proposed to be conducted following the transaction?
The capital adequacy test is related to the cash flow test. A company may be projected to service its debt as payments come due, but a proposed transaction may leave the margin to do so too thin to address operating needs—something many companies discovered this year during which they were able to operate with high leverage as long as business conditions were favorable.
There is no bright line test for what “unreasonably small capital” means. We typically evaluate this concept based upon pro forma and projected leverage multiples (Debt/EBITDA and EBITDA/Interest Expense) relative to public market comps and rating agency benchmarks. While management’s projections represent a baseline scenario, alternative downside scenarios are constructed to asses the “unreasonably small capital” question in the same way downside scenario analyses are constructed to address the question of whether debts can be paid or refinanced when they come due.
Test 4: The Capital Surplus Test
Does the fair value of the Company’s assets exceed the sum of (a) its total liabilities (including identified contingent liabilities) and (b) its capital (as such capital is calculated pursuant to Section 154 of the Delaware General Corporation Law)?
The capital surplus test replicates the valuation analysis prescribed under the balance sheet test, but also includes the Company’s capital in the subtrahend (Hey! There is a word we haven’t seen since early primary school. The subtrahend is the value being subtracted.)
Section 154 of the Delaware General Corporation Law defines statutory capital as (a) the par value of the stock; or in stances when there is no par value as (b) the entire consideration received for the issuance of the stock. Capital as defined here is nuanced. Often it may be a small amount if par is some nominal amount such as a penny a share, but that may not always be the case. What is excluded is retained earnings (or deficit) from the equity account.
The Mosaic of Solvency
The tests described above are straightforward. Sometimes proposed transactions are straightforward regarding solvency, but often it is less clear—especially when the subject company operates in a cyclical industry. Every solvency analysis is unique to the subject transaction and company under review and requires an objective perspective to address the solvency issue.
Mercer Capital renders solvency opinions on behalf of private equity, independent committees, lenders and other stakeholders that are contemplating a transaction in which a significant amount of debt is assumed to fund shareholder dividends, an LBO, acquisition or other such transactions that materially lever the company’s capital structure.
Solvency Analysis as a Decision Tool
Not only is a solvency opinion a prudent tool for board members and other stakeholders, but the framework of solvency analysis is ready made to score strategic alternatives and facilitate capital deployment. If your board, senior management team, or capital providers need to discuss a significant financing in confidence, Mercer Capital’s advisory team is prepared to serve your needs.
Strategic Benefits of Stress Testing in an Uncertain Economic Environment
Having gone on many a camping trip over the years, the only consistency between these trips into the woods is that there is no consistency. While some trips might have beautiful weather, others might be plagued with storms, cold fronts, heat waves, or strong winds. The campsite may or may not have amenities. And most importantly, contending with the wildlife adds another variable that can’t be predicted. However, the key element of how the trip goes is how prepared we are. The trips where we assumed blue skies were by far the most stressful. If we prepared for different outcomes and weather based on the uncertainty of going into the woods, the trip could always be salvaged.
Banks and credit unions are currently facing a similar “into the woods” predicament, as the economic environment seems to grow more volatile and contradictory day by day. While hiring remains strong and unemployment continues to stay near historically low levels with the Bureau of Labor Statistics reporting 3.6% as of June 2022, other indicators are flashing warning signs.
Inflation concerns continues to plague the economy after accelerating to 9.1% in June 2022, the highest increase since November 1981. Drivers of inflation in the past several months include rising food and gas prices as global supply remains disrupted from Russia’s invasion of Ukraine and the remnants of the pandemic. Economists are taking notice, with nearly 70% of economists surveyed by the Financial Times and the Initiative on Global Markets believing that the National Bureau of Economic Research (NBER) will make a call at some point in 2023 identifying a recession.
These conflicting indicators are convoluting the economic forecast through the rest of 2022 and 2023, and the differing potential circumstances would have very different impacts on banks and credit unions. Though this uncertainty can certainly cause headaches and stress for banks and credit unions worried about their capital positions in a severely adverse economic scenario, stress testing can help to prepare your bank or credit union in the face of uncertainty and help to optimize strategic decisions.
Stress Test Overview
A stress test is defined as a risk management tool that consists of estimating the bank’s financial position over a time horizon – approximately two years – under different scenarios (typically a baseline and severely adverse scenario). The OCC’s supervisory guidance in October 2012 stated “community banks, regardless of size, should have the capacity to analyze the potential impact of adverse outcomes on their financial conditions.” 1 Further, the OCC’s guidance considers “some form of stress testing or sensitivity analysis of loan portfolios on at least an annual basis to be a key part of sound risk management for community banks.” 2 A stress test can be defined as “the evaluation of a bank’s financial position under a severe but plausible scenario to assist in decision making with the bank.” 3
There are a few different types of stress tests that banks and credit unions can utilize in estimating their financial position:
Transaction Level Stress Testing: This method is a “bottom up” analysis that looks at key loan relationships individually, assesses the potential impact of adverse economic conditions on those borrowers, and estimates loan losses for each loan.
Portfolio Level Stress Testing: This method involves the determination of the potential financial impact on earnings and capital following the identification of key portfolio concentration issues and assessment of the impact of adverse events or economic conditions on credit quality. This method can be applied either “bottom up,” by assessing the results of individual transaction level stress tests and then aggregating the results, or “top down,” by estimating stress loss rates under different adverse scenarios on pools of loans with common characteristics.
Enterprise-Wide Level Stress Testing: This method attempts to take risk management out of the silo and consider the enterprise-wide impact of a stress scenario by analyzing “multiple types of risk and their interrelated effects on the overall financial impact.” 4 The risks might include credit risk, counter-party credit risk, interest rate risk, and liquidity risk. In its simplest form, enterprise-wide stress testing can entail aggregating the transaction and/or portfolio level stress testing results to consider related impacts across the firm from the stressed scenario previously considered.
By utilizing one or more of these stress testing exercises, banks and credit unions can better position themselves for multiple different economic scenarios in order to assure they have sufficient capital and financial strength to withstand an economic downturn if there is one.
Economic Scenarios Overview
One question that often arises is: Given the uncertainty, what economic scenarios should we consider in our stress testing? While it is difficult to answer this question, the most recent Stress Test scenarios prepared by the Federal Reserve are described in a February 2022 report, 2022 Supervisory Scenarios for Annual Stress Tests Required under the Dodd-Frank Act Stress Testing Rules and the Capital Plan Rule, and provide some guidance to assist with this decision. The scenarios start in the first quarter of 2022 and extend through the first quarter of 2025. Each scenario includes 28 variables, nineteen of which are related to domestic variables in the U.S.
While the more global economic conditions detailed in the Fed’s supervisory scenarios may not be applicable to community banks or credit unions, certain domestic variables within the scenarios could be useful when determining the economic scenarios to consider. The domestic variables include six measures of real economic activity and inflation, six measures of interest rates, and four measures of asset prices. The baseline scenario includes an economic expansion over the 13-quarter scenario period, while the severely adverse scenario is a hypothetical scenario that includes a severe global recession, accompanied by heightened stress in commercial real estate and corporate debt markets. Below, we have included charts of some of the more relevant domestic variables (GDP, unemployment rates, the Prime Rate, and commercial/residential real estate prices) and their historical levels through year-end 2021 as well as the Fed’s assumptions for those variables in the baseline and severely adverse scenarios.
2022 Supervisory Economic Scenarios Overview

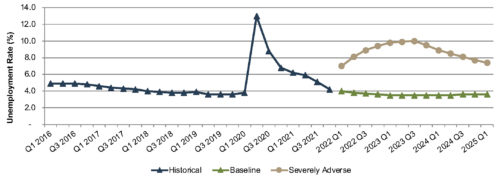
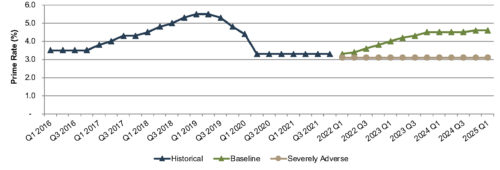
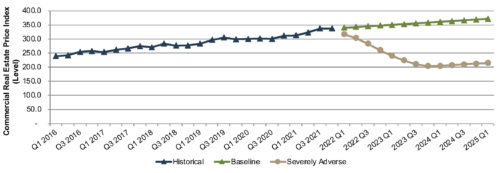
Benefits of the Stress Test
As the U.S. moves into a more uncertain economic environment, a financial institution’s preparation for its trip “into the woods” of this uncertain economic environment can reap dividends. Improved valuation, performance enhancement from enhanced strategic decisions, and risk management are some of these benefits. Greater clarity into the bank or credit union’s capital position, credit risk, and earnings outlook under different economic circumstances helps management to make more informed operational decisions.
Conclusion
We acknowledge that bank and credit union stress testing can be a complex exercise. The bank or credit union must administer the test, determine and analyze the outputs of its performance, and provide support for key assumptions/results. There is also a variety of potential stress testing methods and economic scenarios to consider when setting up their test. In addition, the qualitative, written support for the test and its results is often as important as the results themselves. For all of these reasons, it is important that bank and credit union management begin building their stress testing expertise sooner rather than later.
In order to assist financial institutions with this complex and often time-consuming exercise, we offer several solutions, including preparing custom stress tests for your institution or reviewing ones prepared by the institution internally, to make the process as efficient and valuable as possible.
To discuss your stress testing needs in confidence, please do not hesitate to contact us. For more information about stress testing, click here.
Endnotes
1OCC 2012-33 “Supervisory Guidance” on Community Bank Stress Testing dated October 18, 2012 and accessed at www.occ.gov/news-issuances/bulletins/2012/bulletin-2012-33.html.
2 Ibid.
3 “Stress Testing for Community Banks” presentation by Robert C. Aaron, Arnold & Porter LLP, November 11, 2011.
4 OCC 2012-33 “Supervisory Guidance” on Community Bank Stress Testing dated October 18, 2012 and accessed at www.occ.gov/news-issuances/bulletins/2012/bulletin-2012-33.html.
Buy-Side Fairness Opinions: Fair Today, Foul Tomorrow?
This is the eighth article in a series on buy-side considerations. In this series, we will cover buy-side topics from the perspective of middle-market companies looking to enter the acquisition market. If you wish to read the rest of the series, click here.
Directors are periodically asked to make tough decisions about the strategic direction of a company. Major acquisitions are usually one of the toughest calls boards are required to make.
A board’s fiduciary duty to shareholders is encapsulated by three mandates:
- Act in good faith;
- Duty of care (informed decision making); and
- Duty of loyalty (no self-dealing; conflicts disclosed).
Directors are generally shielded from courts second guessing their decisions by the business judgment rule provided there is no breach of duty to shareholders. The presumption is that non-conflicted directors made an informed decision in good faith. As a result, the burden of proof that a transaction is not fair and/or there was a breach of duty resides with the plaintiffs.
An independent fairness opinion helps demonstrate that the directors of an acquiring corporation are fulfilling their fiduciary duties of making an informed decision.
Fairness opinions seek to answer the question whether the consideration to be paid (or received from a seller’s perspective) is fair to a company’s shareholders from a financial point of view. Occasionally, a board will request a broader opinion (e.g., the transaction is fair).
A fairness opinion does not predict where the buyer’s shares may trade in the future. Nor does a fairness opinion approve or disapprove a board’s course of action. The opinion, backed by a rigorous valuation analysis and review of the process that led to the transaction, is just that: an opinion of fairness from a financial point of view.
Delaware, the SEC and Fairness
Fairness opinions are not required under Delaware law or federal securities law, but they have become de rigueur in corporate M&A ever since the Delaware Supreme Court ruled in 1985 that directors of TransUnion were grossly negligent because they approved a merger without adequate inquiry and expert advice. The court did not specifically mandate the opinion be obtained but stated it would have helped the board carryout its duty of care had it obtained a fairness opinion regarding the firm’s value and the fairness of the proposal.
The SEC has weighed in, too, in an oblique fashion via comments that were published in the Federal Register in 2007 (Vol. 72, No. 202, October 19, 2007) when FINRA proposed rule 2290 (now 5150) regarding disclosures and procedures for the issuance of fairness opinions by broker-dealers. The SEC noted that the opinions served a variety of purposes, including as indicia of the exercise of care by the board in a corporate control transaction and to supplement information available to shareholders through a proxy.
Dow’s Sour Pickle
Buy-side fairness opinions have a unique place in corporate affairs because the corporate acquirer has to live with the transaction. What seems fair today but is deemed foul tomorrow, may create a liability for directors and executive officers. This can be especially true if the economy and/or industry conditions deteriorate after consummation of a transaction.
For instance, The Dow Chemical Company (“Dow”), a subsidiary of Dow Inc. (NYSE: DOW), agreed to buy Rohm and Haas (“RH”) for $15.4 billion in cash on July 10, 2008. The $78 per share purchase price represented a 75% premium to RH’s prior day close. The ensuing global market rout and the failure of a planned joint venture with a Kuwait petrochemical company led Dow to seek to terminate the deal in January 2009 and to cut the dividend for the first time in the then 97 years the dividend had been paid.
Ultimately, the parties settled litigation and Dow closed the acquisition on April 1, 2009 after obtaining an investment from Berkshire Hathaway (NYSE: BRK.A) and seller financing via the sale of preferred stock to RH’s two largest shareholders.
Dow was well represented and obtained multiple fairness opinions from its advisors (Citigroup, Merrill Lynch and Morgan Stanley). One can question how the advisors concluded a 75% one-day premium was fair to Dow’s shareholders (fairness is a mosaic and maybe RH’s shares were severely depressed in the 2008 bear market). Nonetheless, the affair illustrates how vulnerable Dow’s Board of Directors or any board would have been absent the fairness opinions.
Fairness and Elon
Before Elon Musk reneged on his planned acquisition of Twitter, Inc. (NYSE: TWTR) on July 8, 2022, one of the most recent contentious corporate acquisitions was the 2016 acquisition of SolarCity Corporation by Tesla Inc. (NASDAQGS: TSLA). Plaintiffs sought up to $13 billion of damages, arguing that (a) the Tesla Board of Directors breached its duty of loyalty, (b) Musk was unjustly enriched (Musk owned ~22% of both companies and was Chairman of both); and (c) the acquisition constituted waste.
Delaware Court of Chancery Judge Joseph Slights ruled in favor of Tesla on April 27, 2022. Slights noted courts are sometimes skeptical of fairness opinions; however, he was not skeptical of Evercore’s opinion, noting extensive diligence, the immediate alerting of the Tesla Board about SolarCity’s liquidity situation and the absence of prior work by Evercore for Tesla.
Tesla Walks the Entirely Fair Line with SolarCity
Tesla Walks the Entirely Fair Line with SolarCity
In March 2016, Jonathan Goldsmith retired from a long advertising stint for Dos Equis beer as the Most Interesting Man in the World with a final commercial in which he was sent on a one-way trip to Mars. The same month Elon Musk, arguably the most interesting man in global business then and now, was laying the ground work for the merger of Telsa, Inc. (NASDAQ: TSLA) and SolarCity Corporation of which he owned about 22% of both companies.
Fairness as an adjective means what is just, equitable, legitimate and consistent with rules and standards. As it relates to transactions, fairness is like valuation in that it is a range concept: transactions may not be fair, a close call, fair or very fair.
This presentation looks at the issues raised by plaintiffs who alleged Musk orchestrated the deal to bail-out SolarCity, and how the Delaware Court of Chancery ruled on the issues on April 27. 2022 under the entire fairness standard rather than deferential business judgment rule.


