
Key Takeaways
Haynesville outperformed peer basins, posting the strongest year-over-year production growth despite greater month-to-month volatility than oil-heavy regions.
Operational efficiency and DUC utilization supported production, enabling output growth even with rig counts well below prior cycle peaks.
Future growth remains price-dependent, with sustained Haynesville expansion requiring more durable natural gas price strength to justify increased drilling activity.
The economics of oil and gas production vary by region. Mercer Capital focuses on trends in the Eagle Ford, Permian, Haynesville, and Marcellus and Utica plays. The cost of producing oil and gas depends on the geological makeup of the reserve, depth of the reserve, and the cost to transport production to market. We can observe different cost structures across regions based on these factors. In this post, we take a closer look at the Haynesville shale .
Production & Activity Levels
Based on a barrels of oil equivalent (boe) basis, the Haynesville year-over-year (YoY) production growth led the four covered basins for the last year through November 2025 with an increase of 10.2%. That compared to the more modest YoY growth of 6.2% and 5.5% for the Permian and Appalachia respectively, and the near zero growth for the Eagle Ford. Haynesville production averaged 2.5 million barrels of oil equivalent per day (mboe/d) during the period, with production rates rising 11.2% to 2.7 mboe/d as of March 2025. Production eased back through June to levels just above the review period starting point at 2.4 mboe/d, before climbing back to 2.6 mboe/d in November 2025.

Among the other major basins, Appalachia production increased 5.5% YoY through November 2025, reflecting steady operational activity and improving regional natural gas demand. The Permian posted a slightly higher 6.2% production growth. Both Appalachia and Permian showed fairly steady growth over the course of the review period with only a few modest monthly declines. After a two month decline in production through January 2025, Eagle Ford production generally rose through June, before reversing into a general decline over the remainder of the review period. Over the review period, Haynesville production exhibited greater month to month volatility than the other basins, driven in part by Gulf Coast demand dynamics and infrastructure related timing effects.
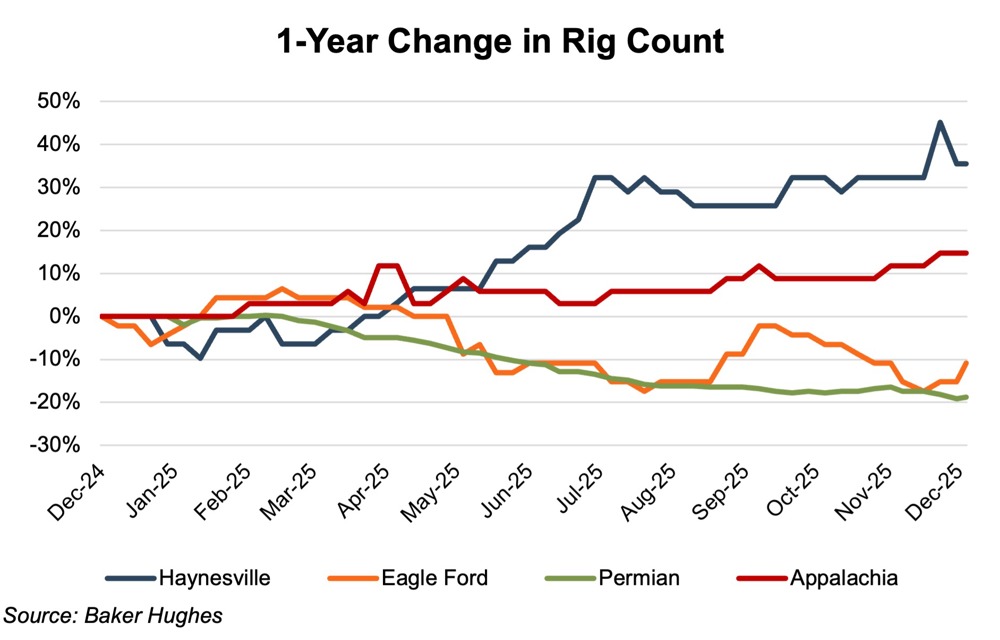
Rig count growth rates were bifurcated by primary commodity type, with the gas-heavy basins (Haynesville and Appalachia) seeing rig count growth over the review period, while oil-heavy basins (Permian and Eagle Ford) posting rig count declines. The Haynesville led the four covered regions with a YoY increase of 35% from 31 to 42 rigs. After a short-lived dip in January 2025, the Haynesville rig count surged 41% in just four months to reach 41 rigs in mid-July. Since then, the number of rigs in the Haynesville varied within a narrow range from 39 to 45 rigs. Despite the Haynesville rig counts rebounding from interim lows, they remain well below prior cycle peaks.
Appalachia posted the only other rig count YoY increase for the review period, albeit a more tepid 15% increase from 34 to 39 rigs. Unlike the Haynesville growth pattern, the Appalachia increase was fairly steady over the course of the year with only modest increases, or decreases, along the way.
The rig count story in the oil-heavy Permian and Eagle Ford basins was quite different from that of the gas-heavy basins. In light of oil prices falling 18% to 20%, as benchmarked by West Texas Intermediate (WTI) and Brent Crude (Brent) front-month future contracts, over the course of the review period, it’s no surprise that the Permian and Eagle Ford rig counts took a significant hit. The higher breakeven Eagle Ford basin saw its rig count up as high as 7% from December 2024 levels early in the review period, but the count generally declined over the remainder of the period, other than a short recovery in September. For the twelve month period, the Eagle Ford rig count slipped 11% from 46 rigs to 41. The lower breakeven Permian basin’s rig count decline was more steady than that for the Eagle Ford, but ended with a larger YoY slide of 19%, from 304 to 247 rigs.
The ability of Haynesville production to grow despite reduced drilling activity reflects ongoing efficiency gains and the continued drawdown of drilled but uncompleted wells (DUCs). Operators relied on previously drilled inventory and completion optimization to maintain production volumes even as rig counts declined. While this dynamic supported near term output, sustained production growth in the basin will depend on a more durable improvement in natural gas pricing and a corresponding increase in drilling activity.

Commodity Price Volatility
Natural gas prices, as benchmarked by Henry Hub natural gas front month futures prices, showed their typical ups and downs over the 2025 calendar year with low at $2.80 ($/mmbtu) in late August and a high of $5.06 in early December. Prices began the year at $3.10 and generally climbed through early March to reach a first quarter high of $4.54, resulting from colder winter temperatures and wellhead freeze offs tightening supplies. As the heating season concluded and inventories rebuilt, prices generally retreated through the spring and summer months, reaching the review period low of $2.81 in late August. A renewed rally began in the fall, supported by early seasonal demand and tightening storage balances, with Henry Hub price hitting the review period high of $5.06 during the first week in December.
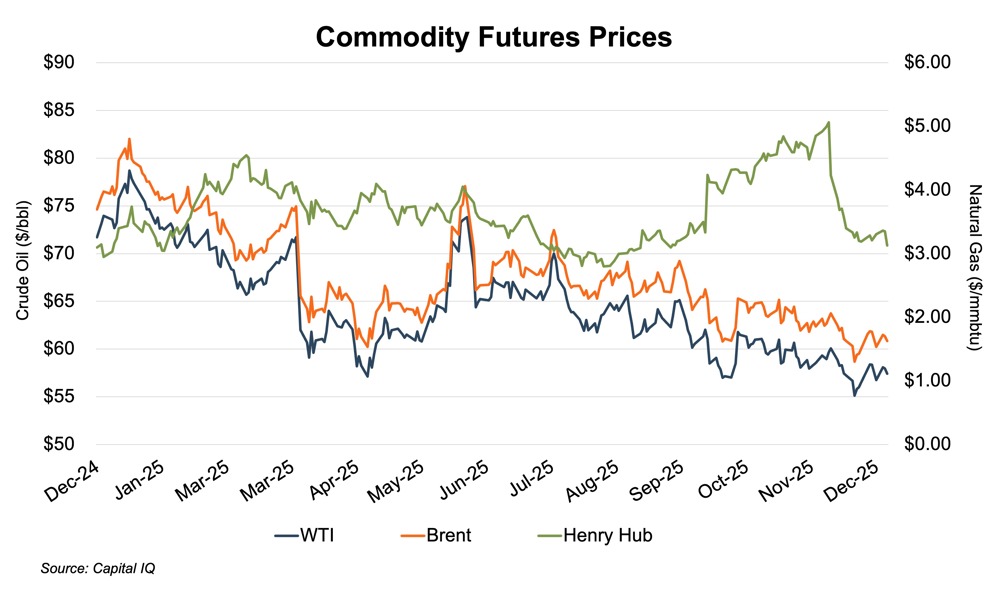
Oil prices, as benchmarked by West Texas Intermediate and Brent Crude front-month future contracts showed notably higher volatility in 2025, relative to 2024. The benchmarks’ reached their review period high in mid-January with the WTI peaking at $78.71 and the Brent at $82.03. Prices generally eased downward over the following two months before rallying back to their second quarter highs of $71.71 and $74.95 on April 2nd. That rally was trampled over the following week with prices plunging 15% to 17% in just eight days, for the steepest percentage drop since 2022, resulting from the combined unexpected jump in OPEC+ output and weakening demand concerns related to President Trump’s sweeping new import tariffs. The benchmarks dipped again during the last days of April and the first days of May reaching their first half of 2025 lows at $57.13 (WTI) and $60.23 (Brent).
The futures prices headed upward again through early June, in part due to favorable U.S.-China trade talks and a favorable U.S. jobs report, both pointing to increasing demand. However, prices surged in mid-June as Israel and U.S. tensions with Iran rose to the point of four successive aerial attacks (aircraft, missiles and drones) – Israel on Iran, Iran on Israel, U.S. on Iran and Iran on a U.S. base in Qatar. Prices spiked to the review period’s second highest level with the WTI reaching $75.40 and the Brent reaching $77.08. However, fears of escalation were quelled just as rapidly as they had emerged, with the benchmark prices lurching back to pre-attack levels within the following week.
For the six-month remainder of the review period the benchmark price volatility returned to more typical levels, with a general decline to the review period lows of $55.13 (WTI) and $58.67 (Brent) in mid-December.
Financial Performance
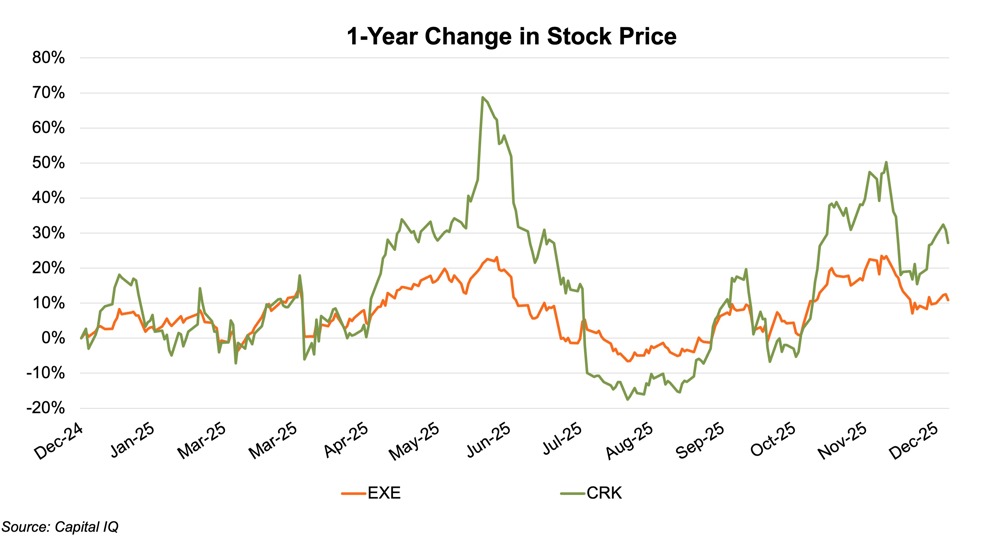
The Haynesville public comp group – Comstock Resources (CRK) and Expand Energy (EXE) – posted YoY stock price returns of 27% and 11%, respectively, in 2025. While the companies’ stock price movements were largely consistent in direction, CRK’s were greater in magnitude resulting from CRK’s greater use of financial leverage and lower level of geographic (basin) diversification. Stock prices remained within a narrow range through April, rose on Middle East tensions in May and spiked as Israel, Iran and the U.S. traded attacks in June. Following the Middle East concerns related spike, the companies’ stock prices generally rose and fell with natural gas prices – declining through August and rising through November, before the short-lived dip in the first two weeks of December.
Conclusion
The Haynesville demonstrated resilient performance in 2025, with production growth outpacing peer basins despite pronounced month-to-month volatility. Output gains were supported by efficiency improvements and DUC drawdowns, even as rig activity, while rebounding meaningfully from interim lows, remained well below prior cycle peaks. Natural gas front-month futures pricing provided episodic support for activity, with seasonal demand and tightening balances driving a late-year rally after summer weakness.
We have assisted many clients with various valuation needs in the upstream oil and gas space for both conventional and unconventional plays in North America and around the world. Contact a Mercer Capital professional to discuss your needs in confidence and learn more about how we can help you succeed.