Corporate Valuation, Oil & Gas

October 22, 2018

How to Interpret Breakeven Prices

Before mid-2014, few investors took notice of efficiency-oriented metrics, instead focusing on stories of new oil discoveries and the development of new wells and new technologies.  Since the crash in oil prices, a new measure of success was brought to the forefront:  breakeven prices.

Since the crash in oil prices, a new measure of success was brought to the forefront:  breakeven prices.

Over the last couple of years, E&P companies have become more efficient, forced to create investor returns at $40 - $50/barrel oil.  Well productivity has improved as companies drilled longer laterals and used less proppant.  After the crash in oil prices, oilfield services companies lowered their prices to compete for limited work.  As oil prices recovered, the price of oilfield services was slow to catch up.  Additionally, companies have more capital discipline than they ever did at $100/barrel oil prices.

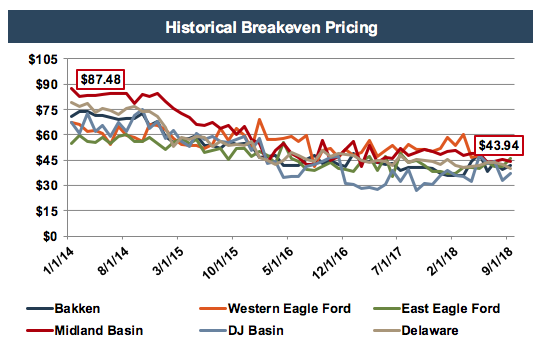
Even as oil prices have started to recover, companies are showing lower breakeven costs than ever before.  As shown in the chart below, breakeven prices in the Midland Basin fell by 50% from $87 in January 2014 to $44 in September 2018.

As more companies present this metric and more investors rely on it as an indication of performance, it becomes increasingly important to understand what it actually measures, and if breakeven prices can be compared consistently from company to company.

What is a Breakeven Price?

The Wall Street Journal stated, “At its simplest, the metric represents the oil price that a company needs to generate enough cash so it can cover its capital spending and dividend payouts.”  Most public E&P companies report breakeven costs in their investor presentations, oftentimes measuring themselves against peers.  However, these companies rarely explain how they develop these metrics.  Some companies, such as Chevron, don’t include covering dividends in this metric.  Additionally, some companies look at project-specific breakeven prices which don’t always cover all spending and dividends.

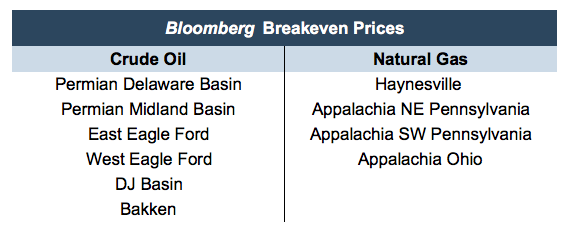
Many analysts and investors, including our oil and gas team, track Bloomberg New Energy Finance for region specific breakeven prices.  Beginning in January 2014, Bloomberg began publishing monthly breakeven oil prices and breakeven natural gas prices for the following regions.

According to Bloomberg, breakeven prices by region are sourced from BTU Analytics and provide:
Average wellhead breakeven prices estimates for all wells turned to sales each month.  Well economics calculations use a 10% discount rate. Well life is assumed to be 240 months. Gathering, processing, compression, fractionation, and operating expenses are estimated for individual basins and plays.

While somewhat helpful, this definition leaves a lot unexplained.   We talked to BTU Analytics so that we could better understand what it calculates.

BTU Analytics’ data set includes 60,000 horizontal wells from 2013 to present across major basins in the continental U.S.  Their data is collected at the well level and calibrated with production data from state agencies and reconciled with overarching trends discussed by major regional operators.

BTU’s breakeven measure on Bloomberg is a half-cycle breakeven price, meaning that all operating costs from drilling to completion of the well are accounted for. Additionally, the costs to keep the well operating such as taxes, royalties, and gathering and compression costs are included. However, what is not included in Bloomberg’s breakeven calculation is just as important.

What is Not Included in Bloomberg’s Breakeven Prices?

Notably, the Bloomberg Breakeven Price does not include wellhead differentials.  This means, that breakeven prices in the Permian are based off the WTI-Cushing benchmark, not off the regional hub which traded at as high of an $18 discount in August, according to pricing information from Bloomberg.

As the Permian Basin struggles with bottlenecks, differentials have become exceedingly important to consider.  Although there are plans underway to address the growing need for infrastructure in the Permian Basin, adjusting Bloomberg’s breakeven pricing to account for differentials observed at the wellhead is necessary to accurately understand a regions breakeven price.

Additionally, according to Matt Hagerty at BTU Analytics,

These breakevens exclude acreage acquisition costs which can vary significantly between operators and even across acreage for a specific operator.

Other Considerations

As mentioned previously, it is often difficult to compare breakeven prices across companies.  Since BTU Analytics calculates each of these metrics, it would seem that they are more comparable across regions. But it is important to remember that these regional breakeven prices are averages and may not explain company or inter-regional dynamics.

If we continue to rely on breakeven pricing, then it is pertinent that we better understand what is included in these calculations.

In August of this year, breakeven prices in the Bakken fell below breakeven prices in the Permian.  While we do not doubt the credibility of this metric, it leads us to consider the actual observations that make up this average.  By mid-2016, the Bakken had only 22 operating rigs and even now has only 52 rigs as compared to 489 in the Permian.  It would be interesting to get a deeper look at the standard deviation of breakeven prices in regions such as the Bakken, as these regions may exhibit a much wider range of breakeven prices.

Even at $70 oil, investors and analysts alike are still talking about breakeven pricing, suggesting that this metric has survived the downturn.  However, if we continue to rely on the metric, then it is pertinent that we better understand what is included in these calculations.

Mercer Capital has significant experience valuing assets and companies in the energy industry. Our oil & gas valuations have been reviewed and relied on by buyers and sellers and Big 4 Auditors. These oil & gas related valuations have been utilized to support valuations for IRS Estate and Gift Tax, GAAP accounting, and litigation purposes. We have performed oil & gas valuations and associated oil & gas reserves domestically throughout the United States and in foreign countries. Contact a Mercer Capital professional today to discuss your valuation needs in confidence.

Continue Reading

Mineral Aggregator Valuation Multiples Study Released-Data as of 03-10-2026
Mineral Aggregator Valuation Multiples Study Released

With Market Data as of March 10, 2026

Mercer Capital has thoughtfully analyzed the corporate and capital structures of the publicly traded mineral aggregators to derive meaningful indications of enterprise value. We have also calculated valuation multiples based on a variety of metrics, including distributions and reserves, as well as earnings and production on both a historical and forward-looking basis.
Themes from the Q4 2025 Energy Earnings Calls
Fourth quarter 2025 earnings calls suggest an industry preparing for a transitional 2026, emphasizing organic inventory expansion, structural natural gas demand growth, and tightening service market fundamentals. Management teams appear focused less on short-term volatility and more on positioning for the next upcycle.
NAPE Summit 2026: Dealmaking at the Crossroads of Molecules, Electrons, and Minerals
Mercer Capital joined industry leaders at the 2026 NAPE Summit (NAPE Expo), held February 18th to 20th, at the George R. Brown Convention Center in Houston, Texas. As with prior Expos, NAPE delivered a focused marketplace where conversations move quickly from “nice to meet you” to “what would it take to get this done?” This year, Bryce Erickson and David Smith represented Mercer Capital on the expo floor and across the conference programming, meeting with operators, minerals groups, capital providers, and advisors.If there was one defining characteristic of NAPE 2026, it was convergence. The industry’s traditional center of gravity, upstream oil and gas dealmaking, was still very much present. But the surrounding ecosystem is widening, as programming incorporated adjacent (and increasingly intertwined) sectors. The hubs for 2026, included Offshore, Data Centers, and Critical Minerals, as part of an event lineup designed to broaden the deal flow and participant mix. Below are our key takeaways from the conference, with a tour through the hub sessions and the themes that were emphasized.The Hub Sessions Told a Clear Story: Energy Is Becoming a Multi-Asset PortfolioThe 2026 NAPE hubs provided a useful lens into where capital is flowing and how industry priorities are evolving. This year’s programming demonstrated a market that still values traditional upstream opportunities, while increasingly integrating adjacent and emerging sectors into the broader deal landscape.Prospect Preview Hub: Showcasing OpportunitiesNAPE’s Prospect Preview Hub once again served as a platform for exhibitors to showcase available prospects on the expo floor, providing concise overviews of their technical merits and commercial potential. Presenters framed their investment thesis in a narrative that reflects how assets are marketed in a competitive transaction environment.Minerals & NonOp Hub: Strategies and TrendsThe Minerals & NonOp Hub discussions focused on market trends, financing strategies, and technology-driven approaches to sourcing and managing acquisition opportunities. Presentations in this hub addressed strategies, recent trends, technologies, and related developments.Offshore Hub: Long-Cycle Capital with Global ImplicationThe Offshore Hub highlighted exploration frontiers, development innovation, and the broader geopolitical context influencing offshore investment. Particular emphasis was placed on high-potential offshore regions, navigating environmental and regulatory frameworks, supply-demand trends, and the role of offshore energy in the global energy mix. Offshore projects require significant upfront investment and longer development timelines, which heighten sensitivity to regulatory stability, cost control, and commodity price outlook assumptions. In this sense, offshore dealmaking underscores how long-cycle assets must be evaluated differently from shorter-cycle onshore plays.Renewable Energy Hub: An Integrated FrameworkThe Renewable Energy Hub reflected an industry increasingly focused on integration rather than segmentation. Presentations centered on integrating renewables with traditional energy sources, hybrid project models, sustainability pathways with a focus on technology, and strategies for navigating evolving energy markets. Rather than viewing renewables as a standalone vertical, participants frequently discussed how renewable assets fit within broader portfolios that include natural gas, storage, and transmission infrastructure.Critical Minerals Hub: Supply Chain Strategy Comes to the ForefrontThe Critical Minerals Hub emphasized the strategic importance of minerals such as lithium, cobalt, rare earth elements, and graphite within evolving energy supply chains. The three sessions - Exploration/Development, Market Dynamics, and Sustainability/Innovation - featured presentations focused on resource development pathways, supply chain positioning, sourcing practices, and recycling technologies. Unlike traditional upstream projects, critical mineral investments often face unique permitting, processing, and geopolitical risks. As capital flows into the space, differentiation increasingly depends on technical credibility and downstream integration potential.Data Center Hub: Power Demand Is Now a First-Order VariableThe Data Center Hub positioned data centers as a critical component of the global economy, emphasizing the sector’s immense and growing energy needs and the resulting opportunities for collaboration between energy and technology stakeholders. Sessions addressed (i) structuring power supply, interconnection, and grid compliance, (ii) managing data center development risk, and (iii) how rising energy demands impact data center development.In practical terms, this emerged in two ways. First, site selection and power availability are increasingly central to “deal conversations.” Co-location strategies, generation capacity, transmission access, and long-term power contracting are becoming key underwriting considerations. Second, infrastructure constraints are entering valuation frameworks. Power availability, interconnection queues, permitting timelines, and fuel optionality are no longer secondary factors; they directly influence project timing, risk, and expected returns.Our Takeaways: What We Heard Repeatedly on the FloorAcross hub sessions and meetings, three themes came up again and again:Infrastructure constraints are turning into valuation drivers. Power, pipelines, processing, and permitting are not background details—they’re often the gating items that shape cash flow timing, risk, and ultimate marketability.The market is hungry for clarity. Whether the topic is policy, commodity outlook, or capital availability, counterparties are placing a premium on deals with understandable risks and executable paths.Energy dealmaking is becoming “multi-asset” by default. Even when the transaction is traditional upstream, the conversation increasingly touches power, infrastructure, data, or minerals adjacency.Final ThoughtsMercer Capital has long valued NAPE as an event where real deal conversations happen and where shifting industry priorities can be identified early on. As the lines between upstream, infrastructure, power, and emerging energy/minerals continue to blur, independent valuation and transaction advisory services become even more important, since the hardest part isn’t building a model, it’s choosing the right assumptions.We have assisted many clients with various valuation needs in the upstream oil and gas space for both conventional and unconventional plays in North America and around the world. Contact a Mercer Capital professional to discuss your needs in confidence and learn more about how we can help you succeed.

Cart

Your cart is empty