Public Royalty Trusts (Part I)
Can Revenue Interests Benefit from Capital Appreciation?


In previous posts, we have discussed the relationship between public royalty trusts and their market pricing implications to royalty owners. Many publicly traded trusts have a fixed number of wells, so the value comes from declining distributions. Some of the trusts have wells that have not been drilled, which represent upside potential for investors. The future growth and outlook potential for each type of publicly traded trust is significantly different and a potential investor would want to know the details. The same is true for a privately held royalty interest.
In this post, we will explore the subject characteristics of MV Oil Trust. This will serve as a primer for a subsequent post in which we will look further into the composition of its stock price in order to better understand investors’ ability to achieve returns through distributions and capital appreciation.
Market Observations1
Over the previous two years, the performance of the 21 publicly traded royalty trusts has varied widely. The table below shows the performance and other key metrics of the 21 main oil and gas-focused partnerships that are publicly traded, as of July 12, 2018.
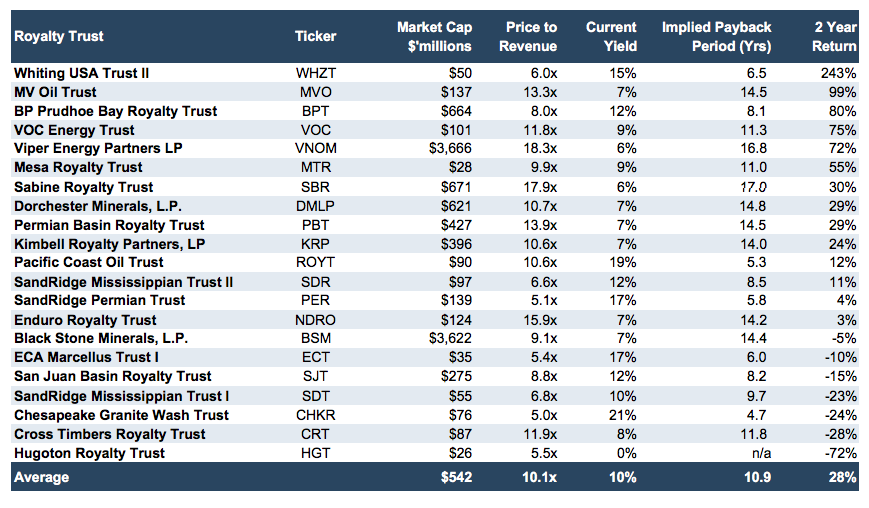
Clearly, there were some winners and losers, with more winners than losers. Of the winners, Whiting USA Trust II (WHZT) (+243%), discussed in a recent blog post, has had the highest price return. The focus of this blog post will be MV Oil Trust (MVO) (+99%), whose market value has nearly doubled in the past two years.
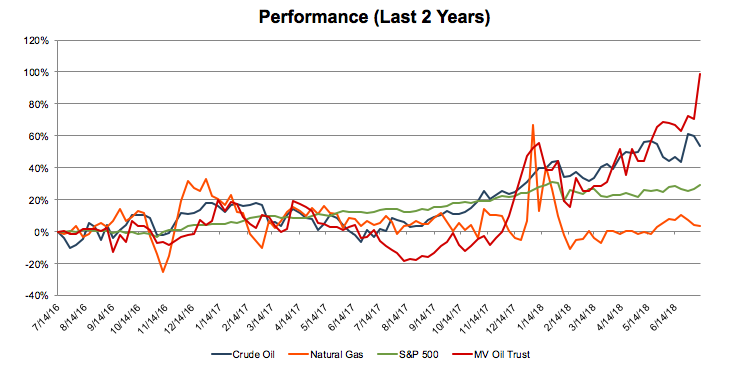
For comparison, the chart below shows the two-year returns from MV Oil Trust, Crude Oil, Natural Gas, and the S&P 500. Over the last five years, there has been significant correlation between MVO’s share price and the price of crude oil (93.3%) and less correlation with the price natural gas (74.6%).
MV Oil Trust
On January 24, 2007, MV Partners and MV Oil Trust completed an IPO. MV Oil Trust holds net profits interests, which represents the right to receive 80% of the net proceeds from all of MV Partners’ interests in oil and natural gas properties located in the Mid-Continent region in the states of Kansas and Colorado. As of December 31, 2017, the underlying properties produced predominantly oil (99% of production) from approximately 900 wells.
MV Partners is the designated operator for these properties, but they are currently being operated on a contract basis by two affiliated companies, Vess Oil Corporation and Murfin Drilling Company, Inc. MV Partners pays an overhead fee to operate the underlying properties, which is based on a monthly charge per active operated well ($3.1 million average in the past three years).
It is important to note that a majority (76% in the past two years) of the oil produced from the underlying properties was sold to a related entity, “MV Purchasing.” The price received is based on a recent NYMEX price, reduced for differentials based on location and oil quality. In 2017, the average differential between the benchmark and the price realized by MV Oil Trust was just under $5 per barrel. MV Oil Trust is extremely dependent on MV Partners and its related entities. Where this private company experiences difficulties, the trust would undoubtedly suffer, both in terms of production level and the amount it could sell.
What is a Net Profit Interest?
Trust unitholders receive 80% of the NET proceeds. “Gross proceeds” are the aggregate amount received by MV Partners from sales of crude oil, natural gas, and NGLs produced from the underlying properties. This does not include consideration for sale of any underlying properties by MV Partners, nor does it include any of the oil or gas lost in the production or marketing process. “Net proceeds” represents gross proceeds, less:
- Payments to mineral owners or landowners, such as royalties and expenses for renewals or extensions of leases;
- Any taxes paid by the owner of an underlying property;
- Costs paid by an owner of the underlying properties under any joint operating agreement;
- All exploration and drilling expenses;
- Costs or charges associated with gathering, treating and processing oil, natural gas and natural gas liquids;
- Any overhead charges, including the overhead fee payable by MV Partners to Vess Oil and Murfin Drilling; and
- Amounts reserved for approved capital expenditure projects (up to $1 million per 12 months), including well drilling, recompletion and workover costs.
Unitholders are entitled to quarterly cash distributions of substantially all of the trusts quarterly cash receipts, less the trust’s expenses and any cash the trustee decides to hold as a reserve against future expenses. As noted above, the trust’s share price is highly correlated with the price of oil because the trust is ultimately as valuable as the distributions it makes.
Termination of the Trust
Unlike a traditional royalty interest that continues into perpetuity, a net profit interest in MV Oil Trust will terminate on the later of:
- June 30, 2026, or
- The time when 14.4 MMBoe have been produced and sold (equivalent to 11.5 MMBoe in respect of the trust’s right to receive 80% of the net proceeds from the underlying properties)
As of December 31, 2017, the trust had received payment for approximately 8.0 MMBoe of the 11.5 MMBoe interest, or about 70% of the termination threshold. The trust will dissolve prior to its termination if it sells the net profit interest or if annual gross proceeds attributable to the net profits interest are less than $1 million for each of two consecutive years. Upon dissolution, the trustee would then sell all of the trust’s assets and distribute the net proceeds of the sale to the trust unitholders.
Underlying Properties
The underlying properties are in Kansas and Colorado, or the Mid-Continent region, which is a mature producing region. Most of the production consists of desirable light crude oil. Most of the producing wells are relatively shallow, ranging from 600 to 4,500 feet, and many are completed to multiple producing zones. In general, the producing wells have stable production profiles with total projected economic lives over 50 years and an estimated average annual decline rate of 8.6% over the next 20 years. This extended shelf life is attractive for unitholders of the trust because even though the trust is expected to terminate, the unharvested production capacity can still be sold.
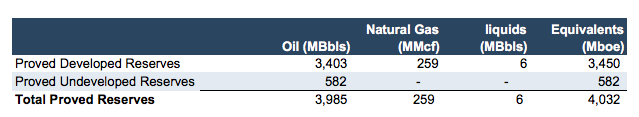
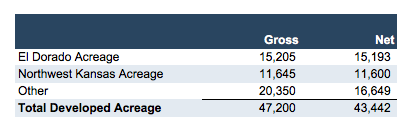
As seen in the tables below, the majority of proved reserves are developed, oil reserves. Also, the majority of acreage is in either the El Dorado or Northwest Kansas area.
The majority of the net operated wells are oil wells; however, there are also some non-operated oil wells. In the past three years, each Trust has added to its well count by drilling additional development wells. Most of these occurred in 2016 when 7.6 net wells were drilled. These additional wells increase production capacity and thus potential for future distributions.
Other Rights of Trust Unit Holders
Net proceeds received by unitholders exclude the sale of underlying properties, but this does not prevent the sale of assets. Unitholders will be compensated if a sale occurs. Further, the trust is only able to release the net profits interest associated with a lease that accounts for up to 0.25% of total production for the past 12 months without consent of unitholders. This sale also cannot exceed a fair market value of $500,000. This protects unitholders from having significant assets sold in any given year, which would decrease the level of future production.
As mentioned earlier, capital expenditures are currently limited to $1 million per 12 months. These expenditures are further limited after the “Capital Expenditure Limitation Date.” This is defined as the later of:
- June 30, 2023, or
- The time when 13.2 MMBoe have been produced and sold (equivalent to 10.6 MMBoe in respect of the trust’s right to receive 80% of the net proceeds from the underlying properties)
On this date, capital expenditures are further limited to the average of the prior three years of capital expenditures, which will likely drop it considerably below its current limit of $1 million per year.
Conclusion
In our next post, we will use MV Oil Trust as a basis for examining how investor returns are affected by a royalty trust’s distribution of proceeds, volatility in the price of crude oil, the timing of entrance and exit, and other unique features of the royalty trust such as limits on capital expenditures. We will do this by looking into what goes into the stock price of royalty trusts and the tradeoff between current and future returns.
When investing in a public royalty trust or using it as a pricing benchmark for private royalty interests, there are many items to consider that are unique to each royalty trust. The source of income, region, operator, termination, and other key aspects make each trust unique.
We have assisted many clients with various valuation and cash flow questions regarding royalty interests. Contact Mercer Capital to discuss your needs in confidence and learn more about how we can help you succeed.
1 Capital IQ