U.S. LNG Exports
Part 2: A Closer Look at Projected U.S. LNG Export Terminal Capacity


In Part 1 of our analysis on U.S. LNG Export Terminal Facilities, we examined trends in the number of LNG export facility applications and approval rates from 2010 through 2021 and examined the projected export capacity relative to the projected export volumes of U.S. LNG from 2022 through 2031. In Part 2 of our analysis, we take a closer look at the anticipated export capacity proposed to come online over the near and mid-term horizons to better understand the underlying factors that have spurred so many projects, seemingly far in excess of the projected level of LNG exports from the U.S.
Excess Export Capacity?
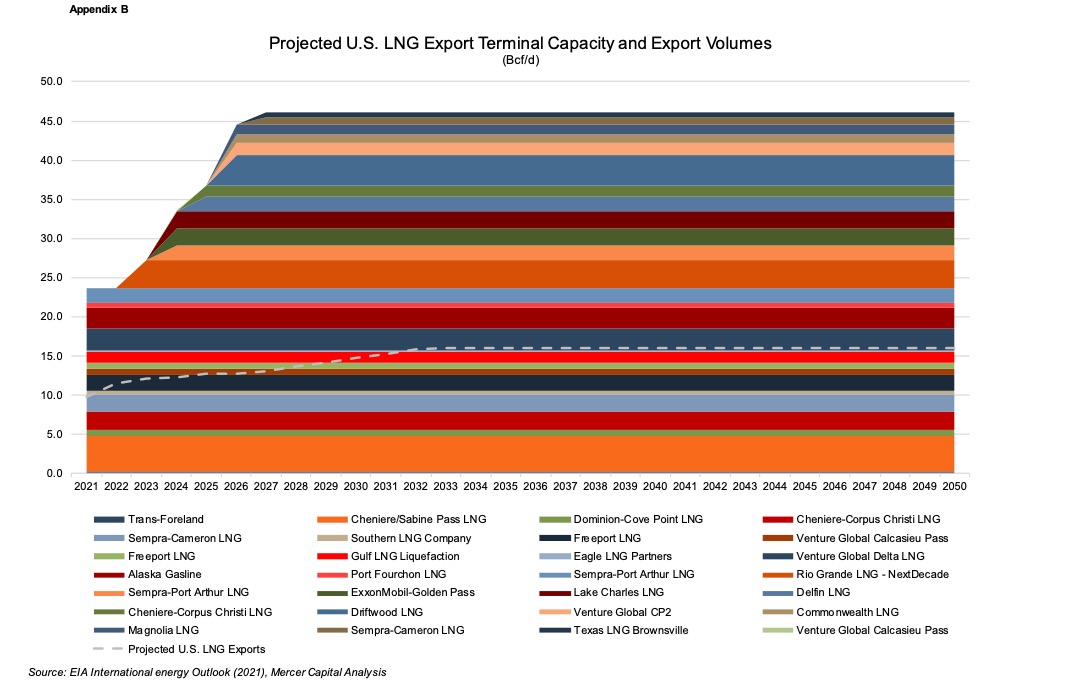
As noted in Part 1 of our analysis, the Federal Energy Regulatory Commission (“FERC”) received approximately 145 long-term applications for export facilities seeking to send liquified natural gas to countries both with and without free-trade agreements with the U.S from 2010 to 2021. Of these applications, 64% were approved, with the vast majority of approvals made from 2011 through 2016. What was particularly striking was the apparent excess capacity of all the export terminals, from both existing and proposed facilities, relative to the export levels as projected by the U.S. Energy Information Administration (“EIA”), as presented in the following chart:
What is not so apparent is that very few projects (ergo, capacity) have firm commitments from buyers to purchase the produced LNG, with even fewer projects having reached an affirmative final investment decision (“FID”). The nameplate export capacity from all proposed facilities skews the picture a bit, suggesting the U.S. is well able to ship out LNG as fast as natural gas can be extracted, without considering the financial support backing these major capital builds.
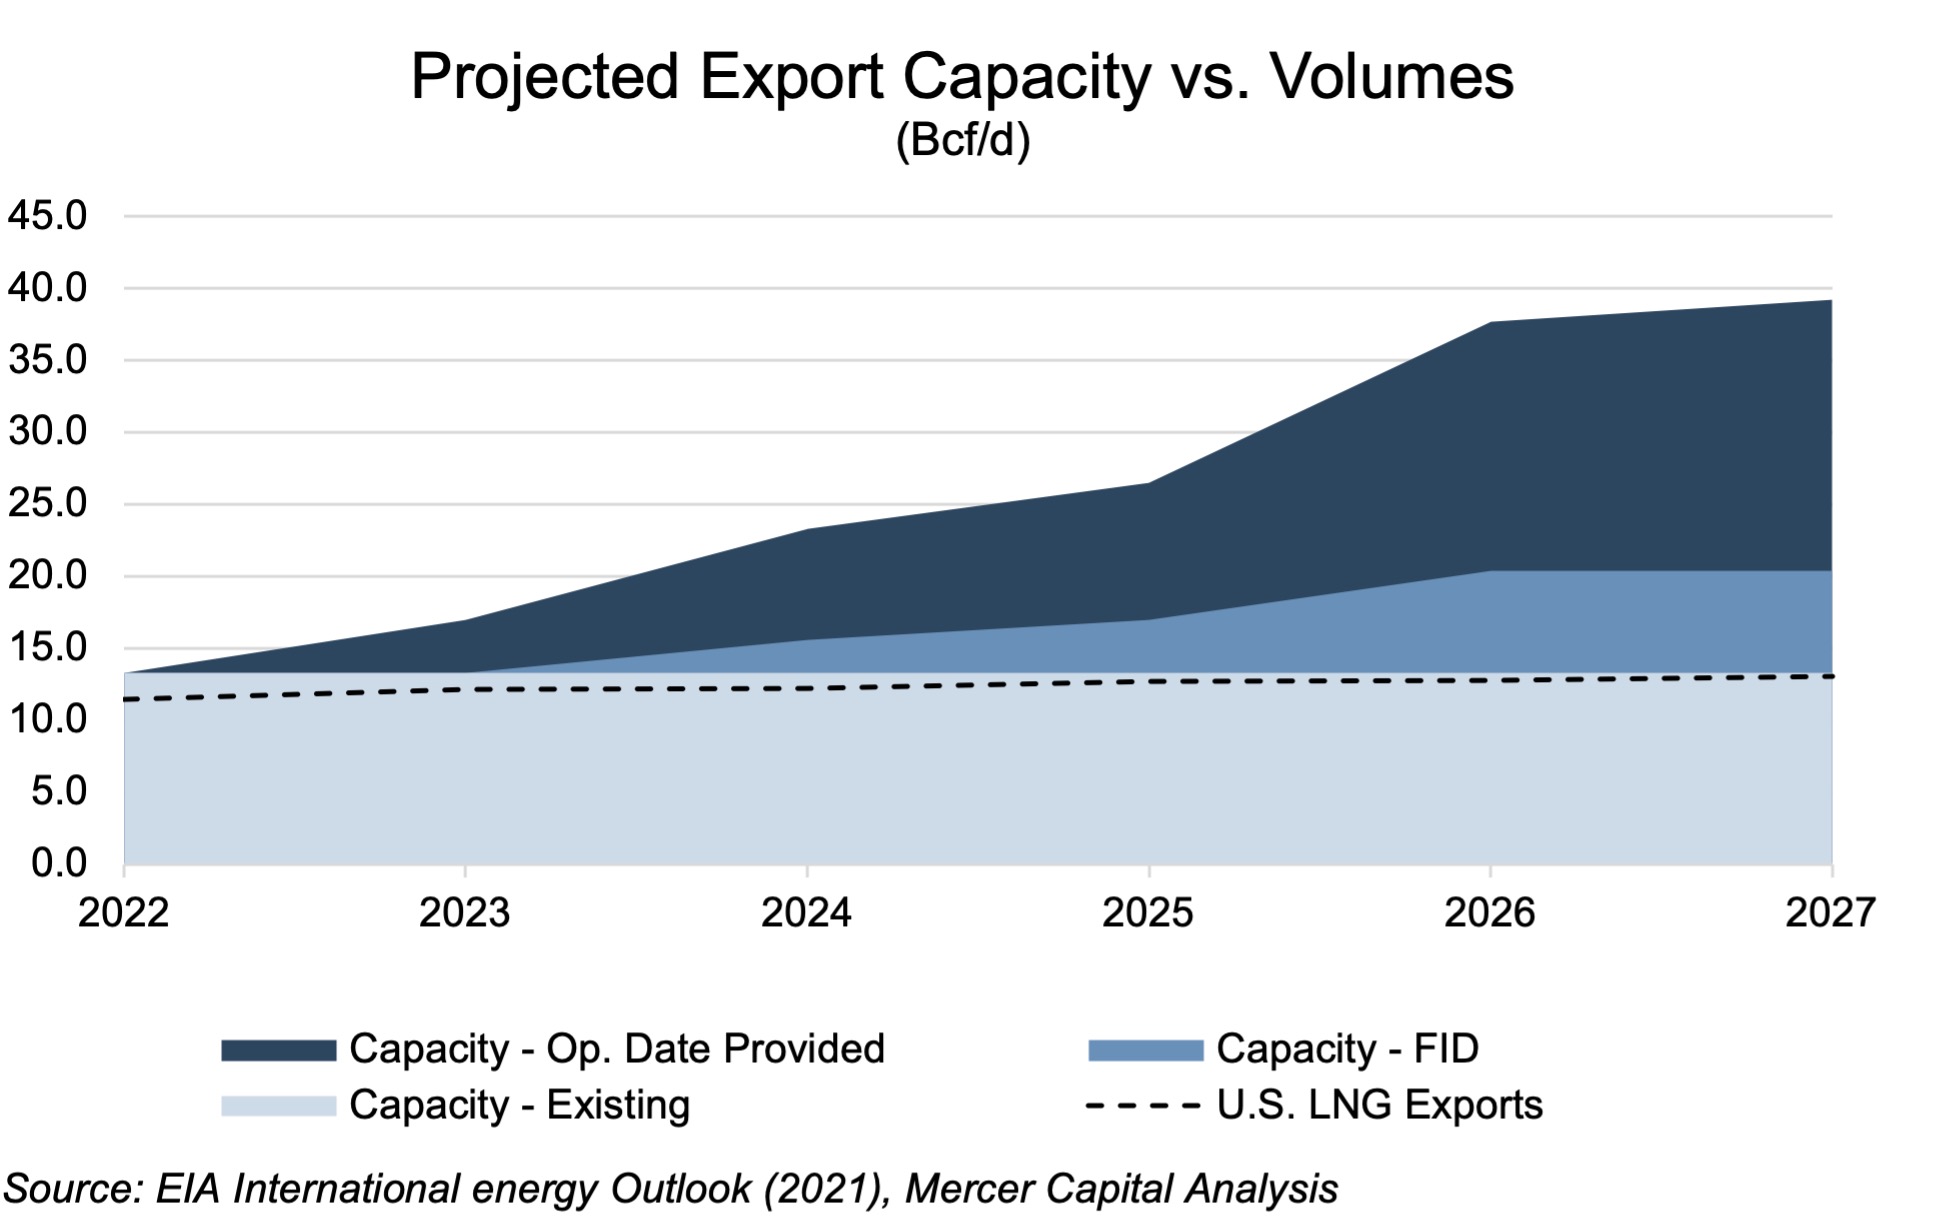
When stratifying the export capacities of all facilities for which an in-operation date has been put forth, all facilities for which an affirmative FID has been made, and all facilities which are currently in operation, it becomes clear that the capacity of the last group represents the boundary by which the projected LNG export levels anticipated by the EIA over the next 5 years are limited.
Further detail regarding the export terminal facility and capacity expansion projects are provided in Appendices A and B at the end of this post (updated and revised from Part 1 of our U.S. LNG analysis).
Furthermore, we see that a total export capacity level is slated to be “operational” over the course of 2023 through 2027, while only a portion of that capacity has affirmative FIDs underlying such progress. In other words, quite a few projects are behind schedule. Far behind. For this reason, we will consider “reasonably-expected” LNG export capacity to be based solely on existing capacity and FID-supported capacity. In order to reasonably include any capacity levels for which an in-operation (but no FID) date is provided, the supporting engineering, procurement, and construction (EPC) activities for those projects would have to be either near completion or well underway. This simply cannot be assumed to be the case given the lack of clarity regarding the expected timing of any FIDs for these projects, and considering the greatly extended lead times on equipment deliveries due to increasing costs, supply chain constraints, and tight labor markets.
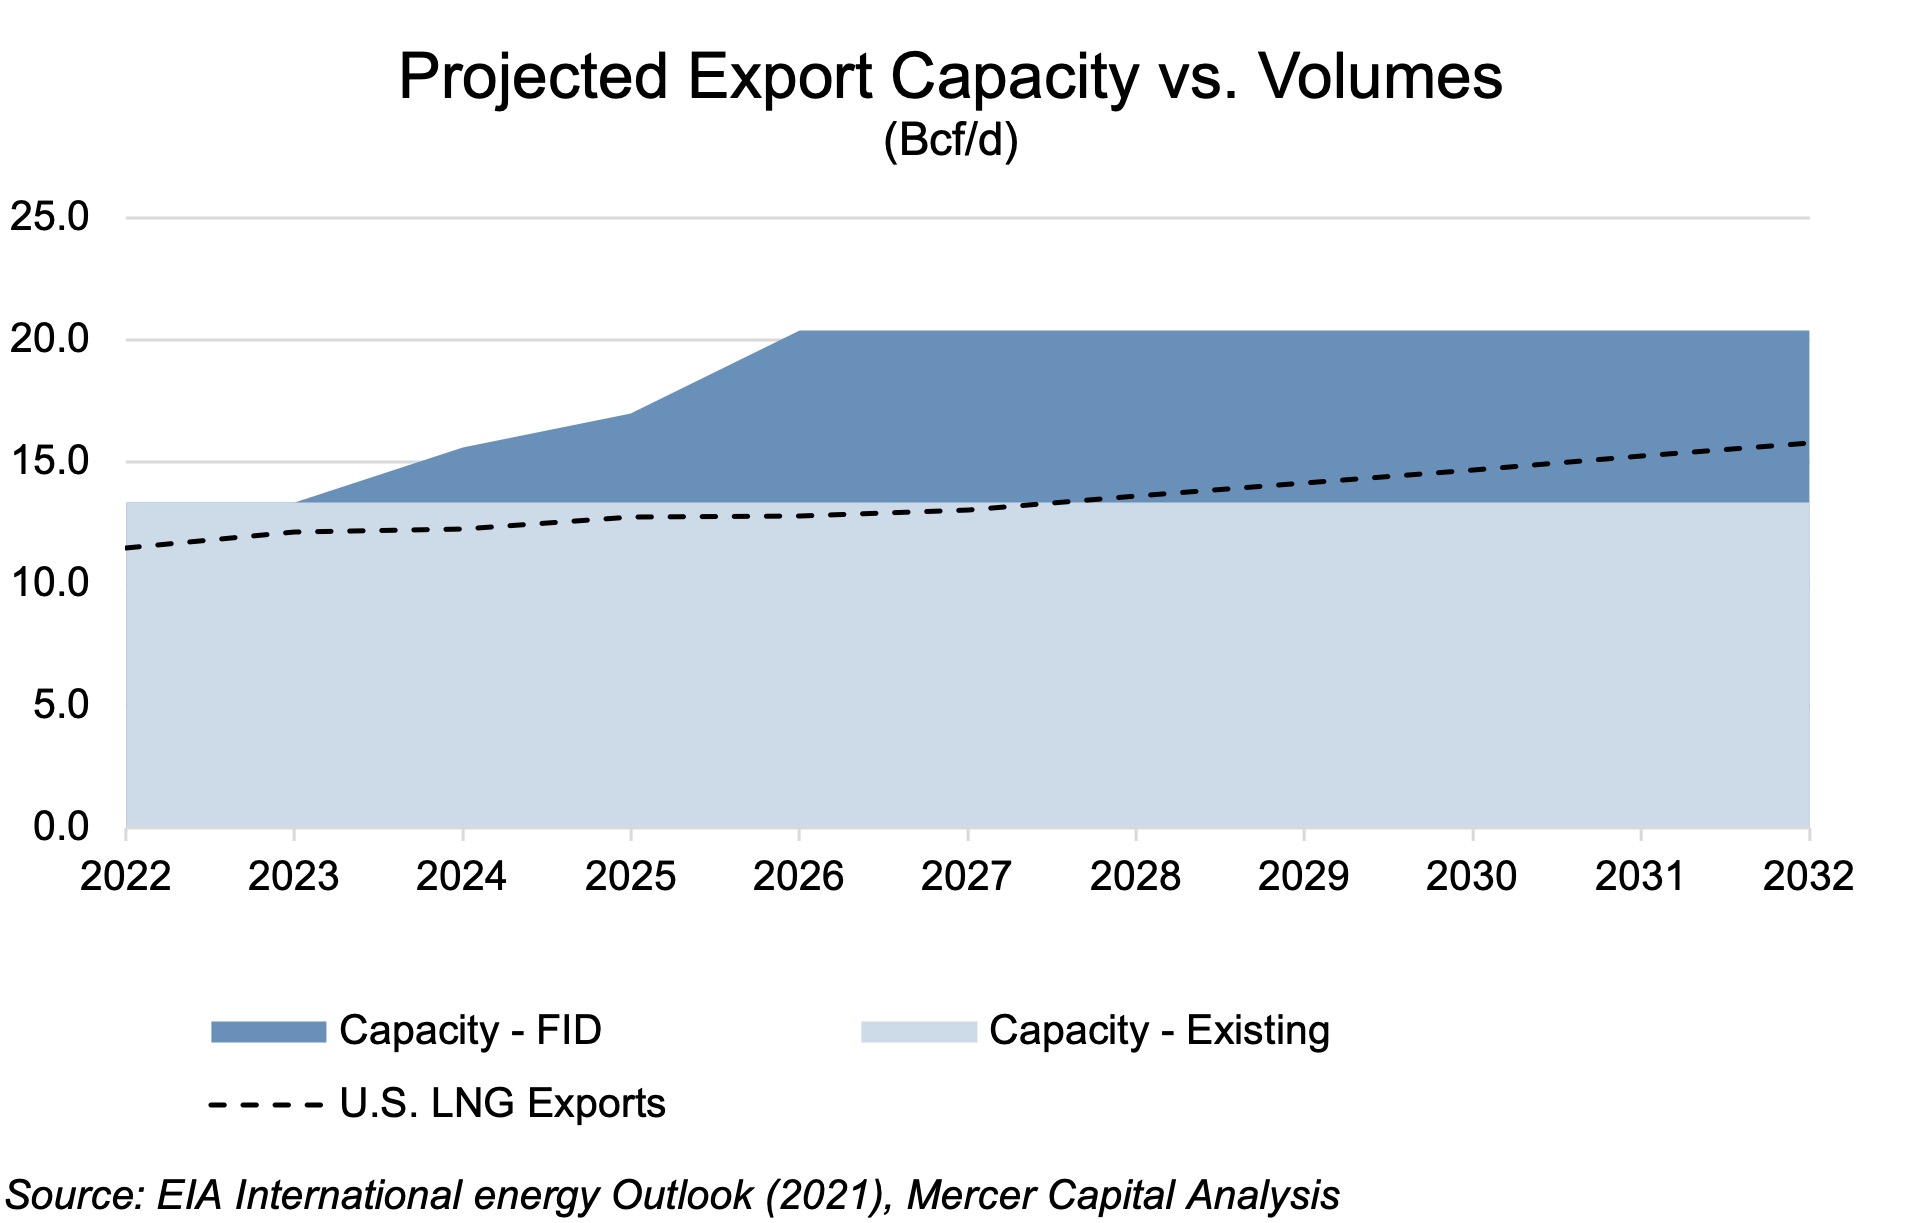
The projected capacity utilization over the next ten years is as follows:
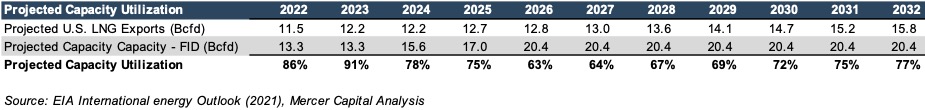
Click here to expand the image above
At face value, the projected annual utilization rates indicate potential tightness in the ability to ship out LNG volumes over the next 6-18 months. While this possible bottleneck appears – based on current projections – to ease up over the following 2 to 5-year period, other factors should be considered aside from just export terminal capacity. After all, these facilities can only send out what they receive.
Ancillary Factors
On June 8, the failure of a safety valve caused a pipeline to burst at the Freeport LNG facility, releasing approximately 120,000 cubic feet of LNG. In addition to posing a “risk to public safety, property or the environment,” U.S. natural gas futures prices fell as the spigot was shut and natural gas slated for export had to remain in storage onshore. The EIA expects that the shutdown, projected to last for at least 3- to 6-months, will reduce the total U.S. LNG export capacity by 17%. Widening our focus from the Freeport LNG shutdown, this event reveals the potential risk and impact of total U.S. LNG exports stemming from a significant unforeseen or unplanned shutdown from any of the major (>1.0 Bcfd) 4 export terminals currently in operation. Until more or larger facilities come online, any major shutdown at a currently-operational export facility may impact the ability of the U.S. to serve oversea markets.
Until more or larger facilities come online, any major shutdown at a currently-operational export facility may impact the ability of the U.S. to serve oversea markets.
Further upstream, midstream O&G operators, such as Williams (NYSE:WMB), are setting up to help supply natural gas to LNG export terminals. On June 29, Williams announced its FID to proceed with its Louisiana Energy Gateway (LEG) project, which will gather and help deliver 1.8 Bcfd of natural gas from the Haynesville Shale to Gulf Coast export terminals by way of several existing and future intermediate trunklines.
Beyond the physical capital infrastructure required to move gas volumes from the wellhead to the liquefaction terminal, support for LNG export activity remains constrained by political crosswinds as the Biden administration attempts to balance its initiative of supplying U.S. gas to Europe, in order to reduce its reliance on Russian-sourced fuel, while simultaneously addressing a greater public interest in lower domestic energy prices and progressing a platform to mitigate climate change, primarily by reducing the use of fossil fuels.
In an attempt to appeal to the various parties with a particular interest in these respective goals, the Biden administration has sent mixed signals with countervailing rhetoric and actions. Increased LNG exports to Europe directly leads to increased domestic energy prices and does little in the way of improving the current trajectory of climate change. Keeping the supply of natural gas onshore helps mitigate high domestic energy prices, but falls short of helping fuel Europe, and still does little to curb climate change. In the pursuit of meaningful change with respect to transitioning away from fossil fuels, neither LNG exports nor promoting greater levels of natural gas production are truly viable policy options. In the pursuit of all goals, no goals are likely to be achieved. It’s a stalemate. Given the factors at hand, it remains to be seen just how U.S. LNG export terminal projects develop. There are clear indications that demand is present, but nebulous political actions, words, and potential regulatory issues still cast a shadow on any perception of a clear path forward.
We have assisted many clients with various valuation needs in the upstream oil and gas space for both conventional and unconventional plays in North America and around the world. Contact a Mercer Capital professional to discuss your needs in confidence and learn more about how we can help you succeed.
Appendix A – U.S. LNG Terminals – Existing, Approved Not Yet Built, and Proposed
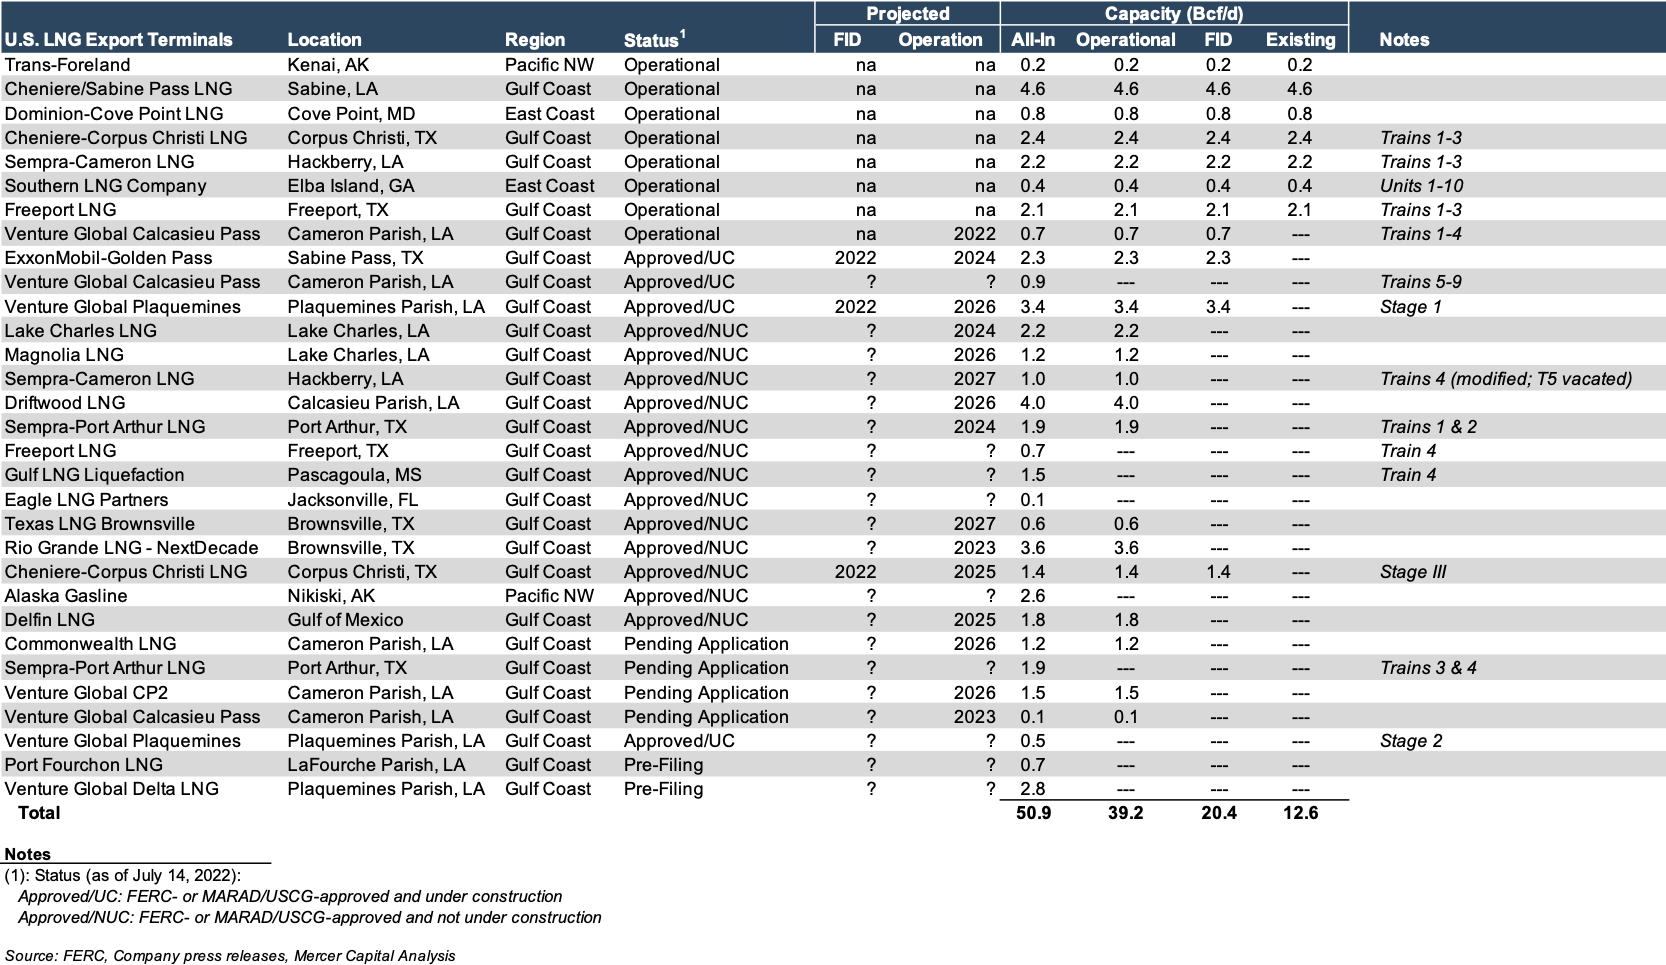
Click here to expand the image above
Appendix B – U.S. LNG Terminals – Existing, Approved Not Yet Built, and Proposed