U.S. LNG Exports
Part I: The Current State of U.S. LNG Export Terminal Facilities and Projected Export Capacity


Up To This Point…
From 2010 to 2021, the Federal Energy Regulatory Commission (“FERC”) received approximately 145 long-term applications for export facilities seeking to export liquified natural gas to countries both with and without free-trade agreements (“FTA”) with the U.S. Of these 145 applications, 93 (or 64%) have been approved, with approximately 80% of the approved applications coming from submissions made from 2011 through 2016.Up to this point, we have seen applications either submitted or reasonably anticipated to be submitted for approximately 25 export facilities.
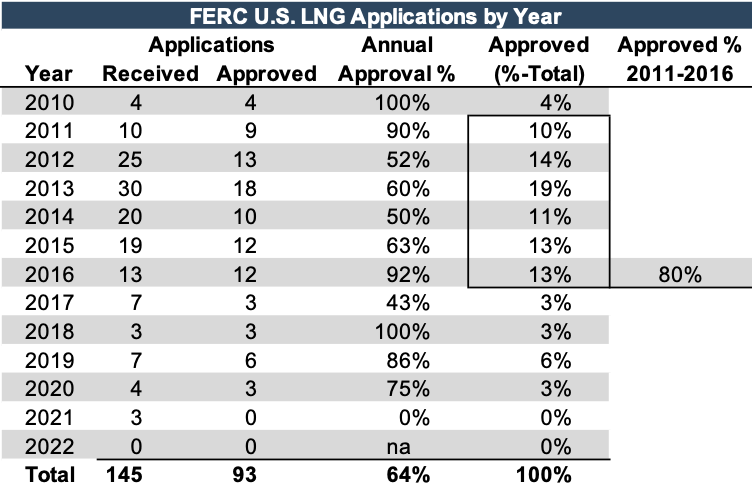
To be clear, a significant portion of these applications pertain to capacity expansions to either existing or proposed export terminals where the initial application for a proposed facility was approved, and another application for expanded output volume was later submitted prior to the actual construction of the facility. Additionally, there are separate applications for exporting to FTA and non-FTA countries; if a facility seeks to export to both types, there is one application for the FTA markets and one for the non-FTA markets. In other words, 145 applications received do not directly translate to 145 LNG export facilities.
The number of submitted applications dropped in 2017 and has since remained far below the annual numbers seen in 2011 through 2016. This was primarily caused by the massive decline in LNG export prices starting in Q1 of 2015. The subsequent decline in the applications submitted, which was not very evident until 2016, was not as steep. This was most likely due to project sponsors either hedging against sustained lowered natural gas export prices, or playing into the sunk cost fallacy of submitting an application after already having expended the time and resources necessary to prepare it in the first place.
Further expanding on the element of LNG export prices, the following chart presents the monthly prices of LNG exports from January 2005 through January 2022, with annual 2010-2016 average prices also presented over the time period.
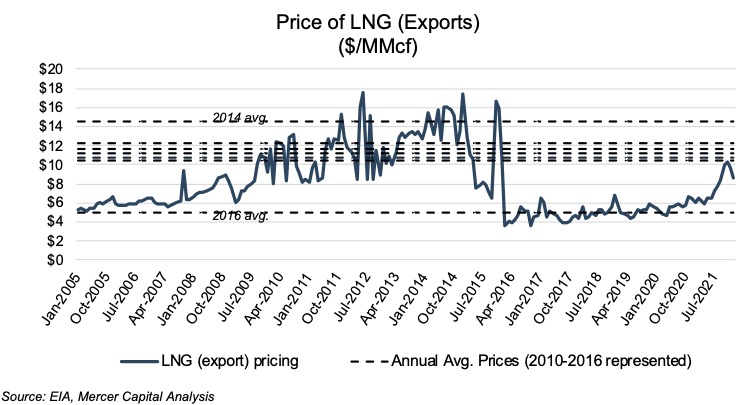
In light of the clear increase in LNG export prices during mid to late 2021, it may be slightly surprising that the number of applications in 2021 and in 2022 (so far) has not picked back up. However, a prior Energy Valuation Insights post noted that there were massive pullbacks in 2020 and 2021 capital expenditures throughout the oil and gas sector. Real growth projections for projected capital outlays in 2022 are modest as upstream operators remain focused on returning capital to shareholders, paired with maintenance level capital expenditures that will keep overall oil and gas production relatively flat or modestly higher. In addition, there are a number of outstanding final investment decisions (“FIDs”) to be made regarding the construction start for proposed facilities that have already received FERC approval. There are drilled but uncompleted (“DUC”) wells in the field – wells that are queued up to be put into action. Similarly, one may think of FERC-approved export terminal projects with outstanding FIDs as, “ready to roll”, relatively speaking, as compared to LNG export projects that still need regulatory approval.
Approved LNG export terminal projects loom over potential new projects that may or would otherwise pursue FERC approval. In essence, the U.S. LNG export terminal market is relatively saturated with projects that could be started and put into operation fairly quickly as compared to new entrants still in the pre-application or pre-approval stages of project development. The development of already-approved projects would increase the capacity to supply global demand for U.S. LNG exports. This would likely tank the underlying economics supporting any new (yet-to-be-approved and pre-FID) projects; and not by virtue of poor planning on the part of project sponsors at the micro level or weak energy prices at the macro level, but rather due to the total timing of the approval process, an affirmative FID, and the construction and commissioning phases of project development. They would be showing up to register for the race right as everyone else was already taking off from the starting line.
On that front, it’s worth taking a look at existing export capacity, total FERC-approved export capacity, and how that capacity may satisfy the demand for U.S. LNG exports.
The Current State of Affairs
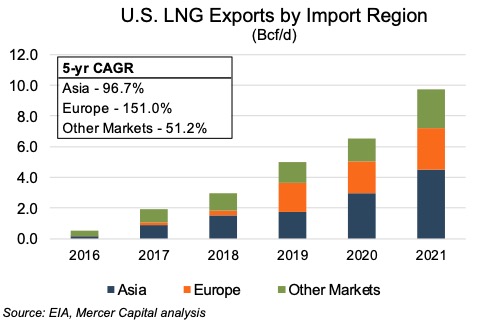
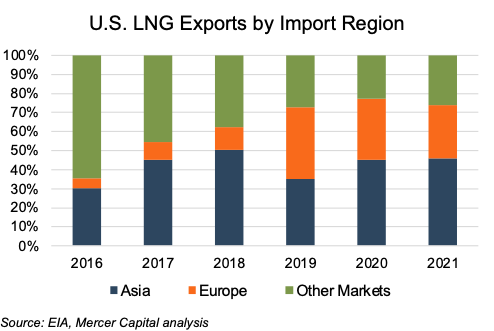
Historically, the U.S. has exported LNG to European markets, East Asian markets, and other markets, including within South America, the Caribbean, and within the past six years to parts of the Middle East, including Egypt, Israel, Jordan, and even Kuwait and the U.A.E. As presented in the following two charts, growth in export volumes to the Asian and European markets has far outpaced export volumes to the other markets.
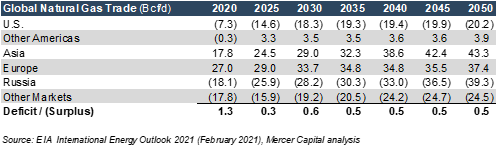
On a forward looking basis, projections of global natural trade by the EIA in its International Energy Outlook 2021 report indicate a natural gas deficit may be the norm over the next 30 years. (Negative values represent net exporters, with positive values representing net importers.)
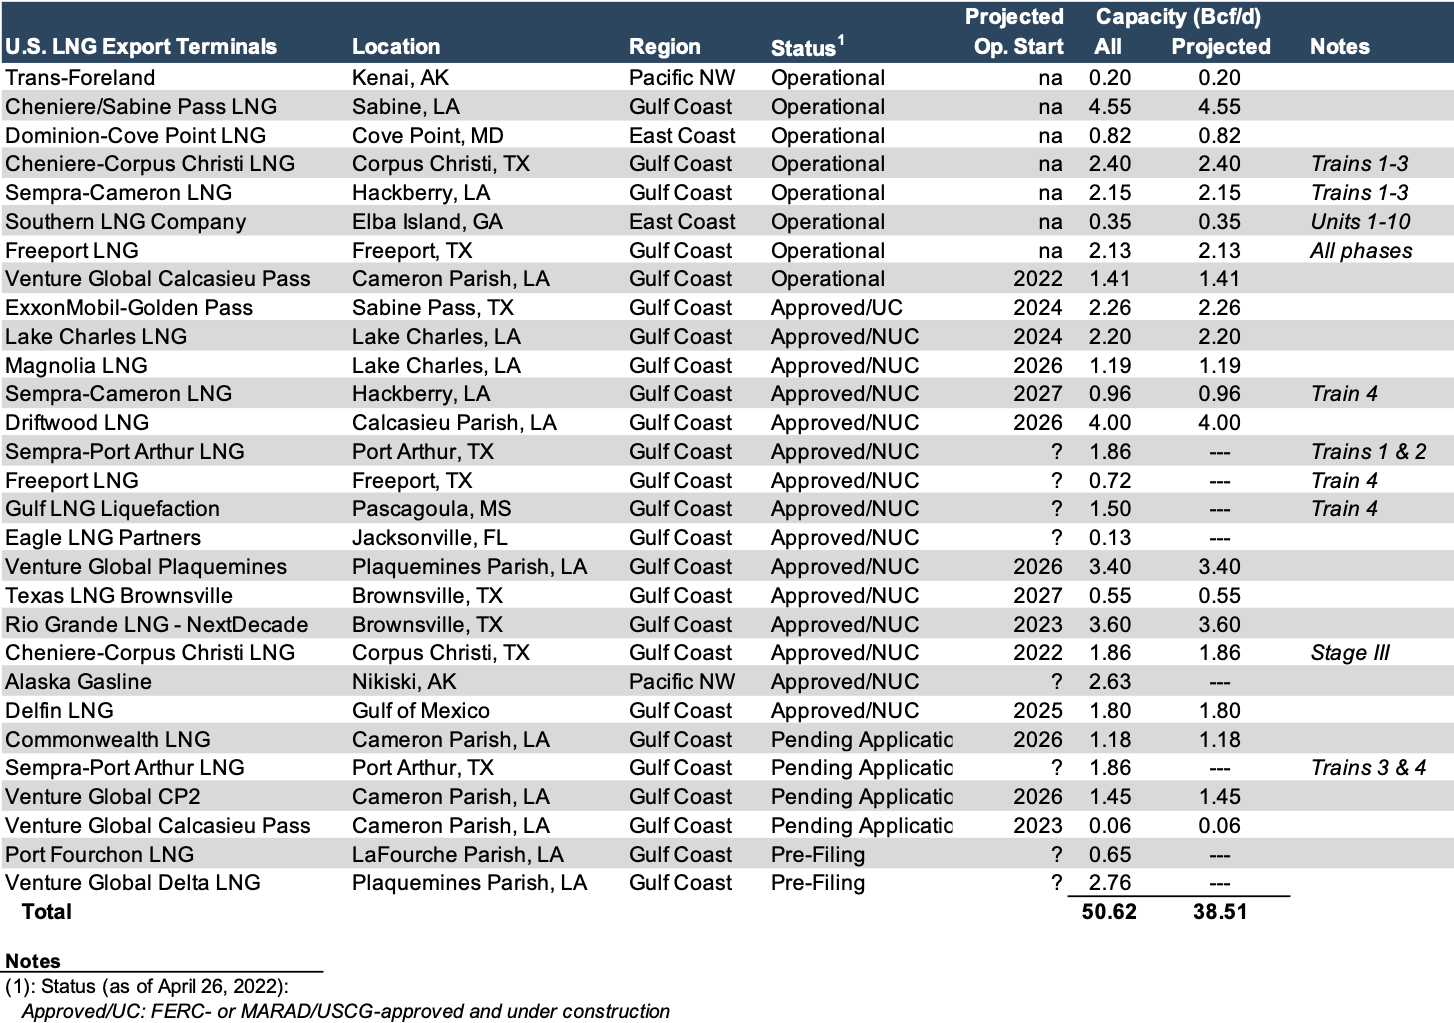
As it stands, total U.S. LNG export capacity is projected to grow approximately 13% from 14.0 Bcf/d at year-end 2021 to 15.9 Bcf/d by year-end 2022. LNG export volume at year-end 2021 was 9.8 Bcf/d (or 70% of capacity) and is projected to increase 17% to 11.5 Bcf/d by year-end 2022 (or 72% of projected export capacity). Regarding the export terminals themselves, eight were operational at year-end 2021, with one additional facility (Venture Global Calcasieu Pass) expected to be operational and delivering cargo by year-end 2022.
Beyond 2022, export volume capacity is anticipated to increase rather sharply, reaching 38.5 Bcf/d (nearly 145% from year-end 2022) in 2027, indicating a compound annual growth rate of approximately 19% in export volume capacity over the prospective five-year period. These projected volumes only consider the 18 export facilities for which the project sponsors have provided an anticipated date of the projects’ operational status; they do not consider the incremental volumes stemming from a new terminals or capacity expansion projects for which it is unclear as to when the additional export capacity might come online. Clearly, the export capacity of U.S. LNG is primed to take off. But take off to where?
As we saw in the chart above concerning global natural gas trade projections, with the U.S. presented clearly as a net exporter of natural gas, export volumes are anticipated to rise quickly to just over 18 Bcf/d by 2030, then slowly tick up annually, topping out at around 20 Bcf/d in 2045-2050.
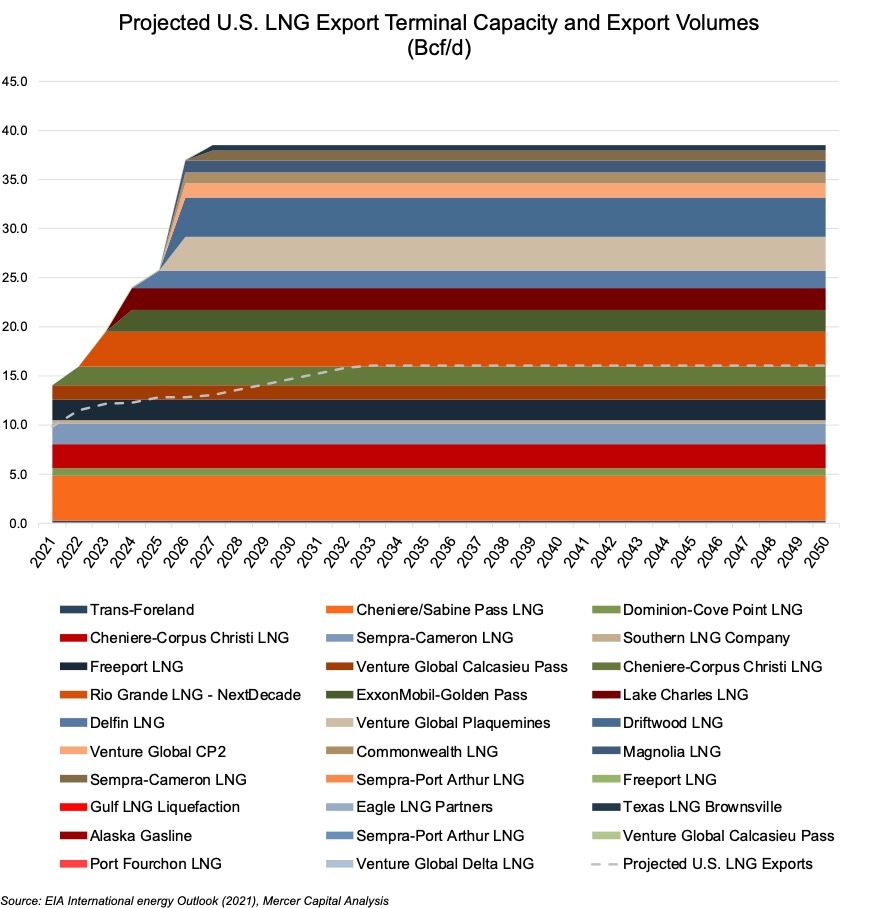
To put this in better context, the following chart summarizes the projected export capacity by region and year of anticipated operational status, as well as the projected annual LNG export volumes through 2031.
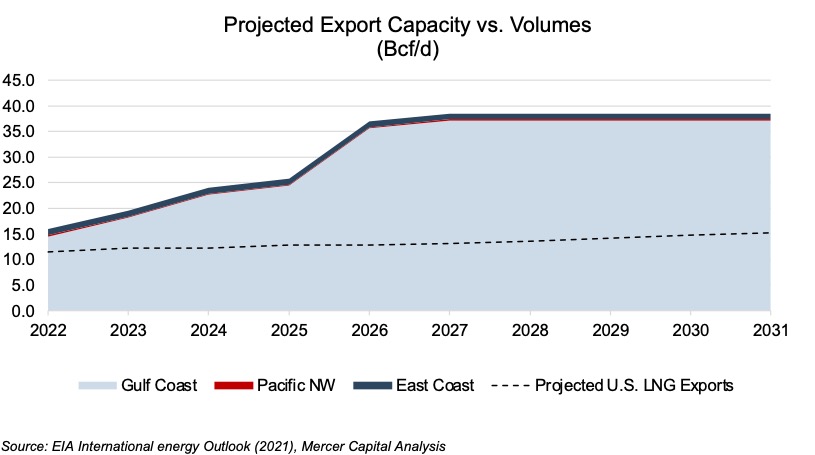
Further detail regarding the export terminal facility and capacity expansion projects are provided in Appendices A and B.
Based on the eye-ball test, it’s pretty clear that projected export capacity could far outstrip demand for U.S. LNG, based on the EIA’s export projections (as of early 2021), only if all that capacity were to come online. Free Market Economics 101 theory would indicate, rather decisively, that such excessive capacity would clearly not be worth building out given the export volumes projected as of early 2021. Then, on February 24, 2022, Russia – the largest supplier of LNG to Europe – invaded Ukraine.
In Part 2 of our analysis on U.S. LNG Exports, we will take a closer look at the destination markets of U.S. LNG export cargoes, with a particular focus on Europe and its move away from Russian natural gas, and the commitment by the U.S. to help mitigate that transition while balancing its policies and goals aimed at addressing climate change.
We have assisted many clients with various valuation needs in the upstream oil and gas space for both conventional and unconventional plays in North America, and around the world. Contact a Mercer Capital professional to discuss your needs in confidence and learn more about how we can help you succeed.
Appendix A – U.S. LNG Terminals – Existing, Approved Not Yet Built, and Proposed
Click here to expand the chart above
Appendix B – U.S. LNG Terminals – Existing, Approved Not Yet Built, and Proposed
Click Here to Read Part 2 of This Series
In part 2 we take a closer look at the destination markets of U.S. LNG export cargoes, with a particular focus on Europe and its move away from Russian natural gas, and the commitment by the U.S. to help mitigate that transition while balancing its policies and goals aimed at addressing climate change.