Making Sense of 2020: Part 3
Benchmarking Cash Flow From Financing Activities


In previous posts, we analyzed the operating performance and investing decisions of the companies in our benchmarking universe. This week, we examine the financing decisions of those companies and apply those observations to family businesses.
Big Picture Findings
The difference between operating cash flow and investing cash flow creates a “gap” that is filled by financing activities.
- When operating cash flows exceed investing outflows, cash is available to distribute to capital providers, whether in the form of repaying debt, repurchasing shares, or paying dividends.
- When investing outflows exceed operating cash flows, a business must finance the resulting shortfall by borrowing from lenders or selling new shares to investors.
A company’s cash balance serves as the release valve when financing cash flows do not perfectly align with the “gap” between operating and investing cash flows.
Table 14 summarizes the aggregate sources and uses of cash for the small cap companies in the Russell 2000 during the three years ending with 2020.
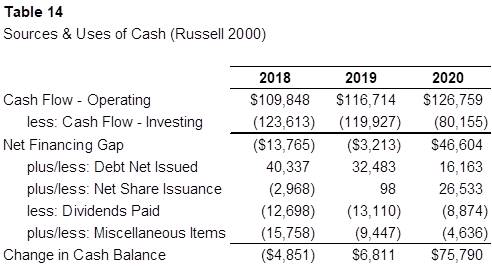
In “normal” years (i.e., 2018 and 2019), the small caps typically invest a bit more than cash flow from operations, leaving a net hole to be filled by financing activities. Of course, 2020 was far from “normal.” As we have described in the previous two posts in this series, operating cash flow increased during the year despite weak earnings because of non-cash impairment charges and reduced working capital balances. Meanwhile, companies were cautious on the investment front, curtailing both capital expenditures and M&A activity. The net result is that during 2020, operating cash flows exceeded investing cash flows by approximately $46.6 billion.
So what did the companies in our universe do with this cash windfall?
- Net debt issuance. Although it was not necessary to fill a financing gap, the companies in our dataset continued to borrow money in 2020, albeit at a slower pace than prior years. Rather than repaying debt, small cap public companies elected to borrow more funds during 2020.
- Net share issuance. During 2018 and 2019, the small caps were hesitant to issue net new shares. However, in 2020 share repurchase volume fell over 20% (from $22 billion to $17 billion) while share issuance volume doubled from $22 billion to $44 billion. The net result is that – as with debt – the companies in our dataset elected to raise new equity despite
not “needing” it. - Dividends paid. The companies in our sample also took a conservative posture regarding dividends paid. In the aggregate, dividend payments fell by nearly one-third, from $13 billion to $9 billion.
Aggregate financing inflows supplemented the positive financing gap to boost cash balances for the small caps by nearly $76 billion, compared to a net change of about $2 billion in 2018 and 2019.
Digging a Bit Deeper
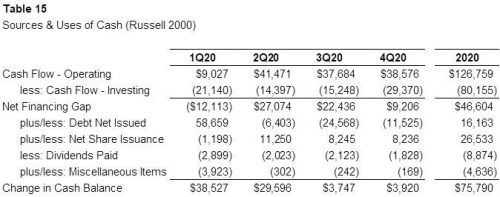
Table 15 summarizes the same sources and uses of cash data, but on a quarterly basis during 2020.
Net Debt Issued
As the reality of the pandemic began to dawn on corporate managers in March 2020, the first action item for many companies was drawing down credit facilities to boost cash reserves to help weather a storm of unknown length.
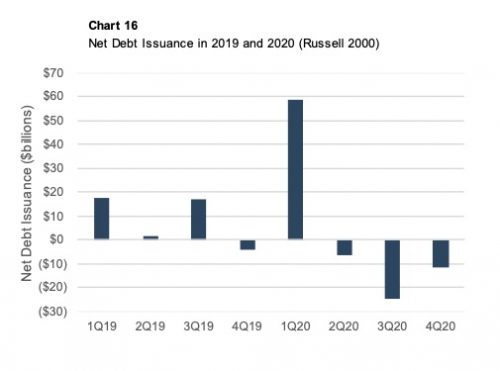
After loading up on proceeds from borrowings, the companies in our dataset returned some of the funds to lenders in the second half of the year as the economic impact of the pandemic became a bit more transparent.
Net Share Issuance
After tapping the debt markets in the first quarter, companies turned their attention to the equity markets to secure pandemic funding over the balance of the year, as shown in Chart 17.
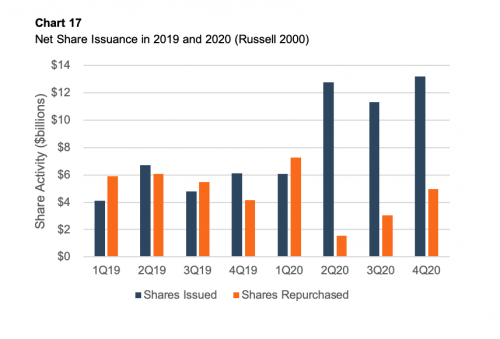 In the second quarter, share repurchases slowed to a trickle while proceeds from share issuance more than doubled from Q1 levels. Share issuance proceeds remained at elevated levels through the remainder of the year although repurchase volumes did approach more normal levels as corporate managers became more optimistic about the prospects for the economy.
Dividends Paid
Chart 18 compares aggregate per share dividends paid in the fourth quarter of 2020 to the fourth quarter of 2019.
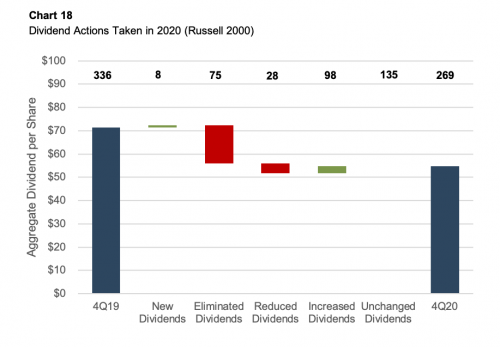 During 4Q19, 336 small cap companies paid common dividends (approximately 30% of the total dataset). During 4Q20, 103 of those companies (31%) either suspended dividends entirely or reduced the amount paid. While 98 of the companies increased dividend payments, the typical increase was modest. The remaining 135 dividend payors made no changes to the amount of per share dividends between the two periods. On a net basis, the number of small cap companies paying common dividends shrank by approximately 20% from 4Q19 to 4Q20.
Change in Cash Balances
As shown in Chart 19, the small cap companies stopped hoarding cash in the third and fourth quarters of 2020.
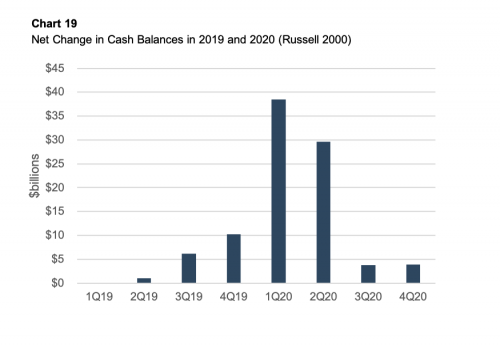 In total, the small cap companies in our sample added almost $76 billion to their cash offers during 2020. As the economy recovers from the pandemic, we will monitor how management teams elect to put their cash stockpiles to work.
Questions for Family Business Directors
Our analysis of the financing decisions of public small cap companies during 2020 highlights some important questions for family business directors to deliberate during 2021.
- How did your lenders treat you during the pandemic? Were your existing credit facilities flexible enough to meet your needs, or should your family business be shopping for new lender relationships? It continues to be a borrowers’ market, and now may be the time to lock in favorable rates.
- What does your family think about issuing equity to non-family investors? For many decades, this was an automatic “no” for most families, but we expect the increasing availability of capital from family offices and other potentially “friendly” equity investors to be one of the biggest trends in family business over the next decade.
- Have your family shareholders accumulated liquid wealth outside of their holdings in family business stock? Having a nest egg outside the family business can reduce the overall risk of the family even if it means using a prudent amount of leverage inside the family business. When bad things happen (and COVID isn’t the last bad thing we will see), family shareholders with more diversified personal balance sheets tend to sleep a bit better.
- Do you have plans to deploy any excess cash balances that may have built up on the family businesses balance sheet? While rushing into ill-conceived investments is not a good idea, harboring lazy capital can weigh on long-term family returns.
It is important for family businesses to make financing decisions with strategic intent rather than out of convenience. Did the financing decisions your family business made in 2020 promote the long-term sustainability of the family business, or were they short-term decisions reflecting emergency conditions? Use the more favorable business conditions of 2021 as an opportunity to make sure your financing decisions “fit” your family business.