Basics of Financial Statement Analysis
Part 4: Telling the Company’s Story


This post is the fourth and final installment from our Basics of Financial Statement Analysis whitepaper. In this series of posts, our goal is to help readers develop an understanding of the basic contours of the three principal financial statements. The balance sheet, income statement, and statement of cash flows are each indispensable components of the “story” that the financial statements tell about a company.
Telling the Company’s Story
Having reviewed the primary financial statements individually, we review in this section how the statements relate to one another. A comprehensive view of how items on one financial statement relate to items on another financial statement is necessary to discern the underlying story or narrative of the company.
Exhibit 1 below summarizes the principal components of the three financial statements. We address the most important relationships in the following numbered sections corresponding to Exhibit 1.
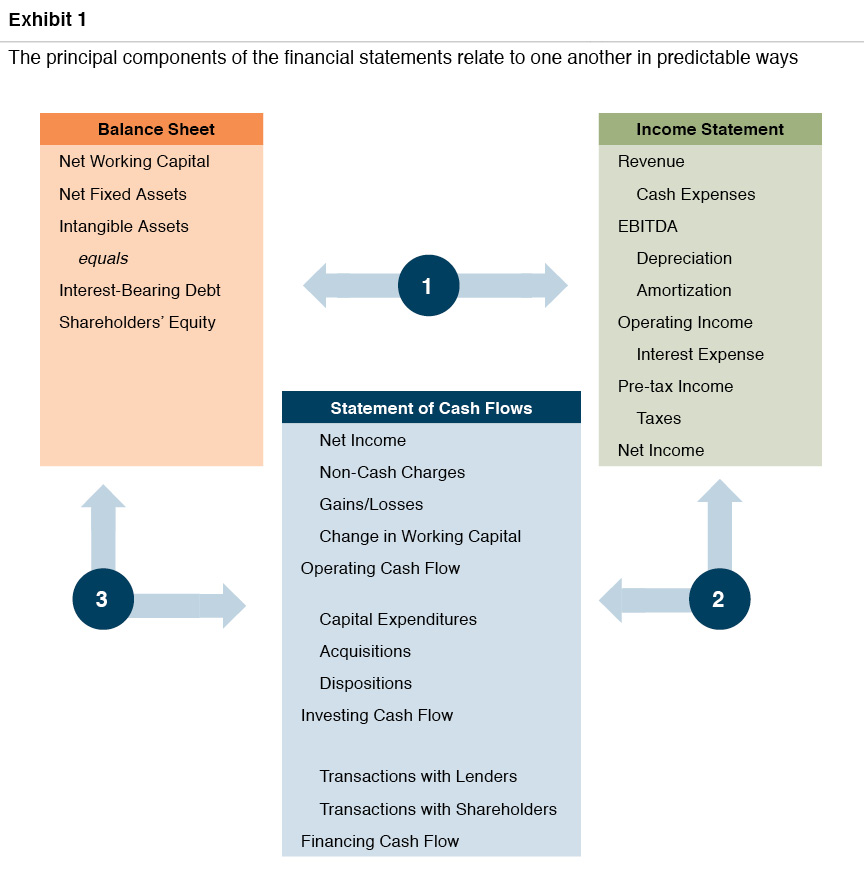
#1: Balance Sheet and Income Statement
The balance sheet and income statement link up with each other at a few key points that are important for analysis.
- Total assets and revenue. Assets are valuable to the extent that they generate (profitable) revenue. Measuring the efficiency with which the company’s assets generate revenue can be a helpful way to evaluate the success of a company’s strategy over time and to compare its performance to that of peer firms. Decreasing asset efficiency may be a sign that the company is accumulating excess, or non-productive, assets when distributing a greater proportion of earnings would be more optimal.
- Revenue and accounts receivable. For companies that sell on credit, correlating the balance of accounts receivable to revenue over time can reveal changes in normal credit terms, and/or provide a proxy for the financial health of the company’s customers. As the average time receivables are outstanding increases, collectability becomes more difficult, and the wedge between reported earnings and operating cash flow widens.
- Cost of goods sold and inventory. The relationship between cost of goods sold and inventory is akin to that between revenue and accounts receivable. If inventory balances are growing disproportionately to cost of goods sold, there may be concerns regarding production inefficiencies, market demand for the company’s products, and an increasing likelihood of inventory obsolescence.
- Depreciation and net fixed assets. As noted previously, the amount of depreciation expense incurred on the income statement is determined by the net fixed assets on the balance sheet.
- Amortization and intangible assets. As with depreciation, amortization charges are a function of intangible assets recognized on the balance sheet. The presence of intangible assets and the resulting amortization expenses indicate that the company has grown – in part, at least – through acquisition rather than organically.
- Interest expense and debt. The interest expense reported on the balance sheet is a function of the average amount of debt outstanding during the period and the effective interest rate on the debt. Interest expense on the income statement will prompt an experienced financial statement reader to consult the notes to learn about the relevant terms of the debt.
#2: Income Statement and Statement of Cash Flows
In addition to reconciling reported earnings to operating cash flow, the statement of cash flows can provide leading indicators for the income statement.
- Net income and operating cash flow. Two of the three primary components of the reconciliation of net income and operating cash flow are found on the income statement. While non-cash charges to earnings do not consume cash in the current period, they do correspond to cash outflows in prior (depreciation and amortization) or future (equity-based compensation) periods.
- Capital expenditures and depreciation expense. Acknowledging that capital expenditures can be lumpy, the relationship between capital expenditures and depreciation expense is worth examining. Capital expenditures in excess of depreciation should correspond to revenue and profit growth. If capital expenditures consistently lag depreciation, that may be a signal that some expenditures have been deferred and will need to be made in the future to maintain productive capacity.
- Acquisitions and operating income. Acquisitions on the statement of cash flows should be a leading indicator of operating income growth. A history of acquisitions without corresponding increases in operating income may suggest that the company’s capital budgeting process is not functioning well.
- Transactions with lenders and interest expense. If the company is a net borrower, interest expense will be expected to grow in future periods. If so, is operating income sufficient to sustain a higher degree of financial leverage? If the company is repaying debt, interest expense will decrease, although potentially at the cost of slowing earnings growth on a per share basis.
- Transactions with shareholders and earnings per share. One motivation for companies to repurchase shares is to stimulate growth in earnings per share. If attractive investment opportunities are scarce, repurchasing shares at an appropriate valuation may be an effective tool to augment growth in earnings per share.
#3: Balance Sheet and Statement of Cash Flows
The statement of cash flows analyzes cash flows by tracing changes in balance sheet accounts.
- Working capital and operating cash flow. Changes in accounts receivable, inventory, and accounts payable are key elements of reconciling reported net income to operating cash flow. While often not accompanied by the same degree of intentional deliberation, investment in working capital is no different than investment in fixed assets or business combinations.
- Capital expenditures and net fixed assets. To the extent capital expenditures exceed depreciation charges, the balance of net fixed assets will increase. If the incremental assets are not productive, investment returns will suffer.
- Acquisitions and intangible assets. Devoting capital resources to acquisition activity will increase the balance of intangible assets. The degree to which an acquisition is accretive to returns depends, in large part, on the negotiated pricing of the deal.
- Transactions with lenders and interest-bearing debt. Net borrowing or repayment of debt will reconcile to changes in the balance of interest-bearing debt. As noted previously, financial leverage increases both potential returns and risk. Changes in debt should be evaluated relative to the overall market value-weighted capital structure of the company.
- Transactions with shareholders and shareholders’ equity. The decision to issue new shares or return cash to shareholders through dividends and share repurchases should be evaluated with regard to the availability of attractive investment opportunities and the marginal costs of debt and equity capital.
DuPont Analysis – Dissecting the Plot
The classic example of cross-financial statement analysis is DuPont analysis. As illustrated in Exhibit 2, this technique breaks return on equity into its component parts using elements from the balance sheet and income statement. DuPont analysis is a simple tool for helping to uncover the narrative underlying the company’s operating performance.
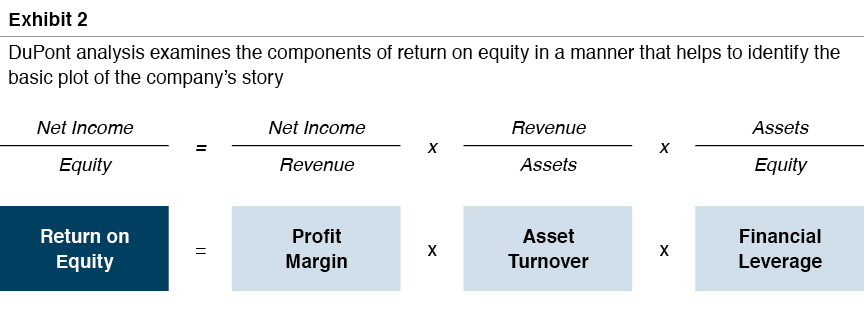
Return on equity is a measure of the efficiency with which the shareholders’ investment in the business generates net income. All else equal, shareholders prefer more net income per dollar of investment. Using DuPont analysis, this aggregate measure of financial performance is disaggregated into three components, each of which can be correlated to the company’s overall strategy and compared to other firms.
- Profit margin. Profit margin measures the profitability of the company per dollar of revenue. Profit margin reflects the relative competitive strengths of the company and the degree to which barriers to entry exist to limit competition.
- Asset turnover. Asset turnover measures the efficiency with which the company employs its assets to generate revenue. Asset turnover can reflect strategic decisions such as whether to lease or purchase facilities. Non-operating or excess assets reduce asset turnover.
- Financial leverage. Financial leverage measures the degree to which the company uses OPM (“other peoples’ money”) to fund operations. Financial leverage can have a multiplicative effect on return on equity, although it also increases risk.
DuPont analysis can be used both to evaluate the company’s performance over time and to compare the company’s performance to peers. The underlying conceptual framework can also be helpful in evaluating the effect of potential changes to the company’s strategy.
Assessing Projected Financial Statements
Understanding historical financial performance is important, but the ultimate objective of financial statement analysis is to develop expectations regarding the amount and timing of future cash flows. In this section, we review the key elements of a financial forecast.
- Revenue growth. Revenue is the starting point for nearly any financial projection model. For most companies, a revenue forecast will be more credible if the analyst can distinguish between unit volume growth and anticipated changes in pricing. Unit volume growth can then be compared to expectations for the broader industry, and pricing assumptions can be evaluated for reasonableness in light of inflation expectations and the competitive dynamics in the industry.
- Gross margin. Gross margin projections should be supportable with reference to key commodity inputs and other elements of the production process (direct labor, fixed overhead). Deviations from historical performance or available peer data should be reconciled to differences in strategy or projected market conditions.
- Profitability. Forecasts of profitability are best evaluated by calculating the implied margins. EBITDA is often an appropriate measure of profitability for forecasting, since a discrete depreciation and amortization forecast can be calculated separately. Comparison of fixed and variable costs can add texture and credibility to the forecast, particularly if margins are projected to change. The concept of reversion to the mean is important to keep in mind when reviewing projected profitability; competitive and market forces can have a corrosive effect on above-peer margins over time.
- Capital expenditures. The forecast of capital expenditures should be evaluated relative to the projected revenue stream and existing capacity utilization. Since capital expenditures are often lumpy, the year-to-year relationship to depreciation will not necessarily be predictable. However, over the long-run the two amounts should be comparable in the aggregate.
- Working capital. Working capital can be the “silent killer” of cash flow forecasts. The reasonableness of projected working capital balances can be assessed either in the aggregate (generally as a percentage of revenue) or at the level of the individual components. In either case, working capital assumptions should be compared to historical trends for the company, peer averages, and anticipated strategy shifts.
- Interest-bearing debt. When projecting cash flow to shareholders, anticipated borrowings are cash inflows, while the repayment of debt is a cash outflow. Interest expense should be forecast with reference to average projected debt balances and assumed interest rates. For companies that rely on floating rate debt, it may be appropriate to examine forward LIBOR curves to estimate future interest expenses.
The critical touchstones for evaluating projected financial performance are the historical results of the company itself and relevant peer data, when available. For the forecast as a whole (and each of the primary components), the projected inputs and results should be consistent with the company’s overall story, as revealed in the analysis of the historical financial statements.
The Notes to the Financial Statements
Audited financial statements contain detailed notes. Reading and understanding these notes is an integral part of reading the financial statements. The notes relate valuable information that cannot be presented on the face of the actual financial statements. While the content of the notes will vary, general categories of interest will generally include the following:
- Accounting policies. Management often chooses between multiple potential accounting treatments for a given transaction. Understanding when revenue is recognized, what depreciation pattern/life is used, and how inventory is accounted for is important when comparing financial statements for different companies.
- Asset detail. The composition of inventory (raw materials, work in process, and finished goods), net fixed assets (land, buildings, rolling stock, leasehold improvements), and intangible assets (customer relationships, tradenames, goodwill) helps to reveal the company’s strategy.
- Debt terms. For companies with financial leverage, the notes to the financial statements will provide important information regarding the rates and maturities of the company’s outstanding debt, all of which are critical to assessing the company’s financial flexibility.
- Remaining lease payments. Although multi-year lease agreements do not currently appear on the balance sheet as financial obligations, such agreements are in many ways similar to debt in that they represent fixed obligations that are payable regardless of the future operating results of the business. The notes to the financial statements detail the annual lease payments the company is obligated to make in coming years.
- Pension and benefit liabilities. The accounting for defined benefit pensions and other post-retirement benefits is complex. The notes to the financial statements summarize the most important assumptions management has made regarding the amount of benefits to be paid and the expected return on plan assets.
- Acquisitions. The notes to the financial statements generally include discussion of significant business combinations, including pricing, allocation of purchase price to assets acquired, and occasionally, pro forma financial results for the acquired business.
- Equity-based compensation. Many companies use equity-based compensation plans to incentivize management. While the accounting treatment of such plans can be somewhat arcane, the notes to the financial statements include informative schedules that help to quantify the potential dilution from such plans.
- Material subsequent events. There is a lag between the issuance date and the as-of date for the financial statements. If a significant corporate event (acquisition, divestiture, refinancing, lawsuit, etc.) has occurred during that interim period, it will be disclosed in the notes to the financial statements.
Astute readers of financial statements know how essential the notes are. There is no shortcut to a careful reading of the notes.
Conclusion
Reading financial statements is an essential part of evaluating the performance of management, corporate strategy, and plans for the future. The balance sheet, income statement, and statement of cash flows each provide an indispensable vantage point on the company’s performance. Understanding what the different statements do and how they fit together enables the reader to uncover the company’s narrative or story, with a view to developing expectations for future performance and evaluating how different strategy options will affect future cash flows.