Getting to the Top
A Peek Inside the Family Capital 750


Late last month, Family Capital released its third annual ranking of the world’s largest family businesses, the Family Capital 750. As the name suggests, the list includes 750 global family businesses with 2019 revenue ranging from $2.7 billion (#750 on the list, Yanlord Land Group Limited, from Singapore) to $514 billion (#1 on the list, Walmart).
Here at Family Business Director, we just can’t walk past a spreadsheet without digging into it a bit, so in this week’s post, we are sharing what we found when we scrubbed the data.
Public vs. Private Ownership
The list includes both traditional privately owned family businesses and public companies in which the founding family continues to exercise significant voting influence and ownership (at least 30% of the voting rights).
The list includes 404 public companies (54% of total), and 346 private companies (46% of total).
Average family ownership for the public companies was approximately 53%, compared to almost 96% for the private companies.
Nine of the ten largest companies on the list were public, but the median revenue for the public companies ($6.3 billion) was only modestly greater than the private companies ($5.9 billion).
The public company model is much more prevalent in the Asia-Pacific region, where 80% of the family businesses making the list were public companies.
Geography
Approximately 40% of the companies on the list are headquartered in Europe, with the Asia-Pacific and North America regions both contributing 25%. Of the remaining 15%, Latin America was the biggest contributor, with 41 companies (5% of the total).
The accompanying article noted that over the three years the list has been compiled, the number of family businesses from the Asia-Pacific region has grown. Table 1, summarizing the decades in which the constituent firms were founded, reinforces this trend.
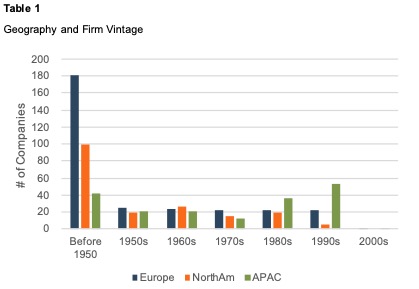
Of the 92 companies on the list founded after 1990, 55 (60%) are in the Asia-Pacific region.
Over 60% of the European family businesses on the list were founded prior to 1950, compared to just 22% for the Asia-Pacific region.
The North American entrants were also more mature, with 53% in the pre-1950 category. Significantly, only 6 of the 92 companies founded after 1990 are in North America, compared to 55 in Asia-Pacific and 23 in Europe.
Industry Classification
The companies on the list are divided into 65 different industry categories. Just over half of the companies operate in ten industries as summarized in Table 2.
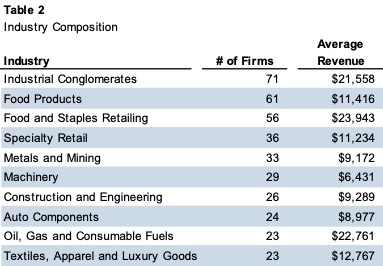
Examining the list, family businesses thrive on making stuff; financials are under-represented relative to the S&P 500 or any other broad equity index. Eating is a pretty universal pastime, and family firms are especially focused on either making or distributing foodstuffs. The penchant for diversification within family businesses can also be discerned from the list, as industrial conglomerates comprise nearly 10% of the list.
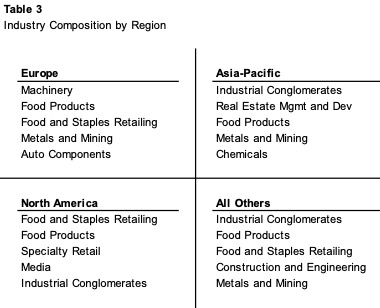
Table 3 presents the top 5 industries for each region. While the food categories are ubiquitous, the remaining industry categories vary a bit from region to region. Industrial conglomerates do not crack the top five in Europe, while the metals and mining industry is not in the top five in North America.
Vintage
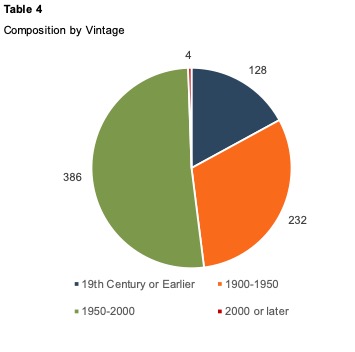
Table 4 summarizes the composition of the group by vintage. It takes time to reach $2.7 billion in revenue, so it shouldn’t be too surprising that only 4 of the family businesses on the list were founded after 2000. At the same time, knowing how challenging it is to manage the diverse needs of multiple generations of a family, it is remarkable that almost half of the companies in the list have been in business for over 70 years. For most families, that corresponds to at least four reasonably active generations in the business.
About 17% of the family businesses represented in the list were founded in the 19th century or earlier. Those families clearly demonstrate that “shirtsleeves to shirtsleeves” is not an inescapable fate for enterprising families.
Takeaways
Is this all just so much trivia, or are there any lessons to be gleaned for the millions of family businesses that haven’t cracked the Family Capital 750 yet? We think the data does highlight some things for family business leaders to think about:
- While becoming one of the 750 largest family businesses in the world may be a laudable goal, is it the right goal for your family? What does your family business mean to your family? Is it a growth engine for future generations or a source of lifestyle for the current generation? Is it a stable store of value or a source of diversification for family shareholders?
- Is your goal to perpetuate family ownership of the business? Sustaining the family business as a family business across multiple generations requires diligent efforts at promoting positive shareholder engagement. Are your family shareholders excited to be family shareholders? Do they understand the financial and non-financial rewards of ownership? Do they understand the burdens of ownership? How is family legacy related to continued ownership of the family business? Do you ever ask them about these things?
- Over half of the companies on this list rely on non-family equity capital to fund operations. This is a big step, and one that a lot of families are naturally hesitant to take. Over the long-term, how will the capital needs of your family business be met?
- Based on reported aggregate figures, the revenue for the 750 largest family businesses in the world grew by more than 13% in 2019. While we can’t know for certain how much of that growth was truly organic, it is clear that – for these firms – growth remains a priority. Is your family business growing? If not, is it because of lack of opportunity or lack of capital?
- As we noted previously, almost 10% of the companies on the list are described as conglomerates. The purpose of a conglomerate is to diversify operations in an effort to reduce shareholder risk. How do your family shareholders think about risk? Are they well-diversified, or is most of their wealth tied up in the family business? How do the answers to those questions influence your dividend policy, capital structure, and capital allocation decisions as family business directors?
We could probably go on, but that’s plenty to chew on this week. Give one of our family business advisory professionals a call today to help you think through these questions in confidence.