
Key Takeaways
April 2026 auto sales showed a modest month-over-month decline and a sharper year-over-year drop, largely influenced by distorted comparisons from prior tariff-driven demand and ongoing affordability pressures.
Inventory levels are stabilizing overall, but significant variation persists across brands and price segments, with tighter supply in lower-priced vehicles and slower turnover in higher-priced models.
Elevated transaction prices and rising financing costs continue to constrain consumer demand, making incentives, pricing strategy, and product mix critical factors shaping market performance.
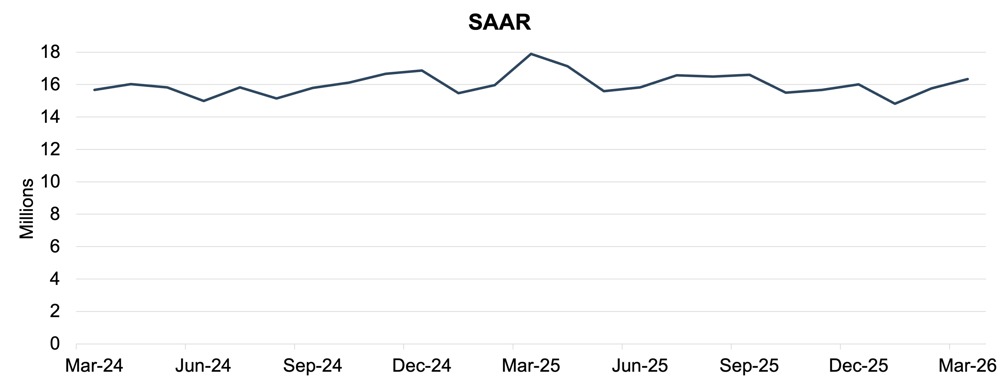
In April 2026, the U.S. auto industry experienced a slight decline with April’s SAAR of approximately 15.9 million units, down from 16.2 million in March. On a month-over-month basis, total sales decreased 1.5%, reflecting a moderate slowdown.
However, on a year-over-year basis, total sales declined 7.1% compared to April 2025. This decline is largely attributable to a distorted comparison, as April 2025 benefited from some pull-forward demand associated with anticipated tariff changes. As higher fuel prices spurred by the conflict in the Middle East have been passed on to consumers, some negative consumer sentiment associated with rising prices is likely to temper demand, creating distortion on both sides of the year-over-year comparison. Despite the starkly different macroeconomic conditions distorting the year-over-year comparisons, both April 2025 and April 2026 had the same number of selling days (26), offering some stabilization in the underlying data.
Following the muted recovery from early year buying patterns in March, April results generally benefited from improved seasonal conditions, including longer selling days and increased showroom traffic. Like last month, affordability constraints including elevated transaction prices and financing costs continue to be the defining headwinds for consumer purchasing behavior. This is only magnified by increased costs at the pump.
Unadjusted Sales Data
On an unadjusted basis, April 2026 industry sales reached approximately 1.3 million units, reflecting a slight decrease from March’s 1.4 million units. This represents typical seasonal stagnation as consumer demand experiences a slowdown ahead of summer spending. The 1.9% decline in unadjusted volumes from March to April 2026 was in line with declines in 2022 and 2023. The March to April decline was closer to 8% in 2024 and 2025 and 17% in 2018 and 2019. While April declines are expected from March, broader trends indicate a larger economic slowdown as April 2026 unadjusted sales are down 7.0% compared to April 2025. For comparison, the March year-over-year slowdown was approximately 13.0%, indicating a slower spring selling season in 2026 compared to 2025. While 2025 showed stronger recovery trends, early 2026 suggests a more tempered environment with sales increasingly influenced by demand conditions rather than supply constraints.
As illustrated in the chart below, April sales over the past several years demonstrate the expected slight seasonal decrease from March levels; however, the slope of the recovery appears to have moderated.

Days’ Supply
Cox Automotive indicates that national days’ supply decreased to 79 days in March 2026, compared to 96 days in February 2026. Total inventory volume increased in March by 6.1%, although the higher inventory in March 2026 is slightly skewed following the pull-ahead purchases related to tariffs in March 2025.
While January and February are typically slower selling months, improvements in inventory demonstrated in the March data are an encouraging sign for the year’s performance. Embedded in March days’ supply results is that inventory is particularly tight for vehicles listed under $40,000. According to Cox Automotive, this segment of affordable vehicles is in increasingly limited supply, and inventory growth is concentrated in vehicles above $40,000, limiting dealers from raising asking prices without lowering sales.
At the brand level, similar trends from February remain pronounced, with Toyota and Lexus leading the industry in disciplined inventory levels and reaching days’ supply below 40 days. In contrast, brands such as Land Rover, Mercedes, and Volkswagen report days’ supply exceeding 100 days.
See the chart below for a look at days' supply by brand in March 2026.

March data continues to highlight that consumer demand is diverging across brands and vehicle types even as overall inventory conditions become more balanced. Some automakers are still keeping inventories relatively tight and vehicles moving efficiently, supported by strong brand loyalty and alignment with practical, high-demand segments. Meanwhile, other brands with heavier exposure to higher-priced or mid-market vehicles are experiencing slower sales and a buildup of supply in certain models. There are also early signs that more expensive vehicles, particularly in premium segments, are lingering on dealer lots longer as buyers remain cautious about affordability. In contrast, brands with competitive SUV and truck lineups or pricing that better matches current consumer budgets are seeing healthier turnover. These differences suggest that inventory performance is increasingly shaped by how well each brand’s lineup matches current demand rather than by broad market trends alone.
Overall, March reflects a market that appears steady overall but continues to show meaningful variation beneath the surface. While supply levels are no longer as constrained as in recent years, aligning inventory with today’s price-sensitive consumer remains an ongoing challenge. As the industry heads deeper into the spring selling season, these gaps in brand performance are likely to persist, reinforcing a market where outcomes depend more on product mix and pricing strategy than on overall industry conditions.
Transaction Prices
According to JD Power, total new vehicle retail sales for April 2026 are expected to decrease 7.3% year-over-year while average financing payments reach a record $812 per month in April. As previously discussed, the pull-forward in demand in April 2025 elevated sales data, creating a distorted comparison with April 2026.
The average new vehicle retail transaction price in April is expected to reach $45,990, essentially flat compared to a year ago. Manufacturer incentive spending on non-EVs is expected to rise to approximately $2,860 per unit, a roughly 15.7% increase from last year, as automakers work to support demand in a more normalized supply and demand environment.
From a mix perspective, trucks and SUVs remain the primary drivers of volume, reinforcing the industry’s reliance on larger, higher-priced vehicles. This mix continues to support elevated average transaction prices and overall revenue levels despite softer unit sales.
Thomas King, the president of OEM solutions at JD Power, discussed the factors impacting incentive spending in April:
“Affordability continues to constrain the vehicle sales pace even as pricing and financing conditions show modest signs of improvement. Despite easing borrowing costs, average monthly finance payments are expected to increase 3.1% year over year to $812, driven primarily by continued deterioration in trade-in equity. Average trade-in equity is declining toward $7,099, down $660 from a year ago, while the share of vehicles carrying negative equity is trending to reach 31.3%—the highest level for the month of April since 2020 and an increase of 5.5 percentage points from 25.8% a year ago as consumers who purchased during the peak of inventory shortages four years ago return to market.
In response, manufacturers are increasing incentive support to help offset the impact of negative equity. Incentives as a percentage of MSRP are expected to hit 6.1% in April, up 0.5 percentage points from April 2025. Incentive spending on EVs remains materially higher, on pace to reach $10,018 per unit. That is down 1.7% from last year, but still underscores the continued role of discounting in supporting demand for electric vehicles.”
May 2026 Outlook
In May 2026, U.S. new-vehicle sales are expected to maintain a steady pace, with SAAR holding in the mid-15 million to low-16 million range.
Seasonal support from tax refunds is expected to begin fading, placing greater emphasis on underlying consumer fundamentals. As a result, demand may become more uneven across segments, with price-sensitive buyers remaining constrained despite slightly improving interest rates. At the same time, transaction prices are expected to remain near historically high levels, reinforcing the importance of incentives, which are gradually increasing as automakers work to sustain sales momentum in a more normalized environment.
Inventory conditions are expected to remain relatively balanced overall, with total supply near pre-pandemic norms, but notable differences across brands will likely persist.
Overall, the industry’s performance in May will continue to be shaped by the interplay between affordability and demand rather than inventory shortages. Success will depend on how effectively OEMs balance pricing, incentives, and inventory management to align with cautious and highly selective consumer demand.