
Key Takeaways
August 2026 SAAR increased to 16.8 million units, up 2.7% from July and 1.6% year over year, indicating resilient vehicle demand despite persistent affordability pressures and broader economic uncertainty.
Inventory conditions tightened modestly, with national days’ supply declining to 75 days and substantial variation across manufacturers.
September sales are expected to remain near the mid-16 million SAAR range, supported by replacement demand, balanced inventories, and the timing of Labor Day, although high prices, financing costs, and negative equity are likely to constrain further growth.
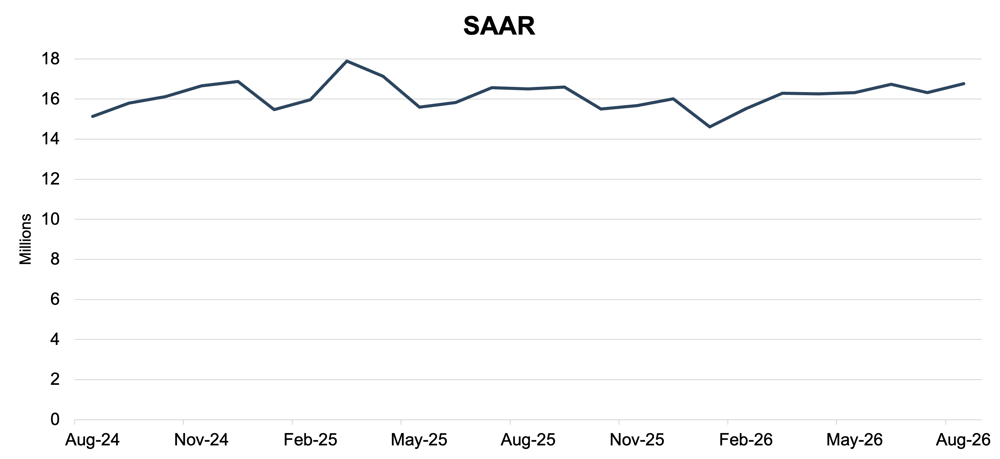
In August 2026, the U.S. auto industry experienced a modest improvement as the SAAR increased to 16.8 million units, up 2.7% from 16.3 million units in July 2026. On a year-over-year basis, the SAAR increased 1.6% compared to August 2025. The improvement represents a reversal from July, when the selling rate declined from the prior month. August’s stronger pace suggests underlying demand remains relatively resilient despite continued affordability pressures, elevated vehicle prices, and broader macroeconomic uncertainty.
Year-over-year comparisons remain somewhat complicated by conditions in August 2025. Last year, consumers accelerated EV purchases ahead of the expiration of federal tax credits, while the Labor Day selling weekend also fell within the August reporting period. These factors elevated prior-year sales volumes and make simple volume comparisons less instructive when evaluating the underlying pace of demand.
August’s 16.8 million SAAR is among the stronger monthly readings of 2026 and continues the relatively narrow range that has characterized the market over the past several months. While sales have not accelerated materially, the market has continued to absorb available inventory despite higher financing costs and elevated monthly payments.
Unadjusted Sales Data
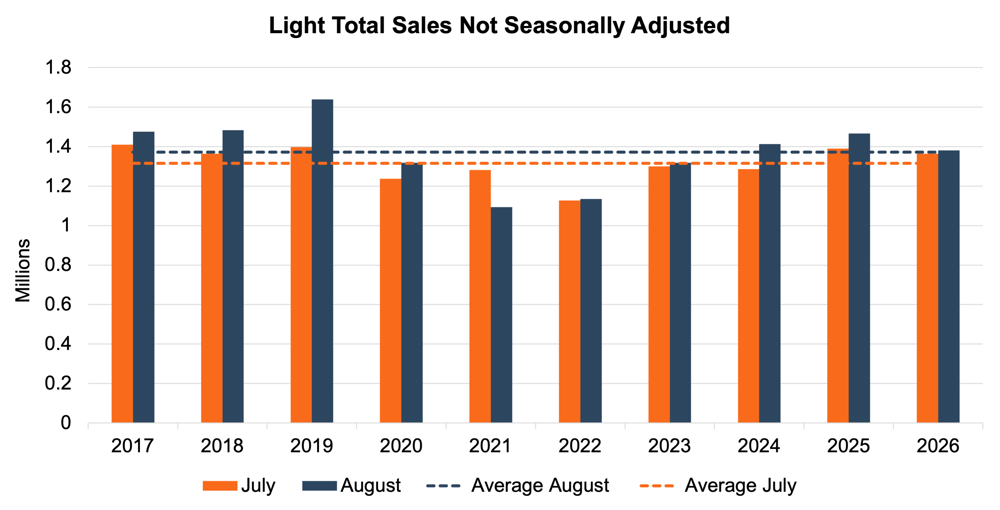
On an unadjusted basis, August 2026 industry sales reached approximately 1.38 million units, up 1.3% from approximately 1.36 million units in July. This increase is directionally consistent with typical seasonality as late-summer promotional activity and model-year changeovers generally support August sales.
While August sales increased from July, the magnitude of the increase was relatively modest compared to historical trends. Over the past decade, August sales have exceeded July sales in nine of ten years, with 2021 the only decline in the series due to supply chain constraints prevailing at the time. The 1.3% increase in 2026 compares with increases of 9.8% in 2024 and 5.5% in 2025. In short, August followed the typical seasonal direction, but at a slower pace than several recent years.
Days’ Supply
Cox Automotive indicates that national days’ supply declined to 75 days in July 2026 as stronger sales outpaced inventory replenishment. Available new-vehicle inventory totaled approximately 2.73 million units at the start of August, down 3.5% from a month earlier and essentially unchanged from a year earlier. July sales increased 8.5% from June and 2.9% year over year, helping reduce days’ supply from a revised 82 days at the beginning of July.
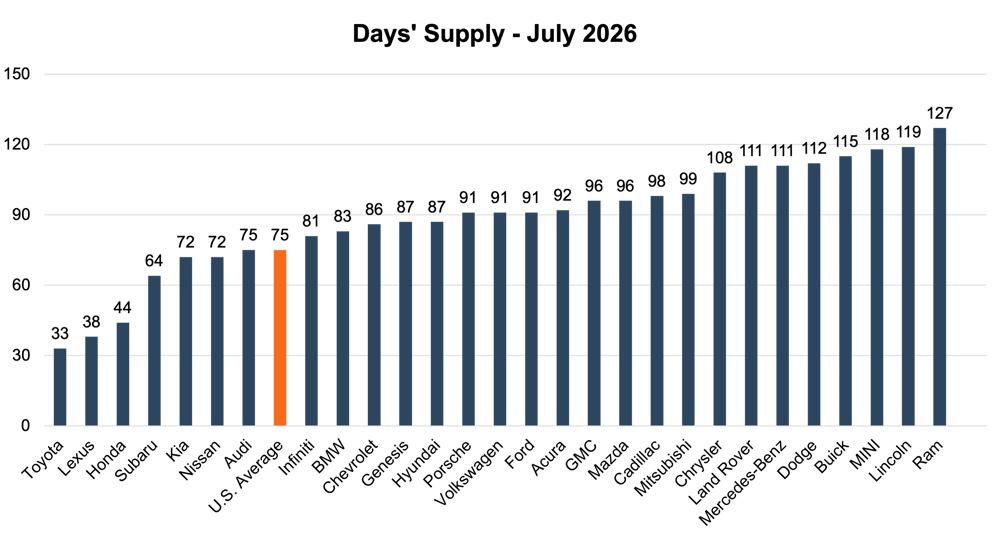
Inventory conditions continue to vary considerably by manufacturer. Toyota remained the tightest major brand at 33 days’ supply, followed by Lexus at 38 days and Honda at 44 days. At the other end of the distribution, Ram carried 127 days’ supply, while Lincoln, MINI, Buick, Dodge, Mercedes-Benz, Land Rover, and Chrysler were all above 100 days. The industry average of 75 days therefore continues to mask substantial variation across brands.
The distribution remains important because several of the highest-volume manufacturers continue to operate with relatively lean inventories. Toyota, Lexus, and Honda remain well below the industry average, while a number of brands with materially higher days’ supply account for a smaller share of overall sales. As a result, the national average is influenced disproportionately by manufacturers with stronger sales volumes and faster inventory turnover.
The broader inventory picture also appears to be tightening modestly. The inventory-to-sales ratio declined to 1.36 in July from 1.41 in June. While this remains above the 1.08 average since January 2021, it is substantially below the 2.52 average recorded between 1993 and 2020. The comparison illustrates how inventory conditions have normalized from the extreme shortages experienced earlier in the decade without returning to pre-pandemic levels, which generally supports auto dealership earnings remaining above pre-COVID levels but below recent peaks.
Transaction Prices
According to JD Power, average new-vehicle transaction prices increased 2.0% year over year to $45,563 in August 2026. At the same time, the average interest rate on new-vehicle loans is expected to decline 0.06 percentage points to 6.55%, the lowest August reading since 2022. Despite the modest improvement in financing rates, average monthly payments increased 3.7% to $812, the highest August level on record.
Lower trade-in equity continues to contribute to higher monthly payments. The proportion of trade-ins with negative equity increased 0.6 percentage points to 28.8% as consumers who purchased vehicles during the period of constrained inventories and elevated prices continue to return to the market. Consumers are also increasingly relying on longer financing terms, with 13.9% of loans carrying terms of 84 months or longer, up 2.1 percentage points from August 2025. Subprime penetration increased 2.0 percentage points to 10.8%.
These trends continue to demonstrate the structural affordability pressures facing consumers. Although financing rates have eased modestly, higher vehicle prices and weaker trade-in equity are offsetting much of the benefit. Longer loan terms can reduce monthly payment pressure in the near term, but they may also contribute to persistent negative-equity challenges as consumers return to the market before their existing loans have amortized sufficiently.
From a mix perspective, hybrid powertrains continued to gain share. JD Power expected hybrids to account for 18.2% of retail sales in August, an increase of 4.8 percentage points from the prior year. EV share declined to 7.2% as the market continued to adjust to the elimination of federal EV tax credits. JD Power also noted that unusually low availability of hybrid vehicles constrained August sales despite strong consumer demand.
Thomas King, the president of OEM solutions at JD Power, discussed the factors impacting incentive spending in August:
“Manufacturers are leaning harder into discounts to keep buyers in the market. Average incentive spending per vehicle is trending towards $3,384, a 5.9% increase from a year ago. Part of that jump reflects tariff-related dynamics a year ago, when several OEMs made unseasonal pullbacks in incentive spending to preemptively offset tariff costs. Incentives as a percentage of MSRP are expected to hit 6.6% in August, up 0.3 percentage points from August 2025”
The combination of increasing transaction prices, record August monthly payments, and rising use of extended financing terms suggests that affordability remains the primary constraint on further market growth. Demand continues to hold up, but consumers are increasingly relying on financing structure, incentives, and trade equity (if they have any) to make higher-priced vehicles fit within household budgets.
September 2026 Outlook
September is expected to remain relatively stable, with U.S. new-vehicle sales likely to stay near the mid-16 million SAAR range. August’s improvement demonstrates that underlying demand remains resilient, while declining inventory and stable pricing suggest manufacturers have generally maintained production discipline. Replacement demand, relatively balanced inventories, and continued strength among higher-income consumers should provide support for sales.
However, affordability remains the primary constraint on further growth. Average transaction prices continue to rise, monthly payments remain elevated, and nearly three in ten trade-ins carry negative equity. Even with modestly lower interest rates and increased incentive activity, these pressures are likely to limit the pool of consumers able or willing to purchase new vehicles.
September comparisons may also be affected by the timing of the Labor Day selling period. Unlike 2025, when Labor Day activity was included in August, the holiday selling weekend falls within September’s reporting period in 2026. As a result, some sales activity that appeared in August last year should shift into September this year, potentially supporting reported volumes.
Inventory conditions should remain relatively balanced, although differences between manufacturers will continue to influence pricing and incentive strategies. Brands with days’ supply materially above the industry average are likely to rely more heavily on discounts and financing offers, while manufacturers with tighter inventories should retain greater pricing flexibility. Demand is also likely to remain concentrated in more affordable vehicles and hybrid powertrains, where consumer interest continues to exceed availability in some segments.
Absent a meaningful change in macroeconomic conditions, the industry appears positioned to continue operating within the relatively narrow sales range that has characterized much of 2026. August’s stronger SAAR is encouraging, but elevated prices, financing costs, and negative equity suggest that any further acceleration in sales will likely remain modest. We’ll be watching to see how, if noticeably, the Fed’s recent decision to raise interest rates ripples through the market.