
Key Takeaways
U.S. auto sales softened in July 2026, with SAAR declining to 16.3 million units. Year-over-year sales declined 1.5%, representing the 5th decline in 7 months, suggesting the industry may finish 2026 below 2025 levels.
Inventory remains relatively balanced overall, but significant differences by manufacturer show that high-volume brands with leaner inventories are pulling the national days’ supply average below the levels reported by many lower-volume brands.
Affordability remains the primary constraint on demand as elevated transaction prices, monthly payments, negative equity, and longer loan terms suggest demand is now limiting sales rather than supply.
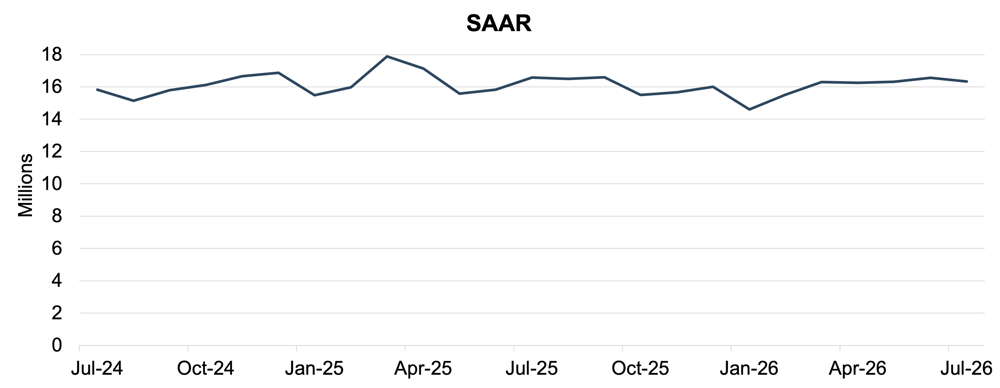
In July 2026, the U.S. auto industry experienced a modest decline as the SAAR decreased to 16.3 million units, down 1.4% from 16.6 million units in June 2026.
On a year-over-year basis, total sales decreased 1.5% compared to July 2025, though sales in July 2025 were 4.7% higher than July 2024, demonstrating relative consistency. In terms of cyclicality, July 2026 may represent a regression to the mean rather than a contraction. Compared to last year, consumers face additional affordability and macroeconomic pressures. Additionally, July 2025 benefited from pull-ahead demand in anticipation of the expiration of EV tax credits.
After sales in the first four months of the year were lower on a year-over-year basis, May and June were the first months of 2026 to indicate increasing sales year-over-year. July’s reversal of this trend suggests 2026 may finish below 2025, the first annual decline since the chip-shortage decline in 2022.
Unadjusted Sales Data
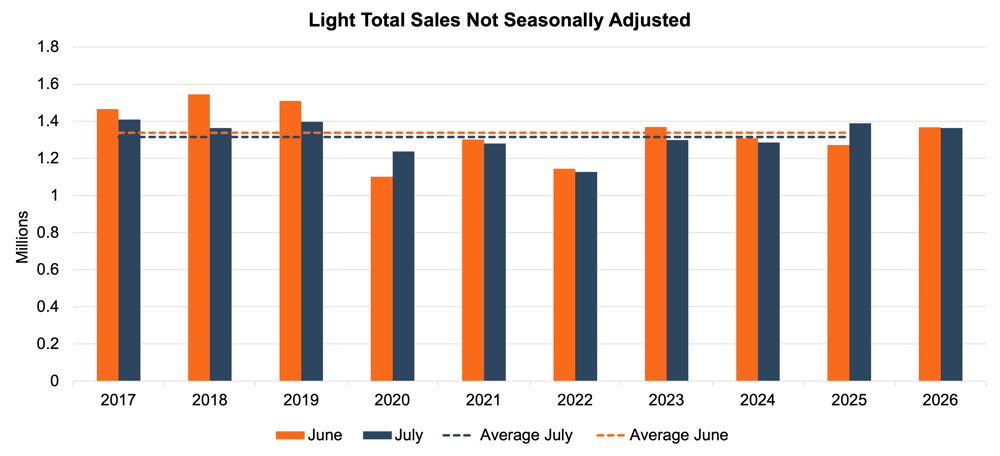
On an unadjusted basis, July 2026 industry sales reached approximately 1.36 million units, down 0.2% from June 2026. This reflects a moderate decrease in seasonal demand as summer spending has subsided and households are preparing to transition into fall. Additionally, consumers may be anticipating model changeovers and larger late-summer discounts, choosing to forgo large purchases in favor of cost savings later in the year.
While unadjusted July selling volumes decreased in 2026, the contraction is in line with prior years. In the last decade, unadjusted sales have increased between June and July only twice, indicating that the decline between June 2026 and July 2026 is not necessarily cause for concern. For comparison, the magnitude of the decline between June 2026 and July 2026 (0.2%) is the smallest absolute value of a change in the last ten years.
Days’ Supply
Cox Automotive indicates that national days’ supply increased to 80 in June 2026, up from 78 in May. New vehicle inventory totaled 2.82 million units in June, down 2.4% from May and largely unchanged from a year earlier. Despite the modest increase in days’ supply, the new-vehicle market remains relatively balanced, with overall inventory levels holding steady through much of 2026. Similar to recent months, however, inventory conditions vary considerably by manufacturer. Toyota and Lexus continue to operate with relatively lean inventories, while Jeep, Ram, and Dodge remain among the brands with the highest days’ supply.
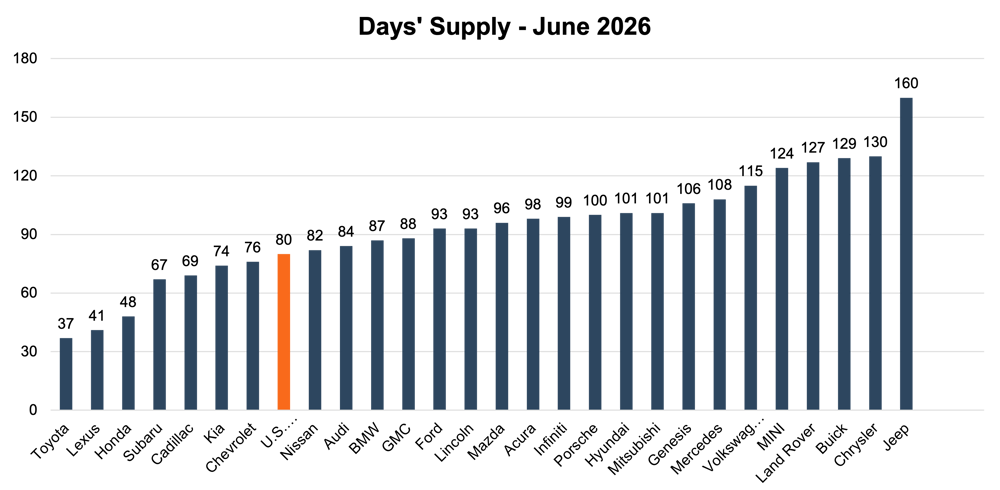
The data is skewed with a long right tail, and it’s likely not a coincidence that the lower volume brands have higher days’ supply. With Toyota and Lexus vehicles in high demand and inventories still relatively low, their days’ supply figure well below other brands. Because Toyota is among the highest volume, it lowers the industry-wide days’ supply average.
Mid-year sales data is instructive. Toyota, Ford, Chevrolet, Honda, Hyundai, and Kia accounted for a significant share of U.S. sales through the first half of 2026, and several of these higher-volume brands are operating with relatively lean inventories. Toyota alone sold more than 1.0 million vehicles through June, while Honda, Hyundai, and Kia also posted strong first-half volumes.
Conversely, several brands with days’ supply above 100 days represent a much smaller portion of total industry sales. For example, Cadillac sold approximately 66,900 vehicles through the first half of 2026, while Dodge sold approximately 44,500. As a result, high-volume brands with tighter inventories exert greater influence on the industry-wide days’ supply figure, helping pull the national average below the simple average of the individual brands shown in the chart.
Despite continued macroeconomic uncertainty, elevated borrowing costs, and geopolitical concerns, dealers and manufacturers have generally maintained consistent inventory levels during 2026. With the SAAR indicating volumes may finish the year below 2025, it appears demand has become the limiting factor on sales, not supply.
As we have previously discussed, the largest concentration of available vehicles is in the $30,000 to $40,000 range, where dealers had upwards of half a million units at month-end, accounting for 24% of inventory. While average listing prices remain elevated, the concentration of inventory in more moderately priced segments suggests that affordability continues to play an important role in consumer demand and dealer inventory decisions. Overall, relatively stable inventory levels in 2026 suggest that dealers have continued to manage supply carefully despite an uncertain demand environment.
By carrying more affordable vehicles on the lot, dealers also benefit from lower carrying costs as the Federal Open Market Committee (FOMC) is now looking more likely to raise rates than cut them. Last month’s meeting included three dissents to the decision to leave rates unchanged, with all three dissenters advocating for a rate hike (two calling for a 25bps hike, one for 50bps). The recently installed Fed Chair Kevin Warsh has removed forward guidance as one of his first changes from how the FOMC has recently operated. Another change ushered in by Warsh is an environment that welcomes, if not encourages, dissent rather than the traditional emphasis on unanimity that Powell, Yellen, and prior Fed chairs preferred. Many are parsing whether these dissents will effectively replace forward guidance. Whether dissent patterns replace forward guidance or not, dealers keeping more affordable vehicles on the lot are likely better poised to navigate the rest of the year.
Transaction Prices
According to JD Power, new-vehicle retail sales for July 2026 are expected to increase 0.9% year over year. Average transaction prices increased 1.2% to $45,369 from this time last year. At the same time, the average interest rate on new-vehicle loans is expected to decline to 6.54%, the lowest July reading since 2022. Despite easing financing rates, average monthly payments increased 3.3% to $808, the highest July level on record, illustrating that affordability pressures remain elevated.
Lower trade-in equity continues to contribute to higher monthly payments. The proportion of trade-ins with negative equity increased 1.1 percentage points to 29.4%, as more consumers who purchased vehicles when prices peaked several years ago return to the market. Consumers are also increasingly relying on longer financing terms to manage payments, with 13.8% of loans carrying terms of 84 months or longer, up 2.0 percentage points from July 2025. Subprime penetration also increased 1.8 percentage points to 10.3%, further demonstrating the effects of affordability pressures on the composition of new-vehicle buyers.
From a mix perspective, hybrid powertrains continued to gain share, increasing 2.5 percentage points to 15.9% of retail sales as elevated fuel prices and greater hybrid availability influenced consumer demand. EV share declined 3.3 percentage points to 7.0%, demonstrating the continued fallout of the elimination of federal EV credits nearly a year ago.
Thomas King, the president of OEM solutions at JD Power, discussed the factors impacting incentive spending in July:
“Manufacturers are leaning harder on discounts to keep buyers in the market. Average incentive spending per vehicle is trending towards $3,451, an 8.1% increase from a year ago. Part of that jump reflects tariff dynamics last year, since several OEMs made unseasonal pullbacks in incentive spending last July as they cut discounts precautionarily to offset tariff costs. Incentives as a percentage of MSRP are expected to hit 6.7% in July, up 0.4 percentage points from July 2025.
“The divergence in manufacturer incentive strategies by powertrain continues to be evident in July. Incentive spending on traditional ICE and hybrid vehicles is expected to increase $578 per unit year-over-year, up 22.2%, to $3,181 in July 2026. Meanwhile, EV incentives moved in the opposite direction with a forecasted decline of $759 per unit or 7.0% to $10,092, contributing to the 3.3 percentage point decline in EV share of new vehicle sales compared to last year.”
August 2026 Outlook
August is expected to remain relatively stable, with U.S. new-vehicle sales likely to stay near the mid-16 million SAAR range. Replacement demand, improved inventory availability, and steady labor market conditions should continue to support sales. However, affordability remains the primary constraint as elevated vehicle prices, financing costs, and negative equity continue to pressure consumers. Absent a meaningful macroeconomic shift, industry sales are unlikely to move materially higher or lower in August.
Brands with elevated days’ supply will likely continue to rely more heavily on incentives and financing offers, while manufacturers with tighter inventories should retain greater pricing discipline. Demand is expected to remain strongest in more affordable segments, making pricing, incentives, and inventory mix increasingly important to competitive performance through the remainder of 2026.