
Key Takeaways
March 2026 SAAR showed a sequential recovery, but year-over-year comparisons were distorted due to prior-year pull-forward demand from tariffs.
Inventory dynamics continue to highlight a bifurcated market, with significant variation by brand and price point influencing pricing power and sales performance.
Affordability pressures, including elevated transaction prices and financing costs, remain the primary constraint on demand despite improving seasonal conditions.
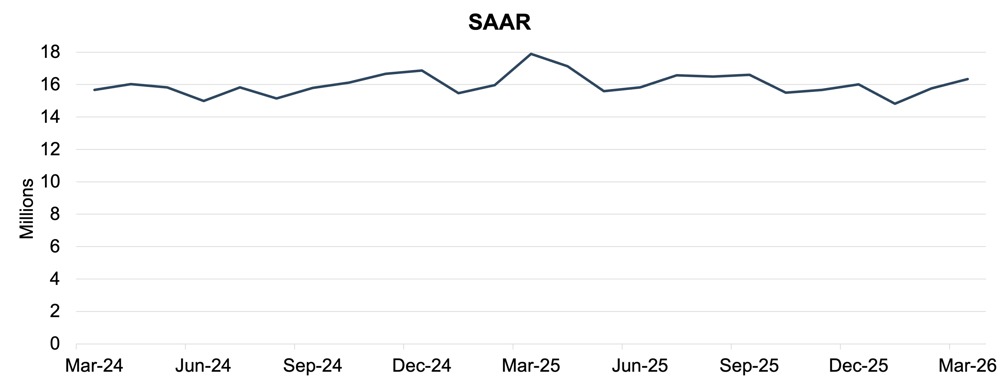
In March 2026, the U.S. auto industry continued its seasonal recovery, with total SAAR reaching approximately 16.3 million units, up from 15.8 million units in February. On a month-over-month basis, total sales increased 3.7%, reflecting gains beyond typical seasonal patterns.
However, on a year-over-year basis, total sales declined 8.7% compared to March 2025. This decline is largely attributable to a distorted comparison, as March 2025 benefited from pull-forward demand related to anticipated tariff changes. As a result, the year-over-year softness is not necessarily a deterioration in underlying demand.
Following weather-driven weakness in January and a muted recovery in February, March results benefited from improved seasonal conditions, including longer selling days and increased showroom traffic. While these tailwinds supported higher volumes, affordability constraints—including elevated transaction prices and financing costs—continue to shape consumer purchasing behavior.
Unadjusted Sales Data
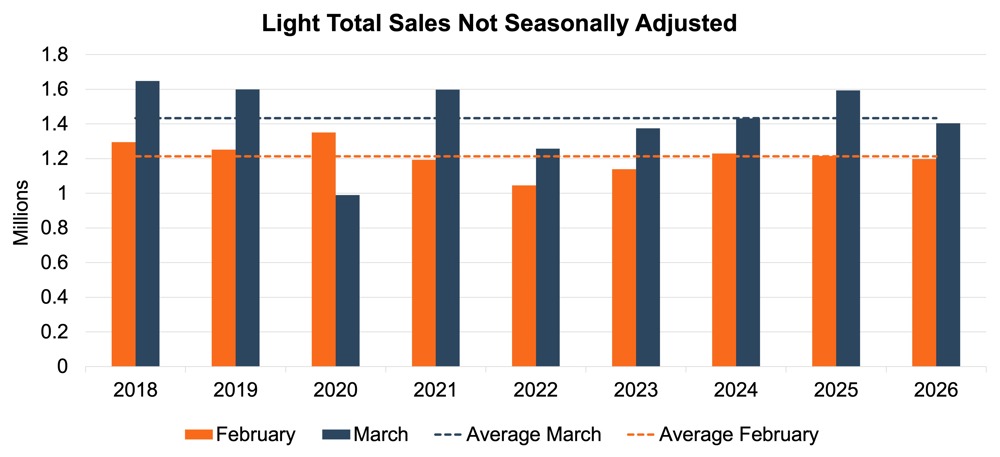
On an unadjusted basis, March 2026 industry sales reached approximately 1.4 million units, reflecting a meaningful increase from February’s 1.2 million units. This represents typical seasonal acceleration, though volumes declined approximately 12.0% compared to March 2025.
From a historical perspective, March volumes continue to reflect normalization from the supply-constrained environment of 2021 through 2023. While 2024 and 2025 showed stronger recovery trends, early 2026 data suggests a more tempered trajectory, with sales increasingly influenced by demand considerations rather than supply limitations.
As illustrated in the chart below, March sales over the past several years demonstrate the expected seasonal increase from February levels; however, the slope of recovery in 2026 appears flatter relative to the sharper gains observed in 2024 and 2025.
Days’ Supply
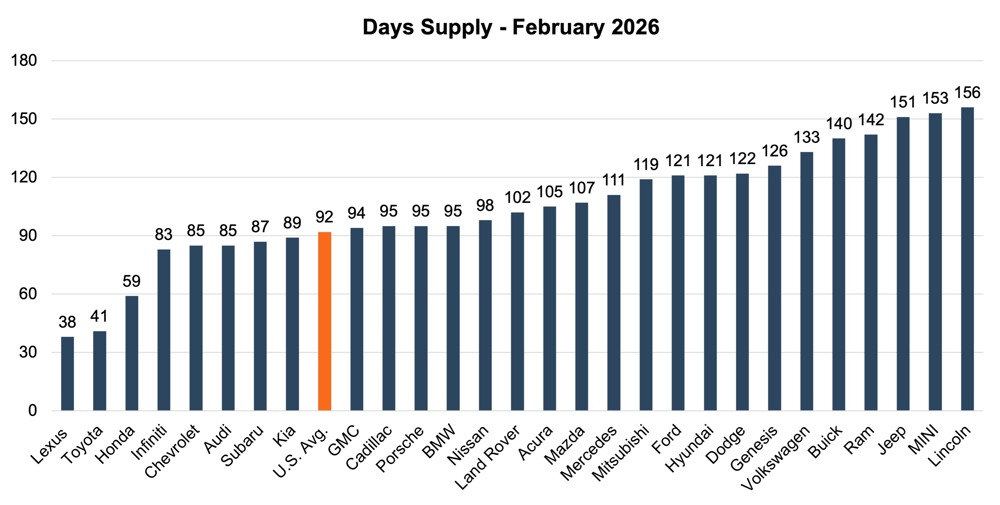
Cox Automotive indicates that national days’ supply decreased to 92 days in February 2026, compared to a national average of 98 days in January. Total inventory volume increased month-over-month, which is typical in February as dealers build inventory to meet increasing seasonal demand. The elevated days’ supply from year-end 2025 is also a function of slower sales velocity in addition to increases in inventory levels.
At the brand level, disparities remain pronounced. Toyota, Lexus, and Honda continue to operate with disciplined inventory levels, maintaining days’ supply below 65 days. In contrast, brands such as Land Rover, BMW, and Mercedes-Benz remain above the industry average, with days’ supply exceeding 100 days.
See the chart below for a look at days' supply by brand in February 2026.
February numbers continue to reinforce the trend that demand varies widely by price. The $35,000 to $45,000 range outperformed the rest of the market and carried the leanest inventory at 81 days’ supply. Toyota, Honda, Nissan, and Kia maintained particularly controlled inventory in February and continued to retain pricing power, leading to increased demand from dealers.
For vehicles in the $45,000 to $55,000 range, February proved more challenging, leading to this “stretch zone” price band experiencing the weakest inventory levels at 120 days’ supply. This trend is heightened by middle-income buyers returning to the market after four to five years and being surprised by significantly higher vehicle prices. Brands with high exposure in the mid-market, such as Ford and Jeep, experienced inventory and demand balancing issues, resulting in higher days’ supply.
Overall, February reflects the ongoing trend of a bifurcated market. While national metrics remain stable, underlying inventory imbalances persist. These trends may become more pronounced as brands anticipate a spring selling season that may or may not fully materialize.
Transaction Prices
According to J.D. Power, total new vehicle retail sales for March 2026 are expected to increase 11.9% from February levels, supported by improved seasonal conditions and a higher number of selling days. However, March 2026 has 25 selling days, one fewer than March 2025. Year-over-year new vehicle sales are expected to decrease 7.4% from Q1 2025 when adjusted for selling days.
The average new vehicle retail transaction price in March is expected to reach $45,859, representing an increase of approximately 2.5% from March 2025. Elevated pricing continues to impact consumer demand, with higher monthly payments driven by both vehicle prices and financing costs.
From a mix perspective, internal combustion engine vehicles are projected to account for approximately 76% of total retail sales, representing a modest increase from the prior year. Hybrid vehicles continue to gain share, while EV penetration is expected to decline by approximately 2 percentage points year-over-year, contributing to shifts in pricing and incentive dynamics.
Thomas King, president of OEM solutions at J.D. Power, noted that affordability remains the primary barrier to higher vehicle sales. Manufacturer incentive spend per vehicle is projected to reach $3,325, up $165 from a year ago. Discounts on EVs are expected to average $11,258, while discounts on non-EVs are projected at $3,030, representing 6.0% of MSRP. Increased incentive flexibility on non-EVs reflects their higher profit margins relative to EVs.
While performance in early 2026 remains muted, interpreting year-over-year results will remain challenging due to distortions from tariff-related demand and EV tax credit pull-forwards in 2025. A clearer picture of full-year performance is likely to emerge later in 2026.
April 2026 Outlook
In April 2026, U.S. new-vehicle sales are expected to continue improving, with SAAR projected to remain in the mid-15 million to low-16 million range as the spring selling season progresses. Despite sequential gains, volumes are likely to remain slightly below year-ago levels due to ongoing affordability constraints.
Tax refund season is expected to provide a near-term tailwind, particularly among price-sensitive consumers. Refund-driven down payments may help offset elevated transaction prices and financing costs, supporting retail demand in the early second quarter.
Transaction prices are expected to remain elevated, and while interest rates may gradually ease, affordability of monthly payments will remain a key consideration. Incentive activity is expected to increase modestly, particularly among brands with higher inventory levels.
Inventory levels are projected to remain stable overall, with days’ supply gradually normalizing as sales volumes increase. However, disparities across OEMs are expected to persist, with some brands maintaining pricing power while others rely more heavily on incentives.
Overall, second-quarter performance will be shaped less by supply constraints and more by the balance between affordability and demand. OEMs that effectively manage inventory and align product offerings with consumer purchasing power will be best positioned to sustain both volume and profitability.