
Key Takeaways
May 2026 marked the first year-over-year SAAR increase of 2026, with the annualized sales rate rising to 16.1 million units. While this improvement signals positive momentum, affordability challenges and economic uncertainty continue to limit broader market growth.
Inventory conditions remain highly uneven across manufacturers, with some brands carrying more than 100 days’ supply while others remain inventory constrained. This divergence is likely to drive varying levels of incentive activity, pricing strategies, and sales performance throughout the remainder of the year.
Elevated vehicle prices, rising fuel costs, and high monthly payments continue to pressure consumers, increasing demand for affordable and fuel-efficient vehicles. Hybrid adoption strengthened in May, while manufacturers with excess inventory may face growing pressure to offer incentives to stimulate demand.
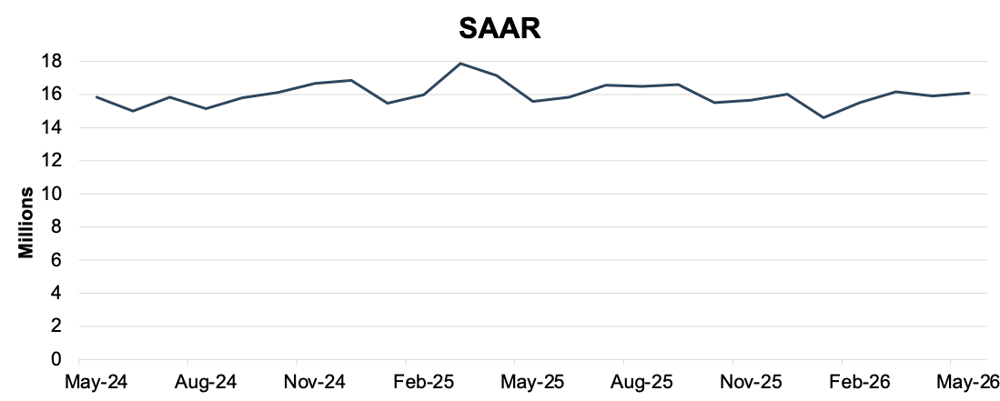
In May 2026, the U.S. auto industry experienced a modest improvement as the SAAR increased to 16.1 million units, up 1.0% from 15.9 million units in April 2026.
On a year-over-year basis, total sales increased 3.2% compared to May 2025 though there was one additional selling day this year. Demand continued to benefit from strong equity market performance, which supports purchasing activity among higher-income households. At the same time, elevated gasoline prices may have influenced consumer preferences and contributed to increased interest in hybrid and other fuel-efficient vehicles. Several headwinds continued to constrain broader sales growth, including elevated vehicle prices, high monthly payments, and weak consumer sentiment stemming from economic uncertainty and inflation concerns.
After four consecutive months of year-over-year declines in 2026, May marked the first year-over-year increase in the SAAR this year. As discussed last month, tariff-related distortions in 2025 affected year-over-year comparisons for April sales. Despite these distortions, analysts generally maintain a muted outlook for 2026. May's improvement provides an early indication of positive year-over-year momentum approximately halfway through what has otherwise been a relatively subdued year. SAAR has only eclipsed the 16 million mark twice in five tries in 2026 compared to seven in all of 2025.
Unadjusted Sales Data
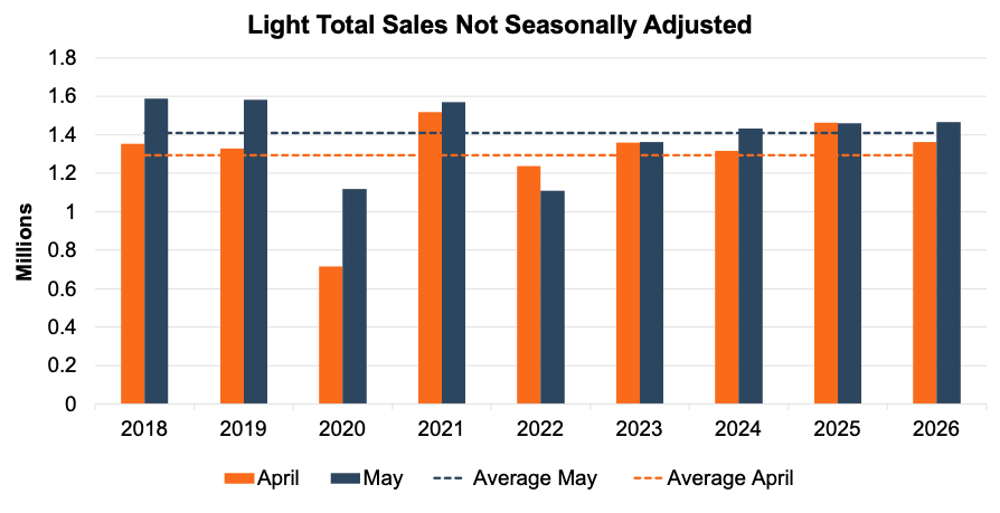
On an unadjusted basis, May 2026 industry sales reached approximately 1.47 million units, up 7.7% from 1.36 million units in April. This increase reflects the typical seasonal acceleration in demand that occurs ahead of the summer selling season. For comparison, unadjusted sales volumes increased 8.6% during the same periods in 2024. This trend did not hold in 2025 due to the aforementioned distortions associated with the tariff announcement. The only other time in the past decade that May failed to outperform April was 2022 when the chip shortage dropped the SAAR to below 13 million.
While the first half of 2025 was negatively affected by tariff-related disruptions, 2026 may be positioned for a stronger recovery if May's performance proves indicative of broader trends throughout the remainder of the year. As illustrated in the chart below, May sales have generally demonstrated the expected seasonal increase from April levels over the past several years. However, as noted in last month's report, the pace of recovery has moderated compared to prior years.
Days’ Supply
Cox Automotive indicates that national days’ supply increased to 76 at the start of May 2026, compared to 74 at the start of April. The main factors contributing to this increase are brands with 100+ days’ supply. Stellantis’ brands continue to be among the highest. Jeep’s days’ supply increased by 21% while Ram’s increased by 14%, and both brands have more than twice the industry average days’ supply. MINI and Mitsubishi moved above 100 days’ supply at the beginning of May; however, these increases are offset with tight supplies across Toyota, Lexus, and Honda.
While April is typically the start of the stronger spring selling season, total unsold vehicles increased 51% from a year ago, illustrating that the industry continues to struggle with anticipating demand. As we discussed last month, inventory is tighter for more affordable vehicles while the highest priced inventory ($50,000 and above) averages 90 days’ supply, a 5.5% increase from March.
The average transaction price of new vehicles was $48,510 in April, a 2.2% increase from March. Overall, this demonstrates a continued strain on consumers as prices on the lot and at the pump increase in tandem. Price increases are also contributing to the stronger demand (and shorter days’ supply) for more affordable vehicles.
See the chart below for a look at days’ supply in April 2026.
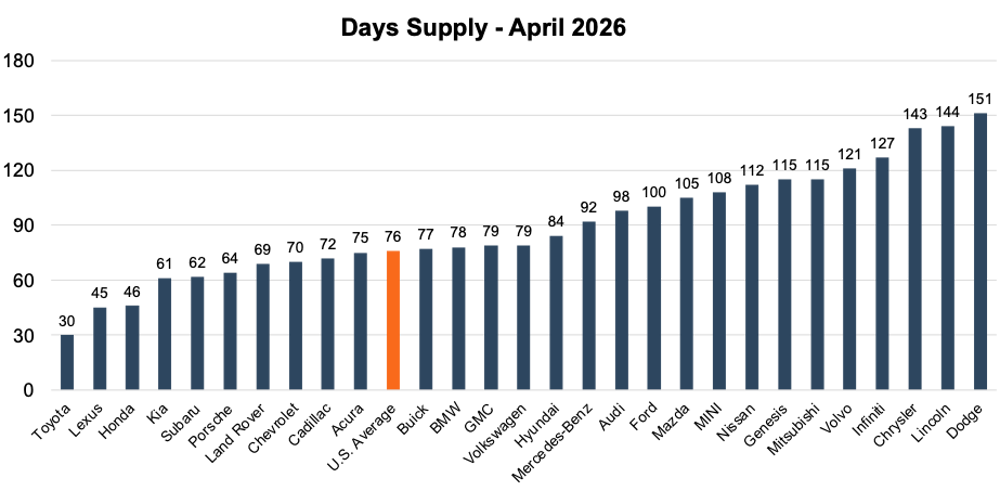
The persistent and widening gap between inventory-rich and inventory-constrained brands continues to demonstrate that inventory growth is not occurring uniformly across the market. Manufacturers with elevated inventory levels may face increasing pressure to utilize incentives, financing offers, and discounting strategies to reduce stock levels, particularly as affordability concerns continue to weigh on consumer demand. In contrast, brands with limited inventory remain better positioned to maintain pricing discipline, reinforcing the uneven competitive dynamics that currently characterize the new vehicle market.
The concentration of inventory growth among higher-priced vehicles also highlights a potential mismatch between production mix and consumer purchasing power. As transaction prices remain elevated and financing costs continue to pressure monthly payments, demand is increasingly concentrated in segments that offer greater affordability. If this trend persists, inventory accumulation among premium vehicles could continue to outpace sales, while lower-priced vehicles remain relatively constrained. This divergence would likely contribute to greater variation in incentive activity across manufacturers and vehicle segments throughout the remainder of the year.
Transaction Prices
According to JD Power, total new vehicle retail sales for May 2026 are expected to increase 5.8% year-over-year. New transaction prices remain relatively flat; however, the average interest rate on new vehicle loans is expected to fall 0.47 percentage points to 6.59%, which is the lowest May reading in two years. Despite tailwinds, monthly payments climbed to an average of $810 and the proportion of trade-ins with negative equity is up 2.9 percentage points. The percentage of loan terms greater than or equal to 84 months increased 0.8 percentage points from May 2025, potentially reflecting consumers’ need to utilize longer loan terms to fit higher price vehicles into their budgets.
From a mix perspective, hybrid powertrain sales increased by 1.6 percentage points to 16.3% of retail sales as fuel prices and increased availability of hybrids impacted consumer demand. EV demand softened while ICE powertrains remained flat as a percentage of total new vehicle sales in May.
Thomas King, the president of OEM solutions at JD Power, discussed the factors impacting incentive spending in May:
“May results reinforce the underlying strong demand for new vehicles, with total new-vehicle sales projected to rise 5.8% year over year to 1,490,900 units and the annualized selling rate climbing to 16.3 million units. However, as has been the case for the last three months, year-over-year comparisons are being clouded by what happened a year ago when consumers reacted to the perceived risk of higher prices from vehicle tariffs.
Sales in March and April of last year were inflated as consumers rushed to showrooms and ‘pulled ahead’ their purchases. But by May, however, the pull-ahead had turned into ‘payback’, with an estimated 63,000 sales pulled out of May into the preceding months. This payback effect makes for a flattering year-over-year comparison, but in no way diminishes the impressive sales pace achieved. Retail volume is on pace to expand 6.0% to 1,231,900 units, even as buyers continue to navigate elevated payments and persistent affordability headwinds.”
June 2026 Outlook
In June 2026, U.S. new vehicle sales are expected to remain near recent levels, with SAAR likely holding at or below the 16 million unit range as the market continues to balance resilient demand against ongoing affordability pressures. Consumer demand should continue to benefit from a healthy labor market, accumulated household wealth among higher-income buyers, and the availability of manufacturer incentives among brands carrying elevated inventory levels. However, higher fuel prices, elevated transaction prices, and financing costs are expected to remain significant headwinds, limiting the pool of consumers able to absorb higher monthly payments. As a result, sales activity is likely to remain concentrated among higher-income households and buyers seeking affordable or fuel-efficient vehicles.
Brand-level and even model-level inventory conditions are expected to become increasingly important in shaping competitive dynamics throughout the balance of the year. Brands with inventory levels well above the industry average may continue to increase incentive spending, particularly within higher-priced vehicle segments. Conversely, manufacturers with tighter inventories, including several Japanese brands, are likely to maintain stronger pricing discipline. This divergence in inventory positions should contribute to continued variation in transaction prices and sales performance across the industry. While overall inventory levels have improved considerably from pandemic-era lows, the uneven distribution of supply and persistent affordability challenges suggest that market growth will remain modest through the early summer months rather than accelerating materially.