
Key Takeaways
New-vehicle supply has continued to normalize, with average time on lot declining from 56 days in December 2025 to 50 days in June 2026, although retail demand remains pressured by affordability challenges.
Declining trade-in equity and rising negative equity are increasing the amount consumers must finance, creating headwinds for both vehicle sales and dealership inventory economics.
Stronger fleet activity has helped offset softer retail sales, while rising vehicle miles traveled continues to support more stable, higher-margin fixed operations.
As the automotive industry continues to navigate challenges in inventory management, affordability, and consumer demand, performance in the first half of 2026 offers insight into conditions that will determine performance in the second half of the year. In this post, we discuss several key metrics we have tracked in this space over the last several years: the supply of new vehicles, average trade-in equity values of used vehicles, fleet sales, and vehicle miles traveled.
Supply of New Vehicles
For the last several years, new vehicle supply has been one of the clearest indicators of the auto industry’s transition from scarcity to normalization. During the height of the inventory shortage, limited supply supported elevated transaction prices and strong dealer margins. As production and availability improved, vehicles began spending more time on dealer lots.
Average time on lot totaled 38 days in December 2023, 55 days in December 2024, 56 days in December 2025, and 50 days in June 2026.
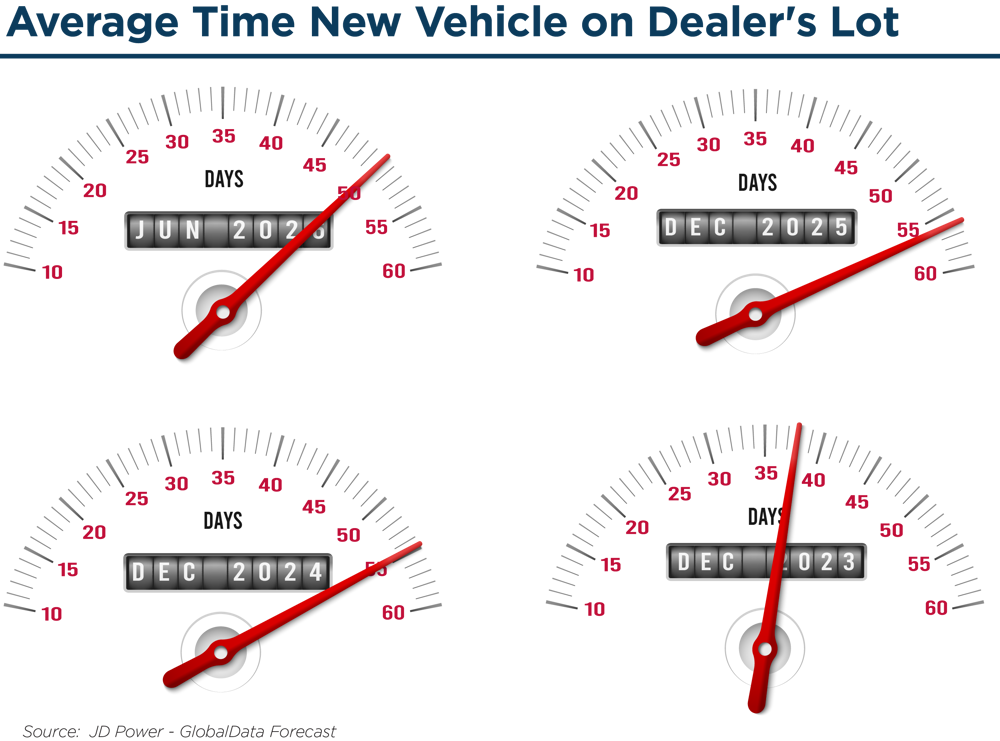
The June 2026 figure suggests that supply has moderated somewhat from year-end 2025 but remains meaningfully above the tightest points of the post-pandemic period. A 50-day average indicates that dealers generally have more inventory available than they did during the supply-constrained environment of 2021 and 2022, though the market still varies materially by brand, segment, and price point.
J.D. Power’s June 2026 forecast also reported that total new-vehicle sales were projected to reach 1,363,800 units for the month, up 3.6% year over year, while retail sales were projected to reach 1,114,700 units, up 2.7% year over year. However, first-half retail sales were projected to decline 4.1% from the first half of 2025, with rising fleet sales more than offsetting retail softness.
In short, the supply environment has improved, but the retail market remains mixed. Dealers have more vehicles to sell, but consumers are still contending with high monthly payments, elevated prices, and negative equity.
Average Trade-In Equity Used Vehicles
Used vehicle values have also normalized from the elevated levels experienced during the pandemic and immediate post-pandemic period. As used vehicle values cooled, average trade-in equity declined as well.
Average trade-in equity totaled $8,521 in December 2023, $8,189 in December 2024, and $7,903 in December 2025.
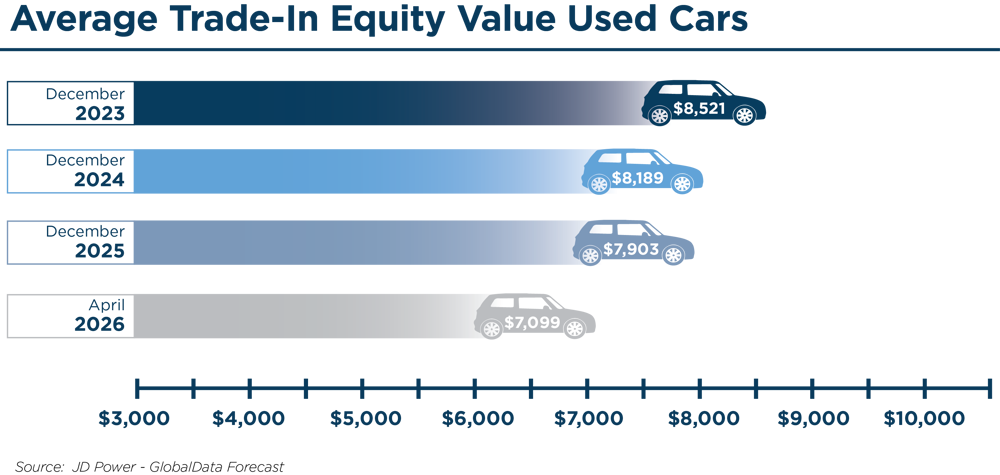
J.D. Power’s April 2026 forecast indicated that average trade-in equity was declining toward $7,099, down $660 from the prior-year period. The same release noted that 31.3% of vehicles carried negative equity, the highest level for April since 2020.
This decline in trade-in equity is significant because many consumers focus primarily on monthly payments. Lower trade-in equity gives buyers less value to apply toward their next purchase, which can increase the amount financed and pressure affordability. J.D. Power’s June 2026 forecast continued to identify lower trade-in equity as a key driver of higher monthly finance payments.
For dealers, lower trade-in equity can influence both new and used vehicle operations. On the new vehicle side, weaker equity may reduce consumers’ ability or willingness to transact. On the used vehicle side, fewer attractive trade-ins can affect acquisition costs, inventory mix, and used vehicle gross profit opportunities.
Fleet Sales
Fleet sales consist of sales to rental car companies, commercial users, and government agencies. These sales generally occur at lower margins than retail sales, but they help manufacturers and dealers move volume, support utilization of production capacity, and eventually feed service and parts departments as vehicles enter operation.
Fleet sales declined sharply during the pandemic as rental car companies reduced orders and, in many cases, sold portions of their existing fleets. As inventory availability improved and travel demand recovered, fleet sales became a more meaningful component of the industry’s volume recovery. Volumes flowing into fleet were also reduced as dealers prioritized vehicles being sold at retail due to low supply and high margins.
Monthly fleet sales totaled 227,660 units in December 2023, 222,616 units in December 2024, and 231,247 units in December 2025. For June 2026, J.D. Power projected total new-vehicle sales of 1,363,800 units and retail sales of 1,114,700 units, implying non-retail/fleet volume of 249,100 units.
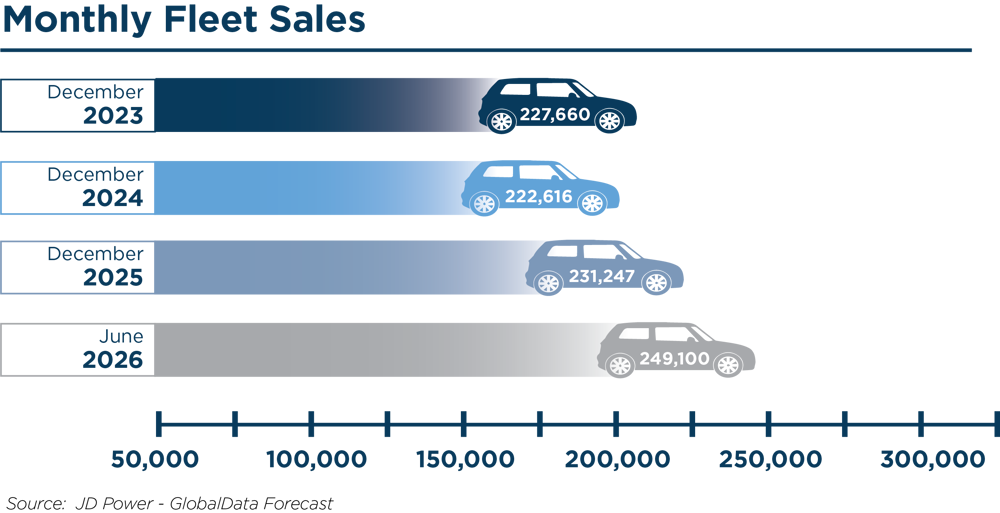
J.D. Power’s June 2026 forecast specifically noted that the projected first-half decline in retail sales was more than offset by rising sales to fleets. This distinction is important for dealers because total sales growth can mask weakness in consumer retail demand.
The June 2026 implied fleet figure of 249,100 units is above each of the three December comparison points shown in the updated chart. While fleet activity can support volume, it does not carry the same margin profile as retail sales. As a result, dealers should monitor not only total unit sales, but also the mix between retail and fleet activity.
Vehicle Miles Traveled
Vehicle miles traveled (“VMT”) remains an important indicator for the health of the automotive industry, as VMT supports higher utilization, maintenance needs, and replacement demand over time, all of which support demand for dealership services. VMT has been tracked since 1971, and a graphical view of the rolling 12-month average from 2006 through the present can be seen below.
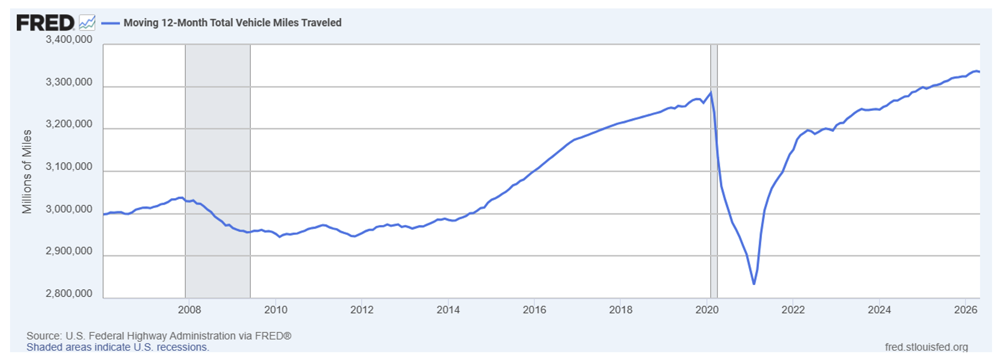
The prevailing trend over time is an overall increase in VMT as the population increases and Americans continue spending time on the road. Substantial declines in VMT typically coincide with economic recessions, as seen in 1974, the early 1980s, the Great Recession in 2008, and the pandemic in 2020. Except for notable economic events, VMT typically increases year over year.
In the first half of 2026, VMT displayed a consistently positive trend, rising above 2025 levels and reaching its peak in April of this year. According to data from the Federal Highway Administration’s Travel Volume Trends release, the moving 12-month total vehicle miles traveled series reached approximately 3.3 trillion miles in May 2026, up 0.9% from May 2025. Most notably, much of 2025 and the first half of 2026 mark increases from pre-pandemic levels, with the months leading up to March 2020 hovering in the 3.2 trillion-mile range. VMT did not recover to this level until 2023. April 2025 marked the first time VMT surpassed pre-pandemic highs, and the first half of 2026 indicates a promising trajectory as national VMT indicates stabilization back to pre-pandemic trends.
The first half of 2026 is a favorable sign for dealers’ fixed operations departments, which generally perform more defensively than vehicle sales departments during periods of economic uncertainty. When consumers face higher financing costs, affordability pressure, and broader macroeconomic concerns, they may keep existing vehicles longer and require increased service work. Fixed operations remain an important component of dealership value. Service and parts departments historically generate higher and more stable margins than vehicle sales departments, and VMT trends suggest continued support for this part of the dealership business model as we move through 2026.
Conclusion
The updated mid-year 2026 metrics show an industry that has normalized in some respects but remains far from static. Average time on lot has increased from the supply-constrained period, indicating improved availability, but June 2026 inventory turnover still does not suggest a fully oversupplied market. Average trade-in equity has continued to decline, adding to affordability challenges for consumers and contributing to higher monthly finance payments. Fleet sales have strengthened and helped offset some retail softness, while vehicle miles traveled remains supportive of fixed operations.
For auto dealers, the central question is no longer whether the industry can recover from pandemic-era disruption. The better question is where the industry settles after that recovery. Dealers that manage inventory carefully, protect margins, and continue to invest in fixed operations will be better positioned if retail demand remains uneven through the remainder of 2026.
For an understanding of how your dealership is performing and an indication of what your dealership is worth, contact a professional at Mercer Capital to conduct a valuation or analysis.