
Key Takeaways
October 2026 SAAR declined to 15.5 million units, while unadjusted sales increased modestly from September and a year earlier. Seasonal adjustments and selling-day differences explain the divergence, with underlying demand remaining relatively stable.
Inventory conditions vary widely by brand and price segment, with affordable vehicles remaining comparatively constrained and some manufacturers carrying elevated days’ supply. These differences may increase incentive pressure for inventory-heavy brands while supporting pricing discipline for brands with tighter supplies.
Elevated monthly payments, financing costs, and negative trade-in equity continue to constrain affordability despite rising incentives. These pressures are likely to limit sales growth heading into year-end, with November SAAR expected to remain near 15–16 million units.
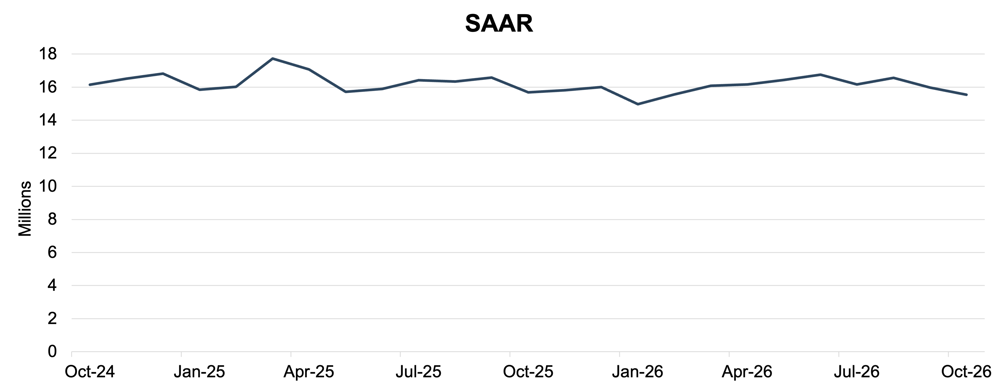
In October 2026, the U.S. auto industry experienced a modest decline as the seasonally adjusted annual rate (SAAR) decreased to 15.5 million units, down 2.7% from 16.0 million units in September. On a year-over-year basis, the SAAR declined 0.9% from October 2025. The October reading marked the second consecutive month at or below 16 million units, following a period of relatively stronger sales activity during the spring and summer. While the decline reflects moderating sales momentum, underlying demand remains relatively stable as consumers continue to navigate elevated vehicle prices, financing costs, and broader affordability concerns.
Despite the decline in SAAR, unadjusted sales volumes increased modestly from September and were higher than a year ago. This divergence reflects the influence of seasonal adjustments and selling-day differences rather than a significant change in underlying consumer demand. According to J.D. Power, October sales also benefited from a relatively favorable year-over-year comparison following the expiration of federal electric vehicle tax credits in September 2025, which pulled some purchases forward and reduced subsequent sales activity. Nevertheless, the continued pressure of higher monthly payments and financing costs suggests that meaningful sales growth may remain difficult to sustain through the end of the year.
Unadjusted Sales Data
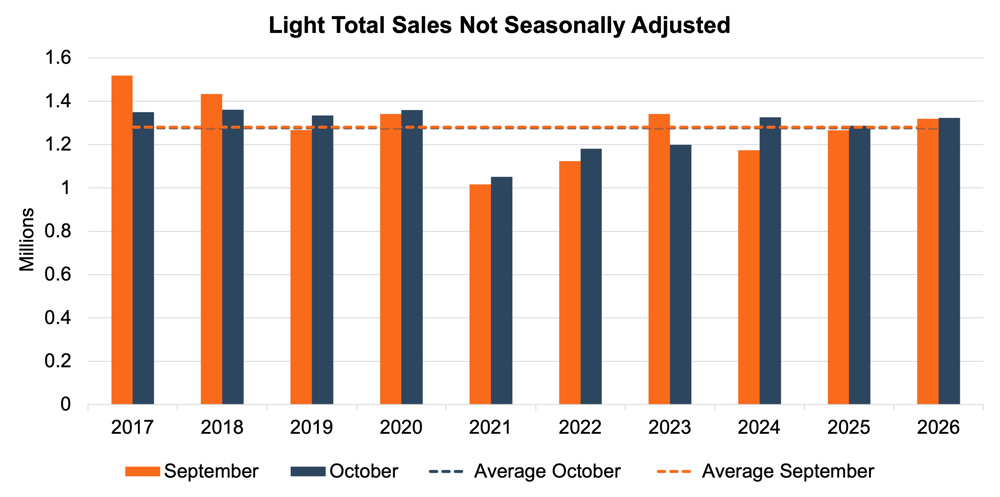
On an unadjusted basis, October 2026 industry sales reached approximately 1.32 million units, up 0.3% from 1.32 million units in September. On a year-over-year basis, sales increased 2.9% from approximately 1.29 million units in October 2025. Post-COVID, October sales have generally increased from September levels, although the magnitude of the increase has varied considerably. Over the past ten years, October sales exceeded September sales in seven years, with particularly strong increases occurring in 2024 and more modest gains in 2025 and 2026. Interestingly, two of the three years in which September outpaced October were pre-COVID (2017 and 2018) with the only other recent instance occurring in 2023 when a combination of the UAW strike, fewer selling days, and affordability headwinds caused the trend to reverse. October's 0.3% increase represents a relatively subdued seasonal improvement and suggests that consumer demand remains constrained compared to periods of stronger sales activity.
Days’ Supply
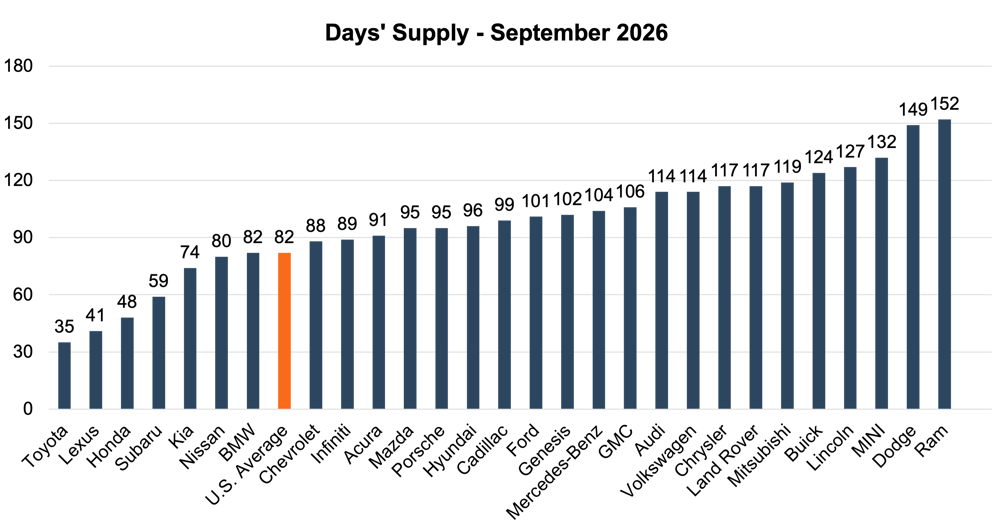
According to Cox Automotive, national days’ supply increased to 82 days in September 2026, compared to 75 days in August. Total new-vehicle inventory increased 4.5% to approximately 2.80 million units, reversing three consecutive months of inventory declines. Despite the increase, available inventory remained 1.9% below September 2025 when days’ supply was 87 days. The increase in inventory primarily reflected a moderation in sales activity, as the daily sales rate declined 3.4% from August. This means both factors (higher inventory, lower sales) contributed to the ~week added to days’ supply in the last month. These developments suggest that inventory conditions loosened heading into the fourth quarter, although the industry remains relatively tighter than a year ago.
Inventory conditions continue to vary substantially across manufacturers. Toyota maintained the lowest days’ supply at 35 days, followed by Lexus at 41 days and Honda at 48 days. In contrast, several domestic manufacturers continued to carry elevated inventory levels, including Dodge at 149 days and Ram at 152 days. Buick and GMC also remained above the industry average at 124 and 106 days, respectively.
Recent manufacturer earnings commentary suggests that inventory conditions are unlikely to normalize uniformly in the near term. Toyota continues to face production constraints, particularly for hybrid and body-on-frame vehicles and is investing in additional capacity to address these shortages. Conversely, Ford expects its inventory to return to its targeted range of 55 to 65 retail days’ supply by year-end 2026. Stellantis is also managing North American inventory levels, with management anticipating that December 2026 inventory will be comparable to December 2025.
The disparity between inventory-laden and inventory-constrained brands continues to create uneven competitive conditions, with manufacturers carrying excess inventory potentially facing greater pressure to utilize incentives and financing offers to support sales.
Inventory levels also remain uneven across vehicle price segments. Cox Automotive reported that vehicles priced below $30,000 averaged 63 days’ supply, compared to 111 days for vehicles priced above $80,000. The average new-vehicle listing price increased to $49,726 in September, up 1.4% from a year earlier. These figures highlight the continued concentration of consumer demand among more affordable vehicles, while higher-priced inventory remains comparatively elevated. Manufacturers with greater exposure to premium vehicle segments may continue to experience slower inventory turnover and increased incentive pressure as consumers prioritize affordability.
Transaction Prices
According to J.D. Power's October 2026 forecast, the average new-vehicle transaction price is expected to decrease slightly to $46,329. Despite relatively stable transaction prices, the average monthly payment is projected to increase 2.6% to an October record of $823. The average interest rate on new-vehicle loans is expected to increase 19 basis points year over year to 6.81%, the highest October reading since 2023. These financing conditions continue to create affordability challenges, particularly for consumers who are more sensitive to monthly payments than overall vehicle prices.
Negative equity on trade-ins remains another important factor affecting consumers' purchasing power. J.D. Power projects that approximately 29.6% of trade-ins will carry negative equity in October, an increase of 0.6 percentage points from a year earlier. Additionally, 13.3% of new-vehicle loans are expected to have terms of 84 months or longer, up 0.9 percentage points year over year. These trends suggest that consumers are increasingly relying on longer financing terms to manage elevated monthly payments, while negative equity reduces their ability to trade into newer vehicles without increasing the amount financed. This is indicative of the general theme we’ve seen with pressure on front-end grosses and increasing profitability on F&I.
Manufacturers continue to utilize incentives to offset these affordability pressures. Average incentive spending per vehicle is projected to reach $3,304 in October, a 13.1% increase from a year ago. Incentives as a percentage of manufacturer's suggested retail price are expected to increase to 6.3%, compared to 5.6% in October 2025. The increase in incentives reflects manufacturers' efforts to maintain sales volumes as affordability concerns persist and inventory conditions vary across brands.
From a powertrain perspective, hybrid vehicles continue to gain market share. Hybrid sales are expected to account for 18.6% of retail sales in October, an increase of 4.0 percentage points from a year ago. Meanwhile, electric vehicle sales are projected to represent 6.9% of retail sales, down 0.3 percentage points year over year.
November 2026 Outlook
In November 2026, U.S. new-vehicle sales are expected to remain relatively stable, with SAAR likely staying near the 15-16 million unit range as the market continues to balance resilient underlying demand against persistent affordability pressures. Inventory is no longer an industry-wide constraint though there are pockets of the market with lower availability. Manufacturer incentives and year-end promotional activity should provide some support for sales. However, elevated monthly payments, higher financing costs, and increasing negative equity among trade-in customers are likely to constrain demand, particularly among lower- and middle-income households. As a result, meaningful sales acceleration appears unlikely without an improvement in financing conditions or consumer purchasing power.
Brands carrying elevated days’ supply may increasingly rely on incentives and promotional financing to reduce inventory, particularly as manufacturers manage the transition to model-year 2027 vehicles. Conversely, brands with tighter inventories may be better positioned to maintain pricing discipline and limit discounting. Overall, the combination of stable but subdued sales activity, uneven inventory conditions, and persistent affordability concerns suggests that the automotive market will continue to experience modest growth prospects rather than a significant acceleration heading into year-end.