
Key Takeaways
U.S. light-vehicle sales moderated in September 2026, with the seasonally adjusted annual rate (SAAR) declining 3.5% month over month to 16.0 million units. Despite the decline, the industry continues to demonstrate relative stability, supported by replacement demand and resilient higher-income consumers.
New-vehicle inventory remains relatively disciplined, with August days’ supply declining to 73 days, although significant differences persist across manufacturers and price segments. Limited availability of lower-priced vehicles continues to create affordability challenges, while elevated inventories among certain brands may increase pressure for incentives and discounting.
Vehicle affordability remains the primary constraint on further sales growth with transaction prices rising, September monthly payments at record levels, and negative trade-in equity increasing.
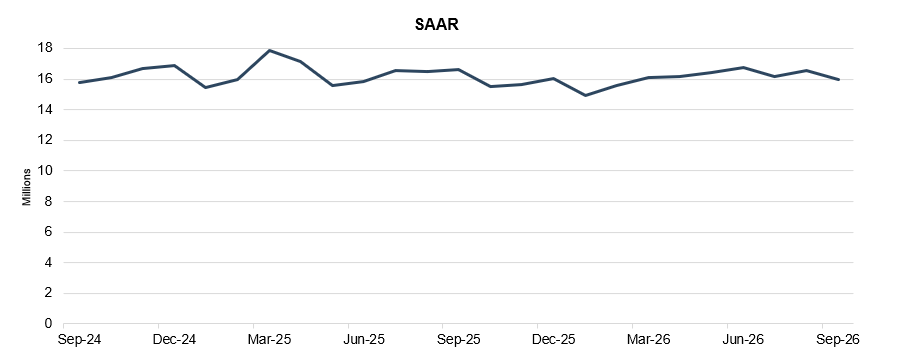
In September 2026, the U.S. auto industry experienced a modest decline as the SAAR decreased to 16.0 million units, down 3.5% from 16.6 million units in August 2026. On a year-over-year basis, the SAAR decreased 3.7% compared to September 2025. The decline represents a reversal from August’s stronger selling pace, though September remains generally consistent with the relatively narrow range that has characterized the market through much of 2026.
Year-over-year comparisons remain somewhat complicated by conditions in September 2025. Last year, consumers accelerated EV purchases ahead of the September 30 expiration of federal tax credits, which pulled demand forward into the month. Conversely, Labor Day fell within September’s reporting period this year after being counted in August 2025.
Despite September’s decline, the market continues to demonstrate relative stability. The SAAR has remained near or above 16 million for much of the year as replacement demand and relatively healthy higher-income consumers continue to support sales. However, affordability pressures, elevated monthly payments, and higher vehicle prices remain meaningful constraints on broader market growth.
This relative stability extends beyond 2026. Since January 2023, there have been only two months where the SAAR did not begin with either 15 or 16 million. Those two months were March and April 2025, as there was a pull-forward in demand related to the announcement of higher tariffs. The industry is firmly beyond the sub 15 million SAAR from mid-2021 to December 2022. It has still not, on a sustained basis, returned to the 17 million threshold that was commonplace from 2015 to 2019.
Unadjusted Sales Data
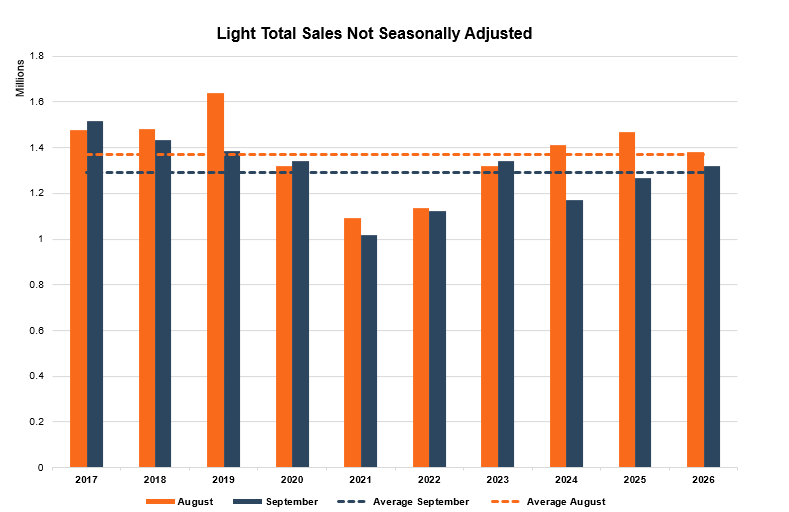
On an unadjusted basis, September 2026 industry sales reached approximately 1.32 million units, down 4.4% from approximately 1.38 million units in August. The decline is directionally consistent with typical seasonality, as September frequently experiences lower volumes following late-summer promotional activity and model-year changeovers.
Over the past decade, September sales have declined from August in seven of ten years. The magnitude of September’s decline has also varied considerably, ranging from modest decreases in relatively normal selling environments to substantially larger declines during periods affected by supply constraints or unusual calendar dynamics. The 4.4% decline in 2026 is therefore weaker than August but does not appear inconsistent with historical seasonality.
Unlike 2025, when the holiday selling weekend fell within August’s reporting period, Labor Day sales were included in September this year. While that calendar shift provided some support to September volumes, it was not enough to offset the broader month-over-month decline.
Overall, September sales suggest that demand remains stable but restrained. Consumers continue to purchase vehicles at a relatively healthy pace, though the industry has not demonstrated a sustained acceleration beyond the mid-16 million SAAR range.
Days’ Supply
Cox Automotive indicates that national days’ supply declined to 73 days in August 2026 as stronger sales continued to outpace inventory replenishment. Available new-vehicle inventory totaled approximately 2.68 million units, down 1.6% from July and 1.8% from a year earlier. August sales increased 3.3% from July, pushing days’ supply to its lowest level since April 2025.
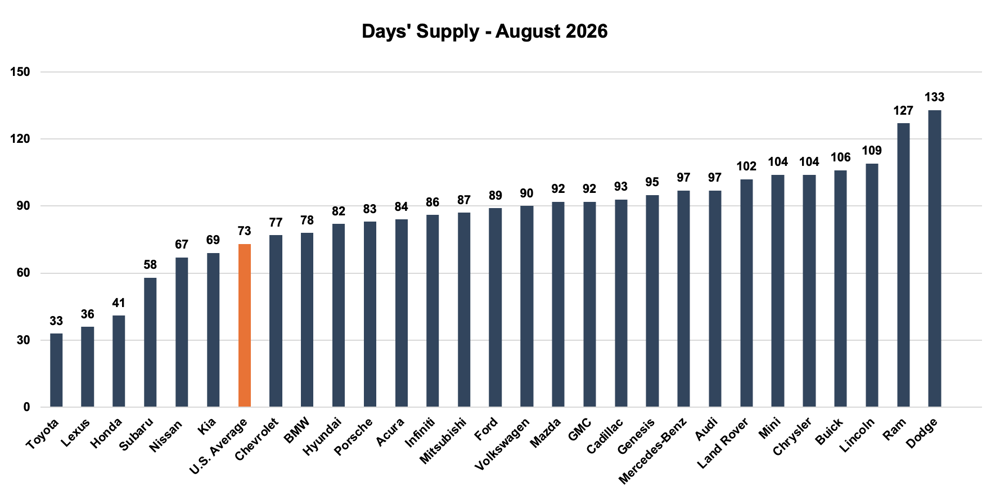
Inventory conditions continue to vary considerably by manufacturer. Toyota remained the tightest major brand at 33 days’ supply, followed by Lexus at 36 days and Honda at 41 days. At the other end of the distribution, Dodge carried 133 days’ supply and Ram carried 127 days, while Lincoln, Buick, Chrysler, MINI, and Land Rover also remained above 100 days. The industry average of 73 days therefore continues to mask substantial variation across brands.
The broader inventory picture also remains relatively disciplined though inventory conditions have normalized substantially from the shortages experienced earlier in the decade. However, this environment continues to support dealership profitability above historical levels while also limiting the need for broad-based discounting for manufacturers with tighter inventories.
Affordability remains an important component of the inventory picture. Cox reported that vehicles priced below $40,000 accounted for roughly one-third of available inventory in August, while vehicles priced at $30,000 or less carried only 54 days’ supply. Vehicles priced above $60,000, by comparison, carried more than 90 days’ supply. The difference illustrates the continued mismatch between where inventory is most available and where consumer demand is strongest.
While higher-priced vehicles may generate greater gross profit per unit, they also require more capital to carry and can produce higher absolute floor plan financing costs. Longer holding periods due to more limited demand further increase those carrying costs, which can erode the incremental gross profit associated with higher-priced inventory.
The average new-vehicle listing price increased 0.6% from July to $49,486 and was 1.9% higher than a year earlier. Despite stable overall supply, tighter inventories among more affordable vehicles suggest that pricing pressure is unlikely to ease evenly across the market.
Transaction Prices
According to JD Power, the average transaction price of a new vehicle increased 0.7% year over year to $45,915 in September 2026. At the same time, the average interest rate on new-vehicle loans is expected to decline four basis points to 6.66%, the lowest September reading since 2022. Despite the modest improvement in financing rates, average monthly payments increased 3.2% to $821, the highest September level on record.
Lower trade-in equity continues to contribute to higher monthly payments. The proportion of trade-ins with negative equity increased 0.3 percentage points to 29.4%. Consumers are also increasingly relying on longer financing terms to manage vehicle affordability, with 13.9% of loans carrying terms of 84 months or longer, up 2.0 percentage points from September 2025. Subprime penetration increased 2.2 percentage points to 11.2%.
These trends continue to demonstrate the structural affordability pressures facing consumers. Slightly lower financing rates have provided some relief, but rising transaction prices and weaker trade-in equity continue to offset that benefit. Longer financing terms can make monthly payments more manageable in the near term but may also increase the likelihood that consumers remain underwater on their loans when they return to the market.
From a mix perspective, hybrid powertrains continued to gain share. JD Power expects hybrids to account for 17.0% of retail sales in September, an increase of 3.5 percentage points from the prior year. EV share declined 6.5 percentage points to 7.9% following the elimination of federal EV tax credits, while strong hybrid demand continues despite tight availability for several popular models. The focus on EVs has made consumers warm up to hybrids, which are further supported by lower gas expenditures which is top of mind for budget-stretched consumers given elevated prices at the pump from war abroad.
Manufacturers also continued to increase incentive spending to support demand. Average incentive spending per vehicle is expected to reach approximately $3,574, up 7.3% from a year earlier, while incentives as a percentage of MSRP increased to 6.9%. Incentive strategies continue to vary substantially by powertrain. Spending on traditional ICE and hybrid vehicles is expected to increase 31.6% to $3,319 per unit, while EV incentive spending is expected to decline 21.7% to $8,829.
The combination of higher transaction prices, record September monthly payments, rising negative equity, and greater use of extended financing terms suggests affordability remains the primary constraint on further market growth. Demand continues to hold up, but consumers are increasingly dependent on incentives, financing structure, and available trade equity to make new vehicles fit within household budgets.
October 2026 OUTLOOK
October is expected to remain relatively stable, with U.S. new-vehicle sales likely to remain near the 16 million SAAR range. September’s decline follows one of the stronger monthly readings of 2026 and does not, by itself, suggest a material deterioration in underlying demand. Replacement demand, disciplined inventories, and continued purchasing activity among higher-income consumers should continue to support sales.
However, affordability remains the principal constraint on further growth. Average transaction prices continue to rise, monthly payments reached a September record, and nearly three in ten trade-ins carry negative equity. Although financing rates have eased modestly, JD Power cautioned that recent policy changes could place renewed upward pressure on borrowing costs in coming months. Futures markets are also pricing in the possibility of additional rate increases from the Fed through the end of the year. Inventory conditions should remain relatively balanced, although differences between manufacturers are likely to continue influencing pricing and incentive strategies. Brands with elevated days’ supply will likely rely more heavily on discounts and financing offers, while manufacturers with tighter inventories should retain greater pricing discipline and benefit from lower holding costs. The continued shortage of lower-priced inventory should also keep demand concentrated among more affordable models and hybrid powertrains.
Absent a meaningful change in macroeconomic conditions, the industry appears positioned to continue operating within the relatively narrow sales range that has characterized the past few years. September’s softer SAAR warrants monitoring, but inventory discipline and resilient underlying demand suggest that a significant contraction is unlikely in October. The interaction between financing costs, incentive activity, and consumer affordability will remain the most important factors to watch through the remainder of the year.