
Key Takeaways
Auto sales seasonality is durable and predictable.
Calendar-driven patterns have remained consistent despite economic and industry disruptions.Late spring and early summer best reflect true demand.
May and June require minimal adjustment, making them ideal for assessing underlying market strength.Promotions can distort short-term results.
Event-driven spikes, especially around Labor Day and year-end, often pull demand forward rather than signal lasting growth.
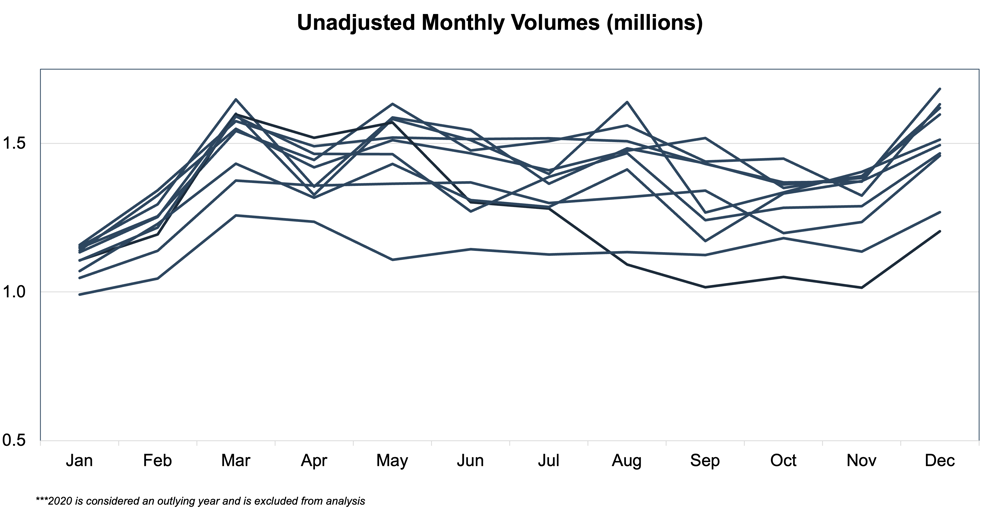
Auto retail has always been cyclical. While headlines often focus on the why (e.g. interest rates, inventory levels, or near-term economic uncertainty), seasonality remains one of the most consistent forces shaping monthly auto sales performance. Over the past decade, even amid supply chain disruptions and changing consumer behavior, the industry’s calendar-driven rhythm has remained remarkably durable. Graphing the unadjusted data shows the clear trends as seen below.
This cyclicality is normalized through the Seasonally Adjusted Annual Rate (SAAR); while any sort of metric can be seasonally adjusted, people in the auto industry understand SAAR as shorthand for the volume of vehicles (cars and light trucks) sold in the U.S. on an annualized basis. The SAAR normalizes monthly sales to account for predictable fluctuations in demand. Examining seasonal normalization from 2015 through 2025 offers insight into when demand is structurally weak, when it is temporarily elevated, and how those dynamics affect dealer operations throughout the year, as we’ll discuss in this blog. We recommend auto dealers share this blog with new sales staff learning the cadence of sales throughout the year.
January–February: Early-Year Weakness
January and February are consistently the weakest months in the auto sales calendar. Unadjusted sales volumes during this period are typically well below other months, requiring meaningful upward normalization. Over the past decade, the magnitude of these upward adjustments has gradually moderated. Early year SAAR revisions were most pronounced in the 2015–2017 period, while the 2021–2023 timeframe exhibited comparatively smaller upward adjustments, suggesting that although early year weakness remains structural, its severity has become less extreme than it was in the mid 2010s.
Several factors contribute to this early-year slowdown. Consumers often enter the year with strained household balance sheets following holiday spending, while winter weather limits showroom traffic across much of the country. Promotional activity also tends to be subdued after aggressive year-end incentive programs have already pulled demand forward into December. Compounding these pressures, credit card utilization and tighter auto credit conditions are more common in the first quarter, reinforcing the need for seasonal normalization.
For many dealers, this period places greater emphasis on expense control, fixed operations performance, and disciplined inventory management rather than volume-driven growth.
March–April: Spring Recovery Takes Hold
March and April mark a clear transition out of winter and into the spring selling season. SAAR data over the last ten years shows that positive adjustments during these months have narrowed over time. Adjustments were wider and more volatile prior to 2018, while the post 2020 period reflects a smoother and more consistent spring recovery relative to earlier years. While some seasonal normalization remains necessary, its magnitude declines as demand fundamentals begin to improve.
Tax refund season plays a central role in this recovery. As refunds are issued, consumers gain additional liquidity that supports down payments and financing flexibility. In 2025, the average federal tax refund exceeded $3,000 per filer, representing a meaningful seasonal injection of discretionary cash that historically coincides with rising showroom traffic and improving sales volumes. Improving weather conditions further support consumer engagement during this period.
By April, sales levels are often closer to underlying demand trends, making early spring an important checkpoint for evaluating the trajectory of the year.
May–June: A More Balanced Demand Environment
Late spring and early summer are among the most balanced periods in the auto sales calendar. Across the 2015–2025 period, SAAR adjustments during May and June have remained consistently small. Even during disruption heavy years such as 2020 and 2021, adjustments in these months stayed relatively contained, reinforcing this portion of the calendar as a stable baseline for evaluating underlying demand. Seasonal normalization during May and June is typically modest, reflecting demand that is generally aligned with annual expectations. Historically, the light vehicle total is adjusted downwards, with all periods in the last 10 years reflecting downward adjustments, except for June 2025.
Households often plan vehicle purchases ahead of summer travel and lifestyle needs, while Memorial Day promotions provide incremental activity without materially distorting demand. Labor market conditions during this period also tend to be stable, with steady employment levels and wage growth helping to anchor consumer spending.
Because sales during these months require relatively little adjustment, they often provide one of the clearest views of underlying market strength. Dealers frequently use this period to assess inventory positioning and operational efficiency heading into the second half of the year.
July–August: Strong Volumes, Greater Variability
July and August are traditionally strong sales months, though they introduce greater variability than the spring. Over the last decade, downward adjustments during these months have become slightly less extreme. The sharpest mid summer downward revisions occurred between 2016 and 2019, while post 2021 adjustments have been narrower, reflecting a gradual dampening of promotional volatility. As sales volumes rise, seasonal normalization increasingly moves in the opposite direction, reflecting demand that exceeds longer-term averages.
Summer promotions, elevated driving activity, and 4th of July incentives contribute to higher transaction volumes. Seasonal peaks in vehicle miles traveled and gasoline demand further support vehicle usage, increasing the perceived value of replacement or additional vehicle purchases. Anticipation of upcoming model-year transitions can also accelerate buying decisions.
While demand remains healthy, this period often rewards dealers who balance volume opportunities with margin discipline as promotional intensity increases.
September–October: Event-Driven Demand and Normalization
September is one of the most promotionally concentrated months of the year, anchored by Labor Day sales events and model-year closeouts. SAAR data indicates that while September continues to require sizable downward normalization, the magnitude of these adjustments has become more consistent over time. Prior to 2019, Labor Day related adjustments varied widely year to year, whereas the 2020–2024 period shows a tighter and more predictable range. Unadjusted sales volumes during this period frequently spike, requiring significant downward normalization to maintain comparability.
Manufacturers typically increase incentive spending around Labor Day as they work through aging inventory and transition to new model-year vehicles. This activity pulls demand forward and can temporarily inflate sales results. October generally follows with more normalized performance as promotional urgency subsides and buying patterns stabilize.
For dealers, these months often highlight the importance of inventory aging strategies and a clear understanding of incentive-driven demand versus sustainable sales levels.
November–December: Year-End Strength and Pull-Forward Demand
November and December consistently represent the strongest combined sales period of the year. Over the last ten years, SAAR adjustments during these months have remained persistently negative, though their magnitude has gradually compressed. The most extreme year end downward adjustments were concentrated in the 2015–2017 period, while post 2021 adjustments have been materially less severe, reflecting a more even distribution of year end demand compared to earlier in the decade. Seasonal normalization is most pronounced during these months, reflecting volumes that materially exceed annual averages.
Holiday promotions, year-end incentives, fleet purchasing cycles, and calendar-driven buying behavior all contribute to elevated demand. December, in particular, benefits from pull-forward activity as consumers and businesses complete purchases before year-end. This concentration of income and purchasing activity is reinforced by bonus payouts and tax-related considerations.
While critical to annual results, year-end strength often sets the stage for more subdued conditions in the following January, reinforcing the cyclical nature of the calendar.
Conclusion
Seasonality has not faded from the auto industry. From 2015 through 2025, sales patterns have followed a consistent calendar-driven rhythm, reflected in both unadjusted volumes and the degree of seasonal normalization applied throughout the year.
For dealers and dealer groups, seasonality itself is not the risk. The greater risk lies in misinterpreting short-term fluctuations or mistaking event-driven demand for structural change. Dealers who align inventory, staffing, and capital planning with these long-term patterns are better positioned to manage volatility, protect profitability, and make informed strategic decisions across the full automotive cycle.