Corporate Valuation, Oil & Gas
shutterstock_2364977019.jpg

April 25, 2017

How to Invest in PUDs in the Permian Basin without Paying for the Well

In previous posts, we have discussed the existence of royalty trusts & partnerships and their market pricing implications to royalty owners. Many of those trusts have a set number of wells generating royalty income at declining rates for multiple years to come. Viper Energy Partners LP (VNOM) is not a trust, but a partnership, solely focused on the Permian Basin with royalty interests in producing wells as well as proven undeveloped (PUD), probable and possible wells. Per their latest 10K filing:

Viper Energy Partners LP owns, acquires, and exploits oil and natural gas properties in North America. VNOM holds mineral interests covering an area of approximately 30,442 net acres in the Permian Basin, West Texas. As of December 31, 2015, its estimated proved oil and natural gas reserves consisted of 31,435 thousand barrels of crude oil equivalent. Viper Energy Partners GP LLC operates as the general partner of VNOM. VNOM was founded in 2013 and is based in Midland, Texas and is a subsidiary of Diamondback Energy, Inc (FANG).

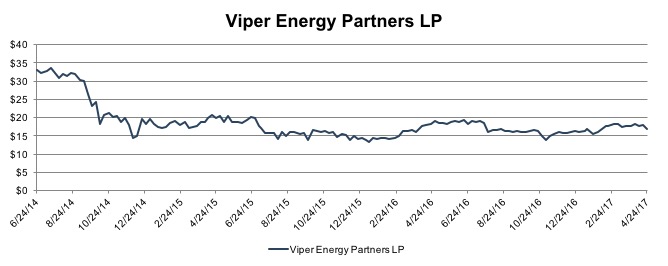
VNOM filed the initial public offering in June of 2014. Below is the entire trading history of VNOM:

Viper_201704 The following summarizes VNOM’s oil and gas assets in more detail per their latest 10K:
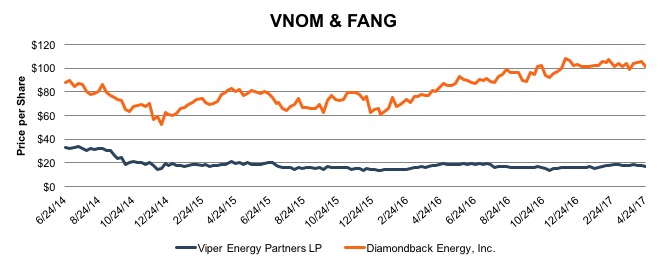
VNOM’s primarily owns mineral interests located in the Permian Basin.  As of December 31, 2016, VNOM owned mineral interests consisting of 107,568 gross acres in the Permian Basin.   In total, Diamondback operates approximately 41% of this acreage.  Details of VNOM’s acreage, as of December 31, 2016, are summarized below:
  • Total Producing Wells: 545 vertical wells and 190 horizontal wells
  • Net Production during 4Q2016: 7,919 Boe/d
  • Estimated Proved Reserves per Independent Petroleum Engineer: 31,435 Mboe
    • 58% classified as PDP reserves
    • Includes 23 horizontal wells in various stages of completion
    • 68% Oil / 18% NGL / 14% Natural Gas
    • PUD Reserves from 86 gross horizontal well locations
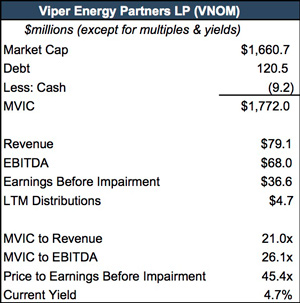
  • Revenue generated from these mineral interests has increased from $77.8 million in 2014 to $78.8 million in 2016
VNOM, on average (on an acreage weighted basis), receives a 5.95% royalty interest from their 107,568 gross acres and they do not have to pay for any additional capital or operating expenses. The actual royalty percentages vary from 1% to 25% depending on the relative amount of production from the various leases. For example, in the Spanish trail area of Midland County, VNOM receives an average (on acreage weighted basis) of 20.4% for the 16,551 gross acres they own.
Because Diamondback operates 41% of VNOM’s acreage, the performance of VNOM is closely tied to the activity of Diamondback Energy, Inc. (FANG).  Below is the price history of VNOM and FANG: vnom-fang_201704

Market Observations

There are approximately 21 oil and gas focused royalty trusts and partnerships publicly traded, as of the date of this article. As demonstrated below, VNOM is unique from the other 20 similar entities.

royalty-trusts_201704 
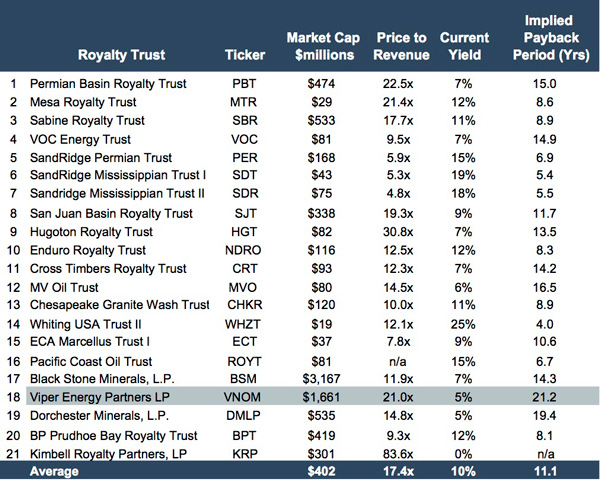
While many of these entities have assets located in the Permian Basin, the areas that make VNOM unique may include but are not limited to the following:
  1. Asset mix is primarily focused in the Permian Basin;
  2. Royalties are from producing wells;
  3. Future royalties are possible from PUD, probable and possible locations; and
  4. FANG is the operator of a significant portion of the VNOM’s acreage.
As a result, VNOM has the second largest market capitalization, the 4th highest price to revenue multiple, the lowest yield (of the entities that have a yield) and has the longest implied payback period at 21.2 years. Each of these data points indicates VNOM’s popularity in the market place among investors, FANG being the largest owning approximately 74% of the total shares outstanding of VNOM. For many of the above entities, opportunity to participate in PUD, Probable and Possible wells does not exist. Based upon our knowledge of the exploration and production industry, opportunities to participate in new wells, without having to pay for the capital expenditure of drilling the well, casing the well and fracking the well, appears to be an exciting and valuable option. The market appears to agree.viper-data-points_201704

Implications for Royalty Owners

In many respects, royalty owners can utilize publicly traded royalty trusts and partnerships to observe changes in investor behavior and get a feel for how much their royalty interests may be worth. Here are a few areas to consider for your specific situation to compare and contrast with royalty trusts and partnerships.

  • Set Number of Assets. Royalty trusts and partnerships typically have a set number of wells and producing assets after they are formed. Does your property have a fixed number of assets or will it grow? If new oil and gas wells are not being added to the property, then the oil and natural gas reserves will deplete as they age and produce.
  • Location. The royalty trusts and partnerships above have assets all over North America. Some are located in hot spots while others are not. Location drives investor appetite as operating costs and production levels, which vary by location, drive profitability in an industry that has zero control over the price of their product. This is a significant reason for the high transaction activity in the Permian Basin. Operators know they are able to make a profit through high production rates and low operating costs in Permian Basin even at $40 oil. Consider the investor activity, or lack there-of, in your area.
  • Price and Production. Now that the U.S. has significant recoverable oil and gas reserves and the ability to export unrefined crude world-wide, the U.S. can be considered a swing producer, a power which historically characterized OPEC. As a swing producer, price dictates the level of production the market will consume and production will increase or decrease relatively quickly to meet demand. In response to price changes, operators will increase or decrease production levels at will. Consider how your operator has behaved in various pricing environments and the operators of the Royalty Trusts.
In addition to the differences between your royalty assets and the royalty trusts and partnerships, consider the level of value indication provided by the royalty trusts and partnerships. The level of value is the publicly traded level of value verses the privately held royalty assets held by many land owners. Consider the following chart. lov-traditional-blue 
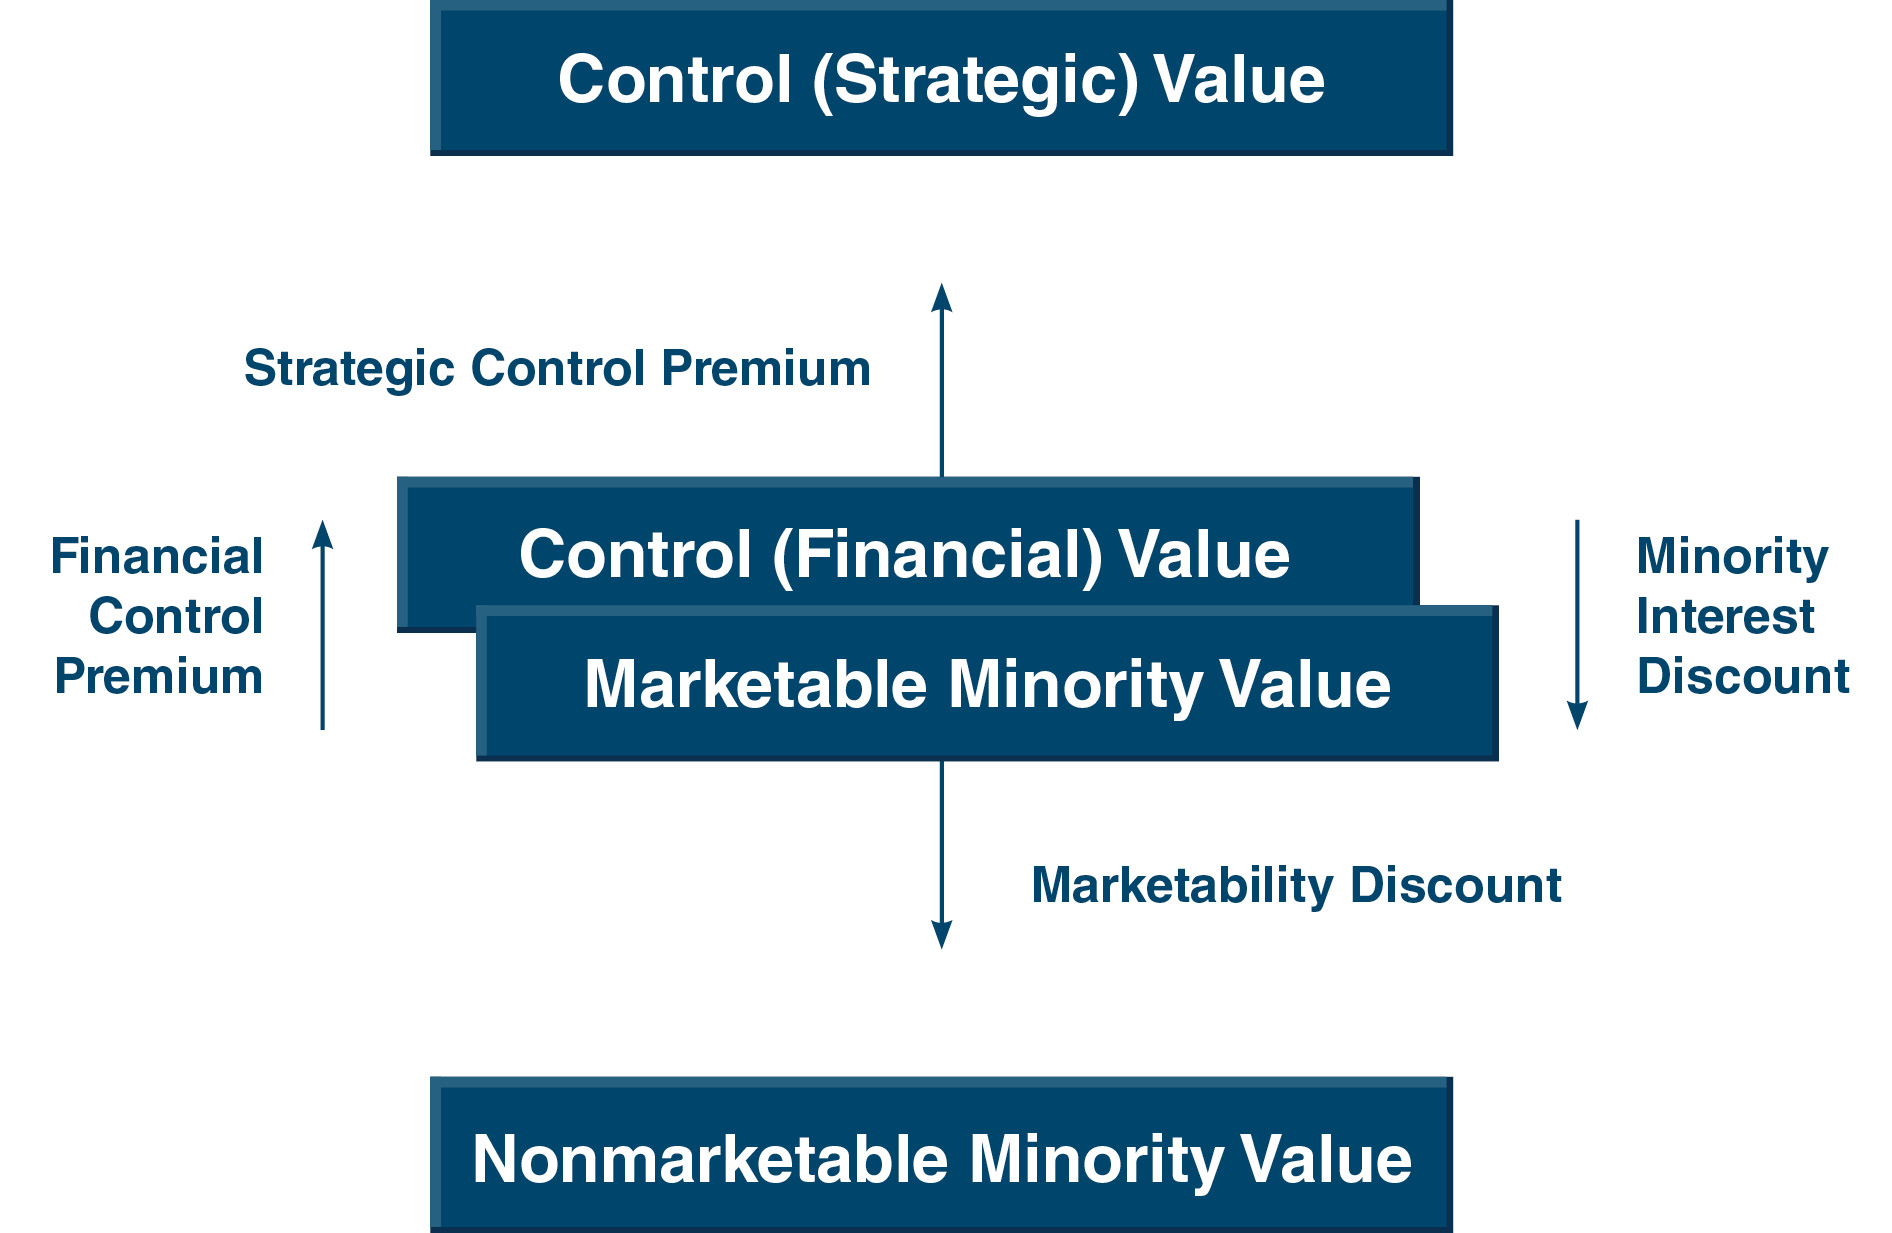
Chris Mercer explains,
The benchmark level is the marketable minority level of value, or the middle level in the chart above.  Conceptually, it represents the pricing of the equity of a public company with an active and freely trading market for its shares.  For a private company, it represents that same price as if there were a free and active market for its shares. The lowest level on the traditional levels of value chart is called the nonmarketable minority level of value.  This level represents the conceptual value of illiquid (i.e., nonmarketable) minority interests of private companies, or entities that lack active markets for their shares.

Publicly traded royalty trusts and partnership provide an indication of value at the marketable minority value level for minority interests in an entity with royalties as the primary asset. For royalty owners the value level can be a mixed bag. Many own the asset directly while others own equity interests in entities with royalties as their main assets. It is important to understand the value level comparability difference for your situation.

To move from the marketable minority value to the nonmarketable minority value level, simply apply a marketability discount. Stated a different way, apply a discount for not having the ability to quickly sell your asset and receive cash. Fully marketable assets, like those publicly traded, have the ability to exchange the asset for cash in approximately three days. All other assets which do not have this access lack marketability. Therefore, in order to build and find a market for the assets, a discount is typically required by potential investors.

We have assisted many clients with various valuation and cash flow issues regarding royalty interests.  Contact Mercer Capital to discuss your needs in confidence and learn more about how we can help you succeed.

Continue Reading

Defying the Cycle: Haynesville Production Strength in a Shifting Gas Market
Haynesville shale production defied broader market softness in 2025, leading major U.S. basins with double-digit year-over-year growth despite heightened volatility and sub-cycle drilling activity. Efficiency gains, DUC drawdowns, and Gulf Coast demand dynamics allowed operators to sustain output even as natural gas prices fluctuated sharply.
Haynesville Shale M&A Update: 2025 in Review
Key TakeawaysHaynesville remains a strategic LNG-linked basin. 2025 transactions emphasized long-duration natural gas exposure and proximity to Gulf Coast export infrastructure, reinforcing the basin’s importance in meeting global LNG demand.International utilities drove much of the activity. Japanese power and gas companies pursued direct upstream ownership, signaling a shift from traditional offtake agreements toward greater control over U.S. gas supply.M&A was selective but meaningful in scale and intent. While overall deal volume was limited, announced transactions and reported negotiations reflected deliberate, long-term positioning rather than opportunistic shale consolidation.OverviewM&A activity in the Haynesville Shale during 2025 was marked by strategic, LNG-linked transactions and renewed international investor interest in U.S. natural gas assets. While investors remained selective relative to prior shale upcycles, transactions that did occur reflected a clear pattern: buyers focused on long-duration gas exposure, scale, and proximity to Gulf Coast export markets rather than short-term development upside.Producers and capital providers increasingly refocused efforts on the Haynesville basin during the year, including raising capital to acquire both operating assets and mineral positions. This renewed attention followed a period of subdued transaction activity and underscored the basin’s continued relevance within global natural gas portfolios.Although the Haynesville did not experience the breadth of consolidation seen in some oil-weighted plays, the size, counterparties, and strategic motivations behind 2025 transactions reinforced the basin’s role as a long-term supply source for LNG-linked demand.Announced Upstream TransactionsTokyo Gas (TG Natural Resources) / ChevronIn April 2025, Tokyo Gas Co., through its U.S. joint venture TG Natural Resources, entered into an agreement to acquire a 70% interest in Chevron’s East Texas natural gas assets for $525 million. The assets include significant Haynesville exposure and were acquired through a combination of cash consideration and capital commitments.The transaction was characterized as part of Tokyo Gas’s broader strategy to secure long-term U.S. natural gas supply and expand its upstream footprint. The deal reflects a growing trend among international utilities to obtain direct exposure to U.S. shale gas through ownership interests rather than relying solely on long-term offtake contracts or third-party supply arrangements.From an M&A perspective, the transaction highlights continued willingness among major operators to monetize non-core or minority positions while retaining operational involvement, and it underscores the Haynesville’s attractiveness to buyers with a long-term, strategic view of gas demand.JERA / Williams & GEP Haynesville IIIn October 2025, JERA Co., Japan’s largest power generator, announced an agreement to acquire Haynesville shale gas production assets from Williams Companies and GEP Haynesville II, a joint venture between GeoSouthern Energy and Blackstone. The transaction was valued at approximately $1.5 billion.This acquisition marked JERA’s first direct investment in U.S. shale gas production, representing a notable expansion of the company’s upstream exposure and reinforcing JERA’s interest in securing supply from regions with strong connectivity to U.S. LNG export infrastructure.This transaction further illustrates the appeal of the Haynesville to international buyers seeking stable, scalable gas assets and highlights the role of upstream M&A as a tool for portfolio diversification among global utilities and energy companies.Reported Negotiations (Not Announced)Mitsubishi / Aethon Energy ManagementIn June 2025, Reuters reported that Mitsubishi Corp. was in discussions to acquire Aethon Energy Management, a privately held operator with substantial Haynesville production and midstream assets. The potential transaction was reported to be valued at approximately $8 billion, though Reuters emphasized that talks were ongoing and that no deal had been finalized at the time.While the transaction was not announced during 2025, the reported discussions were notable for both their scale and the identity of the potential buyer. Aethon has long been viewed as one of the largest private platforms in the Haynesville, and any transaction involving the company would represent a significant consolidation event within the basin.The reported talks underscored the depth of international interest in Haynesville-oriented platforms and highlighted the potential for large-scale transactions even in an otherwise measured M&A environment.ConclusionWhile overall deal volume remained selective, the transactions and reported negotiations in 2025 reflected sustained global interest in U.S. natural gas assets with long-term relevance. Collectively, the transactions and negotiations discussed above point to a Haynesville M&A landscape driven less by opportunistic consolidation and more by deliberate, long-term positioning. As global energy portfolios continue to evolve, the Haynesville basin remains a focal point for strategic investment, particularly for buyers seeking exposure tied to U.S. natural gas supply and LNG export linkages.
Mineral Aggregator Valuation Multiples Study Released-Data as of 06-11-2025
Mineral Aggregator Valuation Multiples Study Released

With Market Data as of June 11, 2025

Mercer Capital has thoughtfully analyzed the corporate and capital structures of the publicly traded mineral aggregators to derive meaningful indications of enterprise value. We have also calculated valuation multiples based on a variety of metrics, including distributions and reserves, as well as earnings and production on both a historical and forward-looking basis.

Cart

Your cart is empty