Master Limited Partnerships (MLPs) are publicly traded partnerships, which reap the tax benefits of a partnership and the liquidity benefits of a public company. There are many tax benefits to an MLP. Unlike public companies, MLPs are taxed only at the unitholder level. Distributions to unitholders are tax deferred, if the Partnership distribution is greater than Partnership income. And, units can be passed down to successors at a basis of fair market value, which means that the capital gains tax is not passed down along with the unit. There are also some serious tax implications of the MLP structure. For example, when an MLP’s debt is forgiven, the amount cancelled is treated as income and is taxed at the unitholder level. However, there is generally not a cash distribution which accompanies this tax payment.
History of MLPs
Apache Oil established the first MLP in 1981 and had such great success with the structure that real estate investors, restaurants, hotels, and NBA teams restructured to become MLPs. In 1987, Congress revamped the tax code specifying that in order to be an MLP at least 90% of a company’s income must be generated from “qualified sources”. Qualified sources include, “the exploration, development, mining or production, processing, refining, transportation (including pipelines transporting gas, oil, or products thereof), or the marketing of any mineral or natural resource (including fertilizer, geothermal energy, and timber).” In 2008, Congress expanded this to include carbon dioxide, biofuels, and other alternative fuels.
E&P companies are sensitive to swings in commodity prices and do not have stable enough cash flows to sustain the distribution requirement of MLPs. Often times E&P companies spun off their midstream assets into MLPs because midstream operations provide stable cash flows and have the ability to reliably make distributions. Thus the majority of MLPs are involved in the midstream oil and gas sector. Recently, however, the stability of midstream cash flows has been called into question.
Midstream companies have long term contracts called take-or-pay contracts which require producers to pay midstream companies even if they are not currently using their gathering assets. It was always assumed that these contracts were inviolate; however, the recent turmoil in the oil and gas market, which led to a multitude of bankruptcies in the E&P sector, caused these contracts to be called into question in bankruptcy court proceedings. During the bankruptcy process, producers can request that certain contracts be rejected. If the midstream contracts are thought to be vastly different from market value then the producer can request the judge consider the rejection of midstream contracts. We saw this in March of 2015 when a New York judge ruled that Sabine Oil and Gas Corp., which was going through bankruptcy proceedings, could reject contracts it was in with midstream companies. This uncertainty caused the price of MLPs to fall as investors began to question the immunity of their cash flows. From December 2014 to December 2015 the price of MLPs on average fell by 25%.
MLPs have two classes of Partners: General Partners, who are responsible for managing day to day operations and receive compensation for doing so, and Limited Partners (called unitholders) who are investors in the Partnership and receive periodic distributions. Unlike a public company which is governed by a board, a MLP is generally managed by a general partner. Legally, the general partner has no fiduciary duty to the unitholders, but mostly their interests align.
MLPs payout a large portion of cash flows (generally 80% to 100%) to their unitholders. Distributions are based on each MLP’s partnership agreement and usually minimum quarterly distributions are written into the MLP’s partnership agreements. The General Partner typically owns a 2% equity interest along with incentive distribution rights (IDRs). Incentive distribution rights give a general partner an increasing share in the incremental distributable cash flow of the Partnership. IDRs are meant to incentivize the GP to increase distributions for the limited partners.
Valuing an MLP
There are approximately 140 MLPs and in 2013 over 50% of MLPs operated in the midstream and downstream oil and gas sector. While each Company is unique the guideline approach can commonly be used to value MLPs in the oil and gas sector. A price to earnings multiple however is uninformative when valuing an MLP. MLPs generally have a lot of fixed assets on the balance sheet that result in high depreciation expenses charged to earnings. Thus earnings are not a good indicator of value. Instead we turn to companies’ distribution history.
Several MLPs and their key financials are summarized in the chart below. MLPs generally pique the interest of investors looking for income generating investments, demonstrated by the dividend yield. But there are three other measures that should be used to understand the value and inherent risk of an MLP: (1) Distribution Coverage Ratio (DCR), (2) Price / Distributable Cash Flow (P / DCF), and (3) Debt / EBITDA.
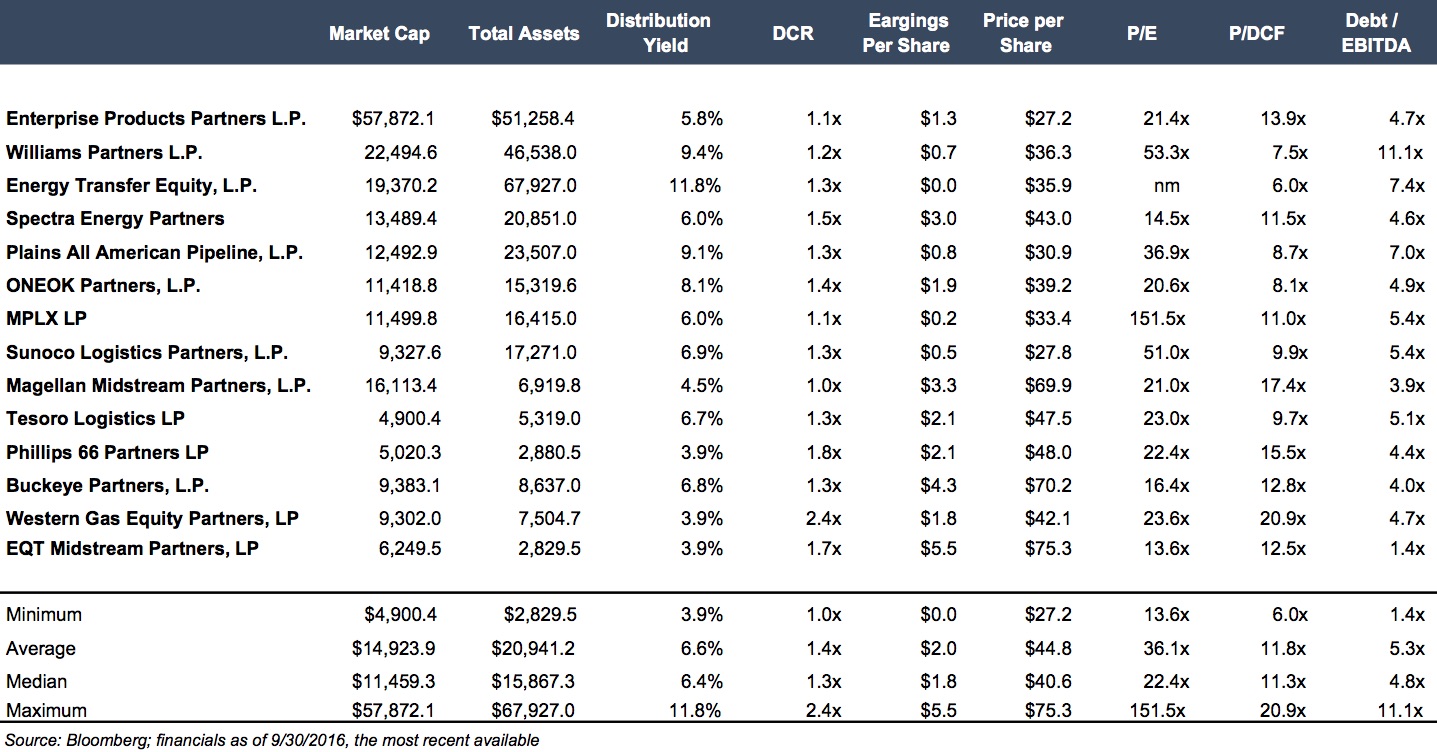
A MLP’s distribution coverage ratio (DCR) measures the sustainability of current distributions. A DCR of 1.0 indicates that an MLP is distributing all available cash flow and a DCR of greater than 1.0 indicates that a Partnership is retaining some cash. A DCR of less than 1.0 is not sustainable. All of the MLPs above have sustainable levels of distributions but Magellan Midstream’s (MMP) DCR of 1.0 does beg for further analysis as they are paying out all available cash flow.
Instead of evaluating Price / Earnings multiples, we analyze Price / Distributable Cash Flow for MLPs. Generally a P / DCR of more than 15x or 16x is considered high. However, if the MLP has consistently grown distributions then the partnership may be worth the premium. Magellan Midstream was trading at 17.4x distributable cash flow, which is on the higher end of the range shown above. However, MMP has increased its quarterly distribution 59 times since it IPO-ed in 2001. This trend of an increasing yield merits a higher P / DCF multiple.
The Debt to EBITDA multiple can give us further insight into the company’s risk position. Since MLPs must pay out the majority of their cash flows as distributions to unitholders, in order to fund capital expenditures and acquisitions an MLP must take on debt. Magellan has a debt to EBITDA ration of 3.9x. Generally a debt to EBIDTA multiple above 5x would be cause for concern, but Debt / EBITDA multiples for MLPs have trended upwards over the last four years. In 2013 the median Debt / EBITDA multiple was 3.8x but increased to 5.4x by 2015. Over the past three years the median EBITDA of our group increased by a compound annual rate of 8% while debt increased at a rate of 16% showing that the industry as a whole has become more leveraged.
Mercer Capital’s oil and gas valuations have been reviewed and relied on by buyers and sellers and Big 4 Auditors. These oil and gas related valuations have been utilized to support valuations for IRS Estate and Gift Tax, GAAP accounting, and litigation purposes. We have performed oil and gas valuations throughout the United States and in foreign countries. Contact a Mercer Capital professional today to discuss your valuation needs in confidence.


