Deal Details 1
On January 16, 2017, Noble Energy, Inc. (NBL) announced the acquisition of all Clayton Williams Energy (CWEI) equity for approximately $2.7 billion in NBL stock and cash. Noble Energy is a global independent oil and gas exploration and production company. Over 50% of their sales volume is generated from domestic onshore production. The Company focuses onshore domestic operations in the DJ, Delaware, and Eagle Ford Basins and the Marcellus Shale. The Company’s acquisition of CWEI demonstrates their effort to accelerate high margin growth by focusing capital in productive regions such as the Permian Basin.
Shareholders of CWEI will receive approximately $34.75/share in cash and 2.7874 NBL common shares for each share of CWEI stock. Based on CWEI disclosures, NBL will assume control of 330,000 net acres in the Permian Basin and Giddings area of the Eagle Ford which include 13.6 MBOE of net daily production. The 170,000 net acres in the Permian are located in Ward and Reeves County. Approximately 72% of the current production is crude oil. The transaction indicated a 48% premium to the publicly traded equity value for CWEI. Noble Energy was willing to pay a premium for the CWEI because the CWEI’s acreage was continuous to Noble’s which provides Noble with potentially cost saving synergies.
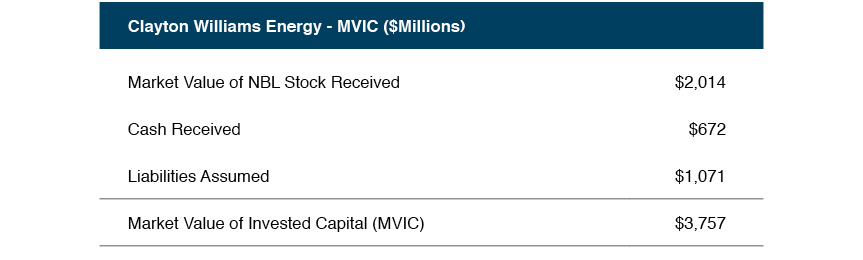
Based upon the consideration given by NBL, here is the implied market value of invested capital (MVIC) for CWEI:
 A summary of CWEI’s book value balance sheet is shown below.2
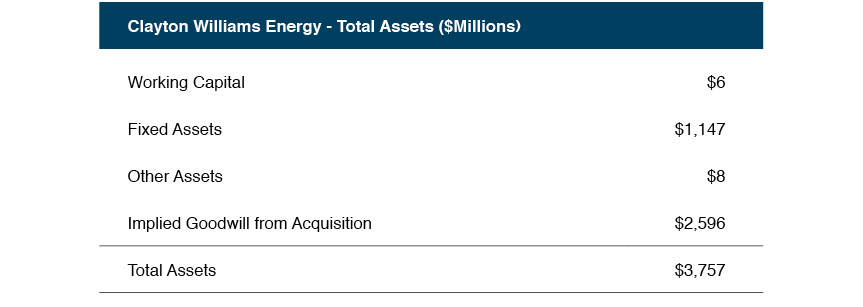 Before venturing into our approach to the allocation, we have compared pricing multiples of the CWEI acquisition and other oil and gas public companies. At the time of the transaction, CWEI owned acreage rights in one of the most popular domestic resource plays, the Delaware Basin. The chart below shows the implied pricing metrics for CWEI versus selected transactions involving companies with a significant presence in the Permian Basin. Noble Energy’s pricing multiples are also presented to show size comparisons.
 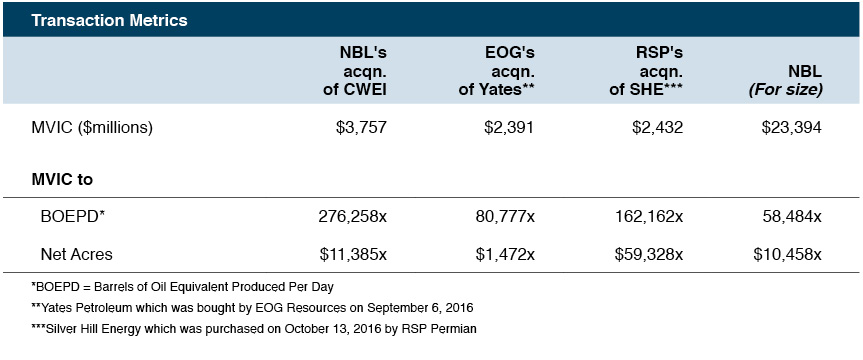 Observations:
Noble Energy’s purchase of CWEI was one of the largest acquisitions in the Permian basin over the last few years.
Based on BOE per day production, CWEI was priced higher than Yates and SHE, as both companies were producing more than CWEI.
Based upon net acres acquired, the CWEI transaction was priced in the middle of Yates and SHE and slightly above its’ suitor NBL.
While this acquisition appears to be priced high on the BOEPD metric, the significant amount of acreage acquired by NBL indicates a net acre multiple that is consistent with other transactions.
Assets Purchased
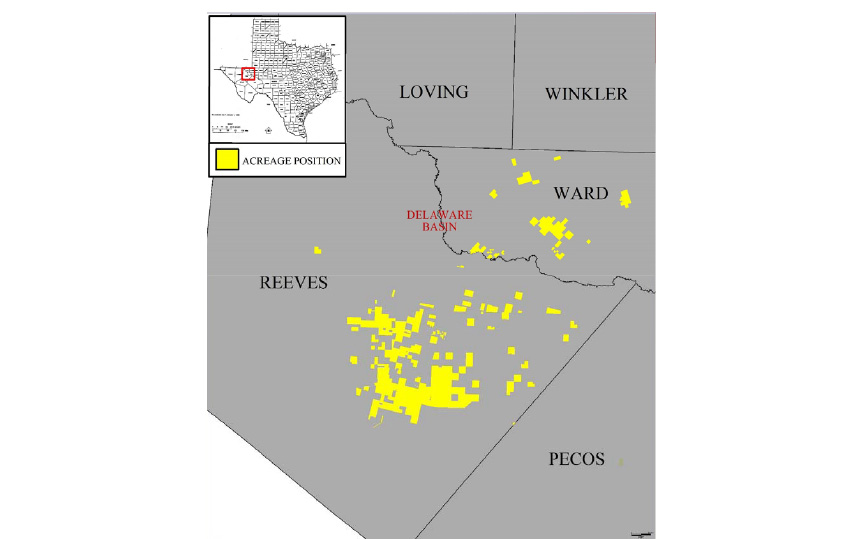
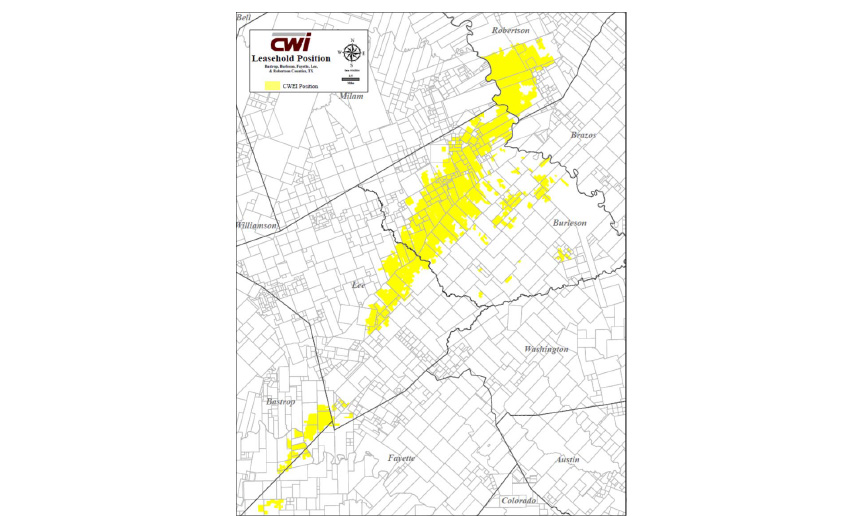
The following maps, disclosed by CWEI, shows the acreage positions within each of the core resource plays, the Permian Basin and the Eagle Ford. The highlighted acquired assets include:
65,000 net acres in Reeves County, Texas (Permian Basin map below) with over 100 wells producing or soon to be producing. A target pay zone of 3,500 feet wide (between the depths of 8,000 ft to 11,500 ft,) and 1 rig actively drilling in the area.
Eagle Ford shale property includes 160,000 net acreage positions, 40 completed wells, a demonstrated and repeatable drilling program and new well costs of $4m per well.
 Chairman, President and CEO of NBL David Stover had the following comments on their acquisition:
"This transaction brings all the key elements we value: excellent rock quality, a large contiguous acreage position adjacent to our own and robust midstream opportunities, reinforcing the Delaware Basin as a long-term value and growth driver for Noble Energy."
"This combination creates the industry's second-largest Southern Delaware Basin acreage position and provides more than 4,200 drilling locations on approximately 120,000 net acres, with over 2 billion barrels of oil equivalent in net unrisked resource."
Earlier, we displayed the high level categories for an allocation of purchase price. Two of these categories are oil and gas related assets: (1) the fixed assets on the balance sheet; and (2) the implied goodwill value. Each of these is inter-related as a majority of the fixed assets are related to the exploration and production of oil and gas resources. Based upon our experience, much of the “implied goodwill” is related to the present value of future benefits of the production of oil and gas. The valuation for current production and proved developed reserves can be straight forward. CWEI more than likely prepared a reserve report which would aid in the valuation of the currently producing wells and the remaining proved reserves. However, the valuation gap between the proved developed reserves and the remaining proved undeveloped, probable and possible reserves or acreage value can be detailed, tedious, and complex. The historically low oil and gas price environment and financial tension within the industry creates a complicated market place for using market transactions as indications of value.
More information is needed to drill down into the specifics and valuation of each of the acquired oil and gas assets. Interested parties may want to consider the following information areas:
Reserve Reports. Specifically, it is important to understand the amount of acreage in each of the maps above that have been drilled versus what areas are included in the drilling plan, PV 10 indications and price deck assumptions;
Drilling plan and synergistic efficiencies. Rarely are specific drilling plans disclosed publicly, but they can be observed at a high level in the reserve report, as well as certain expense assumptions that provide company specific expense profiles for operating and capital expenditures for new wells.
NBL’s acquisition of CWEI ranks as a top E&P transactions of 2017, not only because it is one of the first transactions of the year, but compared to 2016, it ranks in the top five in size. Based upon our experience involving public and private companies, we understand that pricing for proven undeveloped, probable and possible reserves have dropped significantly in the previous year, by upwards of 90% in some cases. In addition, due to the nature of the current oil and gas environment, we understand that historical transactions may have little comparability to transactions today and any comparison depends upon the details and assumptions of each transaction. Mercer Capital has significant experience valuing assets and companies in the energy industry, primarily oil and gas, bio fuels and other minerals. Our oil and gas valuations have been reviewed and relied on by buyers and sellers and Big 4 Auditors. These oil and gas related valuations have been utilized to support valuations for IRS Estate and Gift Tax, GAAP accounting, and litigation purposes. We have performed oil and gas valuations and associated oil and gas reserves domestically throughout the United States and in foreign countries. Contact a Mercer Capital professional today to discuss your valuation needs in confidence.
End Notes
1 Clayton Williams Energy, September 22, 2016 Johnson Rice Energy Conference Presentation 2 As of September 30, 2016 per S&P Capital IQ

