 The Wall Street Journal recently published an encouraging article, “Oil Prices Flash a Buy Signal,” explaining that futures contracts are trending to a flat curve. Ever since the fall in crude oil prices in mid-2014, the market has remained in contango, signaling that the industry still faced rough times ahead. The current movement away from contango and toward backwardation is the first positive forward price estimate since 2014 and oil and gas investors are taking note. Before we jump into the details, let’s review the possible commodity market conditions.
What is Contango/ Backwardation?
Contango
F < E(S)
A contango market simply means that the futures contracts are trading at a premium to the spot price. Contango is the result of an “oversupplied market with abundant inventories.” For example, if crude oil is trading at $45 per barrel right now, and the six month contract is trading at $50, the market is said to be in contango. For the last three years, we have been operating in a contango market.
Backwardation
F > E(S)
Backwardation (or normal backwardation), on the other hand, is a symptom of an “undersupplied market with tight stockpiles.” If crude oil is trading at $45 per barrel right now, and the six month contract is trading at $40 per barrel, then that market would be said to be in a backwardation.
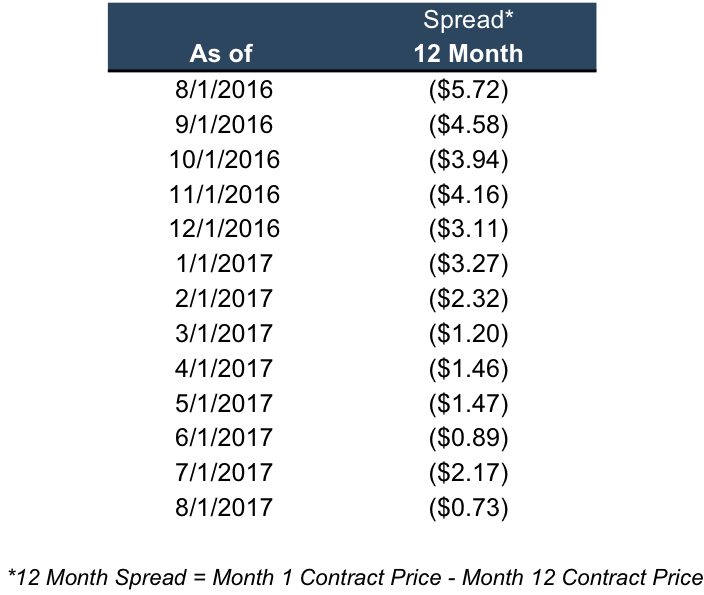
It currently appears that pricing in the future contracts are moving closer to backwardation. The table below shows the future contract spread for the previous 13 months. The most recent data returns the narrowest spread since 2014 of ($0.73) compared to one year ago when the market had a wider contango spread of ($5.72).
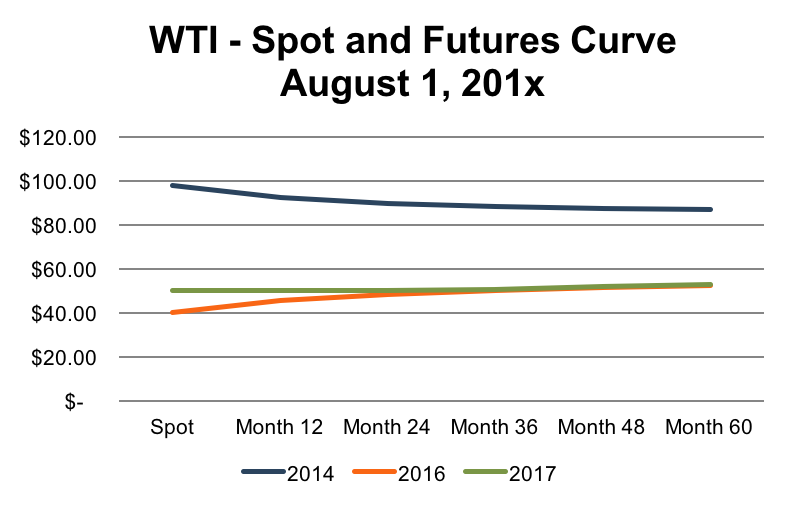
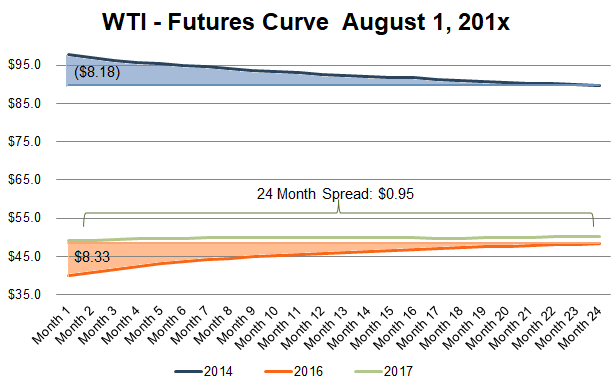
 To break down the significant change over the previous three years, the chart below shows the 2014, 2016, and 2017 WTI futures curve for 24 months and the spread between Month 1 and Month 24. Positive spread indicates backwardation, while negative spread indicates contango.
 What is not clear, however, is the cause for the flattening curve. Is the cause on the supply side or demand side?
Barron’s recently highlighted the improved economic outlook for the industry. Their investment strategists pointed at two factors which are helping keep crude oil prices steady and may lead to increases in the future. First, inventories are lower at this year than they were last year at this time. Second, the value of the dollar is falling which could cause the price of crude to rise.
However, their optimism was accompanied by cautiousness. After Pioneer’s recent losses, we are reminded that even the Permian Basin is not protected from difficulties. Many investors have started to worry about the fate of the Permian Basin. Some companies have reported that they are producing more natural gas and natural gas liquids than previously expected and as oil wells age, they tend to produce more natural gas.
What is not clear, however, is the cause for the flattening curve. Is the cause on the supply side or demand side?
Barron’s recently highlighted the improved economic outlook for the industry. Their investment strategists pointed at two factors which are helping keep crude oil prices steady and may lead to increases in the future. First, inventories are lower at this year than they were last year at this time. Second, the value of the dollar is falling which could cause the price of crude to rise.
However, their optimism was accompanied by cautiousness. After Pioneer’s recent losses, we are reminded that even the Permian Basin is not protected from difficulties. Many investors have started to worry about the fate of the Permian Basin. Some companies have reported that they are producing more natural gas and natural gas liquids than previously expected and as oil wells age, they tend to produce more natural gas.
Conclusion
The movement in the future spread away from a contango environment and toward backwardation is positive from a supply and demand perspective. Expectations are a backwardation environment will move crude oil prices higher. However, the exact cause of this change is unknown. While this shift is good news for the industry, company specific risk and investor's fickle attitudes create volatile equity markets.
Mercer Capital has significant experience valuing assets and companies in the oil and gas industry, primarily oil and gas, bio fuels, and other minerals. Our oil and gas valuations have been reviewed and relied on by buyers and sellers and Big 4 auditors. These oil and gas-related valuations have been utilized to support valuations for IRS estate and gift tax, GAAP accounting, and litigation purposes. We have performed oil and gas valuations and associated oil and gas reserves domestically throughout the United States and in foreign countries. Contact a Mercer Capital professional today to discuss your valuation needs in confidence.

