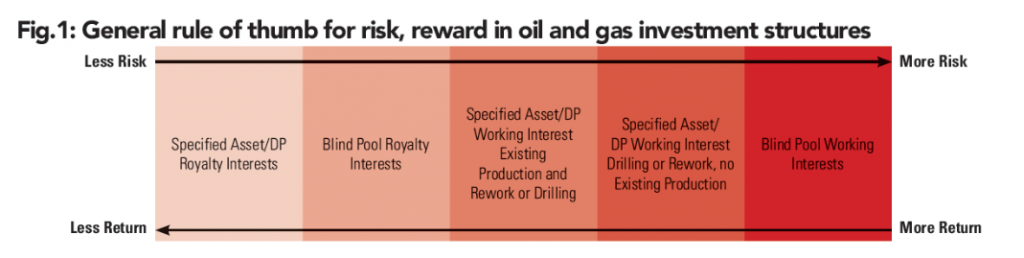
U.S. Mineral Exchange defines a mineral interest as “the ownership of all rights to gas, oil, and other minerals at or below the surface of a tract of land.” Last week we reviewed the three types of mineral interests – royalty interests, working interests, and overriding royalty interests. This week we analyze the risks associated with working interests versus royalty interests. An overview of royalty interests and working interests is included below:
- Royalty Interest – an ownership in production that bears no cost in production. Royalty interest owners receive their share of production revenue before the working interest owners.
- Working Interest – an ownership in a well that bears 100% of the cost of production. Working interest owners receive their share of the profit after (i) royalty owners have received their share and (ii) after all operating expenses have been paid.
When valuing mineral interests, it is important to consider the nuances of each type of mineral interest. Given that risk and asset values are indirectly related, it is important to keep in mind the various risk factors which pertain to the mineral interest. We’ll begin by examining the various risks surrounding both types of interests.
Risk
Both working interests and royalty interests are exposed to fluctuations in oil and gas prices. When crude oil prices fell in mid-2014, so did the value of working interests, whose worth is based on the present value of the cash flows generated from production, and the value of royalty interests, whose value is based on future payments of revenue. Further, both working interests and royalty interests face the risk of depletion as oil and gas wells are depleting assets. Even if the price of oil and gas is stable from one year to the next, a well may have 30% less production in its second year. This can dramatically decrease the yield of particular royalty and working interests.
Holders of working interests can mitigate the risk of depletion by drilling new wells or improving production of existing wells. While this gives a working interest holder more flexibility, it also requires a substantial investment in CAPEX. Working interest holders accept all fiscal burdens associated with the drilling process.
Royalty interest holders, on the other hand, bear no cost of production but are at the mercy of their operators. Only the working interest owner can decide to halt production when prices drop and to increase production when the drilling environment is favorable. The Oil and Gas Financial Journal compares buying a royalty interest to “buying an income strip in producing wells, and the risks are primarily price volatility and depletion.”
Each type of interest has unique attributes, but the fact that working interest owners are responsible for operating expenses makes working interests inherently riskier than royalty interests which are characterized by monthly “mailbox money” precipitated by zero costs. We see this when examining the volatility of select E&P companies who spun off their royalty interests into royalty trusts structured as MLPs.
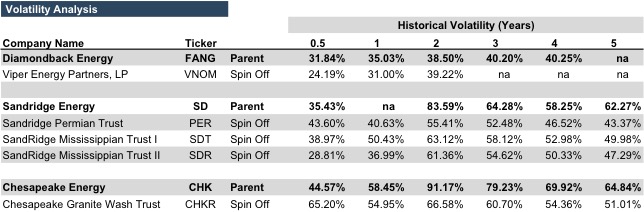
The royalty trusts above generally demonstrate less volatility, which is often used as a proxy for financial risk, than their parent E&P companies. The principles of risk and return, however, tell us that because there are fewer risks associated with royalty interests they will yield lower returns than their riskier counterparts. Royalty interests range in percentage ownership of revenues from 0.025%-25%, meaning that, at the highest royalty interest, at least 75% of revenue is still funneled to the working interest owners. Due to differences in risk, royalty interests are unlikely to generate the magnitude of returns that working interests can experience. At the same time, they are less likely to experience the same degree of loss.
Return
The standardized measure of investment performance for a given unit of time is return. Investment returns have two components. The first, yield, measures the current income (distributions) generated by an investment. Capital appreciation, the second component, measures the increase in value during the period. As shown below, total return is the sum of yield and capital appreciation.

Royalty trusts commonly make substantial distributions because they generate revenue as long as their operators are drilling and they have minimal operating expenses. Thus it is important to examine total return when comparing interests in E&P companies, who own working interests, and royalty trusts who own royalty interests. In the chart below we examine the total returns of the companies introduced above and their associated royalty trusts.
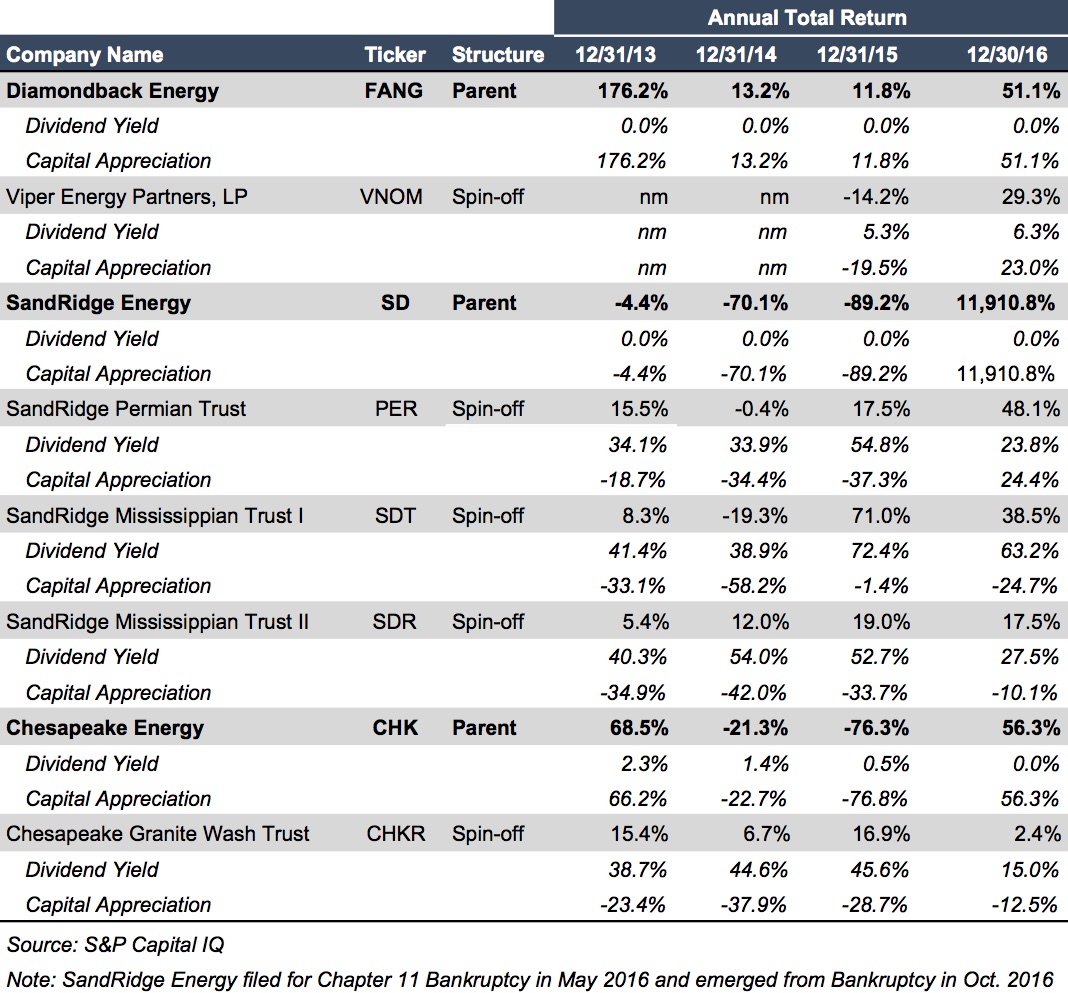
As expected, the E&P companies which hold working interests show higher returns and steeper losses than their associated royalty trusts.
We have assisted many clients with various valuation and cash flow issues regarding royalty interests. Contact Mercer Capital to discuss your needs in confidence and learn more about how we can help you succeed.

