
Key Takeaways
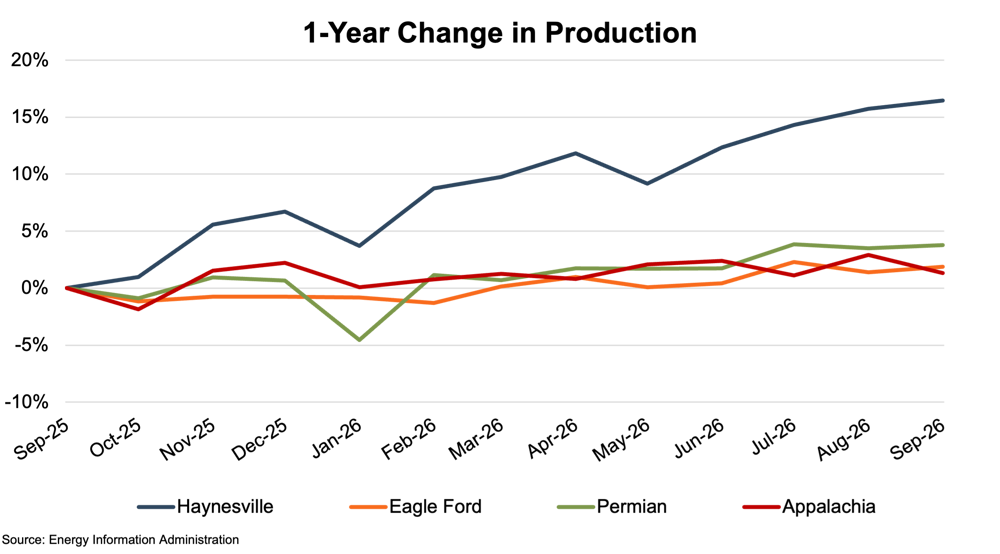
Appalachian natural gas production remained relatively stable over the latest twelve-month period, increasing 1.3% despite an 11% decline in active drilling rigs. A 24% reduction in drilled but uncompleted (DUC) well inventory helped operators sustain production while maintaining capital discipline.
Appalachia's modest production growth contrasted with stronger gains in the Haynesville, highlighting the impact of regional infrastructure and development economics. Pipeline takeaway constraints and continued capital discipline limited Appalachian drilling activity, while the basin's ability to sustain production with fewer rigs demonstrated operational efficiency.
Natural gas price volatility and shifting global energy market conditions contributed to fluctuations in Appalachian producers' share prices, with Antero Resources, Range Resources, and EQT Corporation all posting year-over-year declines. Despite near-term pricing uncertainty, growing LNG export demand and domestic natural gas consumption provide a constructive longer-term outlook, tempered by persistent pipeline takeaway constraints.
The economics of oil and gas production vary by region. Mercer Capital focuses on trends in the Eagle Ford, Permian, Haynesville, and Appalachian plays. The cost of producing oil and gas depends on the geological makeup of the reserve, depth of the reserve, and the cost to transport production to market. These factors drive meaningful differences in costs across regions. This quarter, we take a closer look at the Appalachian shales and recent developments.
Production and Activity Levels
Appalachian production (on a gas-equivalent basis) increased approximately 1.3% year-over-year (“YoY”) over the latest twelve-month (“LTM”) period, rising from 37.8 billion cubic feet equivalent per day (“bcfe/d”) in September 2025 to 38.3 bcfe/d in September 2026. Production in Appalachia remained relatively stable throughout the review period, with fairly modest monthly fluctuations. Among the other major basins included in our analysis, the Eagle Ford and Permian also posted comparatively modest production growth of 1.9% and 3.8%, respectively. Eagle Ford production followed a similarly stable trend, while the Permian experienced a notable, but temporary, decline in January 2026, reflecting weather-related disruptions to oil and gas operations across West Texas during Winter Storm Fern. Production recovered to 69.6 bcfe/d in February and generally trended upward over the remainder of the review period.
The Haynesville was the clear outlier among the four basins, with production increasing 16.5% YoY, from 15.1 bcfe/d in September 2025 to 17.6 bcfe/d in September 2026. While Haynesville production experienced somewhat greater month-to-month volatility than Appalachia and the Eagle Ford, its overall growth trend was substantially stronger, particularly during the latter half of the review period. The Haynesville's robust production growth reflected increased drilling activity supported by expectations for stronger natural gas demand from expanding Gulf Coast LNG export capacity.
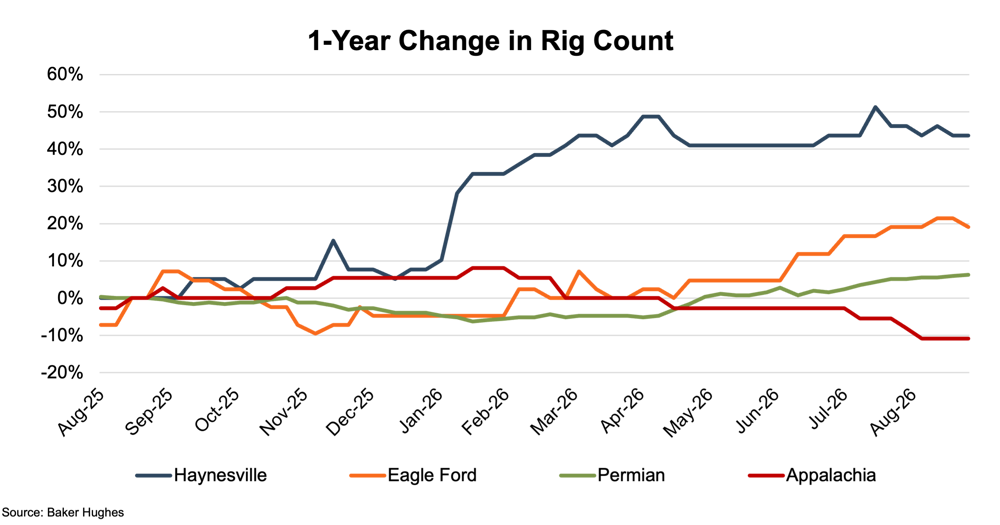
Appalachia posted the only YoY decline in rig count among the four basins covered, falling 11% from 37 active rigs in September 2025 to 33 rigs in September 2026. Appalachian rig counts increased modestly during the fourth quarter of 2025, reaching 39 rigs in December, and remained relatively stable at 39 to 40 rigs through mid-March. Rig activity began a general decline in late March, with the rig count gradually falling to its review period low of 33 rigs in early September. The decline is consistent with continued capital discipline among Appalachian operators, who have emphasized drilling efficiencies and measured development activity, against a backdrop of pipeline takeaway constraints that continue to limit the pace of production growth in the region.
The other three basins posted YoY rig count increases, led by the Haynesville, where active rigs rose 44%, from 39 in September 2025 to 56 in September 2026. After remaining relatively stable through January, Haynesville activity increased sharply in February, peaked at 58 rigs in early May, and then stabilized in the mid-50s. The increase reflected improving drilling economics and expectations for stronger natural gas demand from expanding Gulf Coast LNG export capacity. Compared with Appalachia, the Haynesville’s proximity to Gulf Coast export facilities and less constrained pipeline infrastructure provided operators with a stronger near-term incentive to add rigs.
The Eagle Ford posted the second-largest YoY rig count increase at 19%, rising from 42 to 50 active rigs, while the Permian increased 6%, from 254 to 270 rigs. Both basins experienced declining rig counts during the first several months of the review period before recovering during 2026. The Permian reached a low of 238 rigs in February before trending upward through September, while the Eagle Ford experienced its strongest rig count growth during the latter portion of the review period.
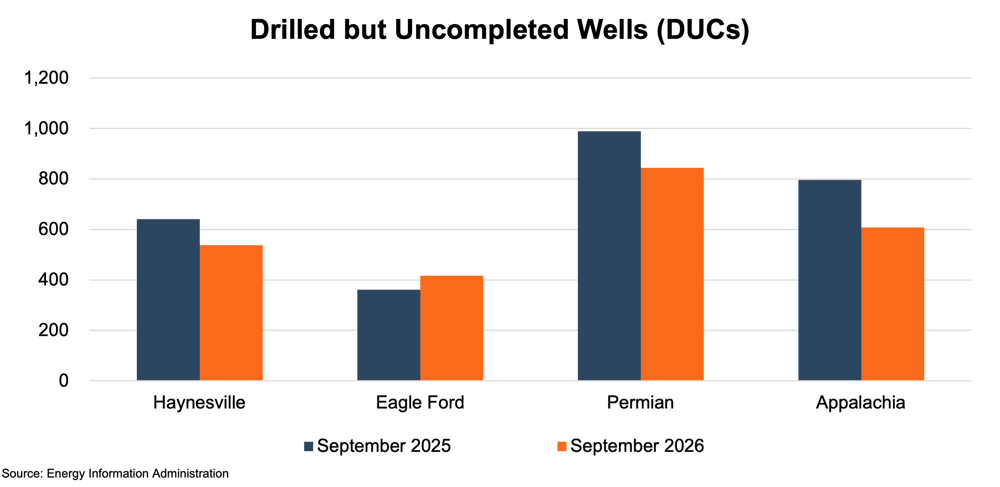
One factor that likely contributed to Appalachia's ability to maintain relatively stable production despite declining rig counts was the drawdown in its inventory of drilled but uncompleted (“DUC”) wells. DUCs are wells that have been drilled but have not yet undergone the completion activities necessary to begin production. By completing these previously drilled wells, operators can bring additional production online without deploying additional drilling rigs. Appalachia's DUC inventory declined approximately 24% over the review period, falling from 796 wells in September 2025 to 608 wells in September 2026. The Permian also experienced a notable drawdown in DUC inventory, declining approximately 15% from 989 to 844 wells, which likely helped support production growth despite a relatively modest increase in drilling activity.
Commodity Price Volatility
Henry Hub natural gas front-month futures prices began the review period at $3.30/MMBtu and climbed above $4.00/MMBtu in early October 2025. Prices continued to trend upward through November, reaching a review period high of $5.06/MMBtu in early December. The increase was supported by rising LNG export demand, colder weather forecasts, and increasing demand for natural gas as the winter heating season began. A sharp reversal followed in December as shifting weather forecasts pointed to milder temperatures and reduced heating demand. Henry Hub prices fell rapidly from their early December high, reaching $2.63/MMBtu in early January.
Natural gas prices rebounded sharply in late January as Winter Storm Fern brought unusually cold temperatures across much of the country, increasing heating demand and disrupting natural gas production. Henry Hub futures reached $4.35/MMBtu in late January before declining again to approximately $2.86/MMBtu by the end of February. Price volatility moderated considerably over the remainder of the review period, with Henry Hub generally trading between $2.60/MMBtu and $3.37/MMBtu from March through September. Strong natural gas production and relatively high storage inventories helped limit upward price pressure during the spring and summer months, despite increased natural gas demand for electricity generation during warmer weather. Henry Hub ended the review period at $3.03/MMBtu.
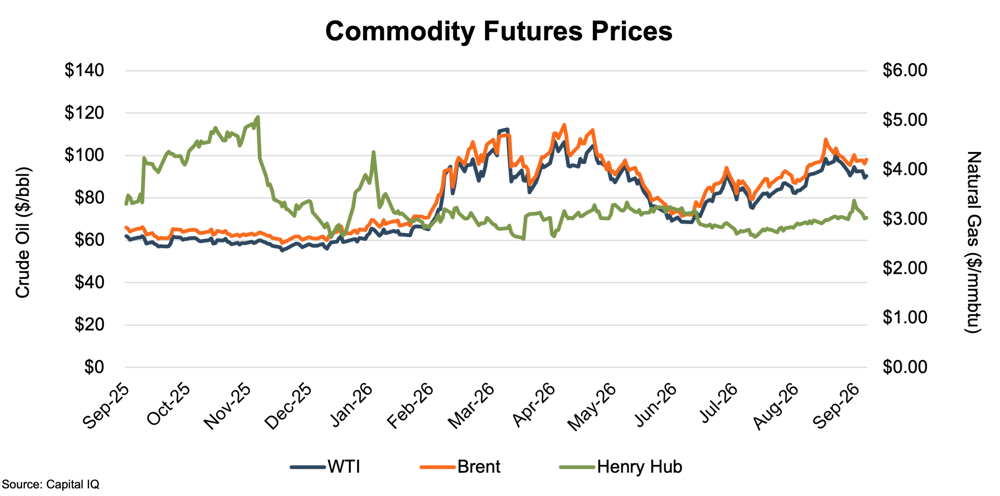
Oil prices, as benchmarked by West Texas Intermediate (WTI) and Brent Crude (Brent) front-month futures contracts, traded within comparatively narrow ranges through February 2026, declining modestly through December before recovering during January and February. Prices surged in late February following U.S. military strikes against Iran, which raised concerns over disruptions to crude oil shipments through the Strait of Hormuz. Subsequent disruptions to shipping traffic and the curtailment of crude oil production by several Middle Eastern countries contributed to considerably greater price volatility. WTI reached a review period high of $112.41/bbl in early April, while Brent peaked at $114.44/bbl in early May.
Both crude oil benchmarks subsequently declined sharply through May and June as negotiated ceasefires and expectations for the restoration of shipping traffic through the Strait of Hormuz eased concerns over near-term supply disruptions. A June 17 agreement between the United States and Iran aimed at restoring tanker traffic through the Strait contributed to the decline, with WTI and Brent falling to $69.23/bbl and $72.60/bbl, respectively, on June 26. Prices generally trended upward again during the third quarter as renewed military hostilities in the Middle East and continued restrictions on crude oil exports raised supply concerns. Despite considerable volatility during the final three months of the review period, WTI and Brent ended September at $90.42/bbl and $98.03/bbl, respectively.
Financial Performance
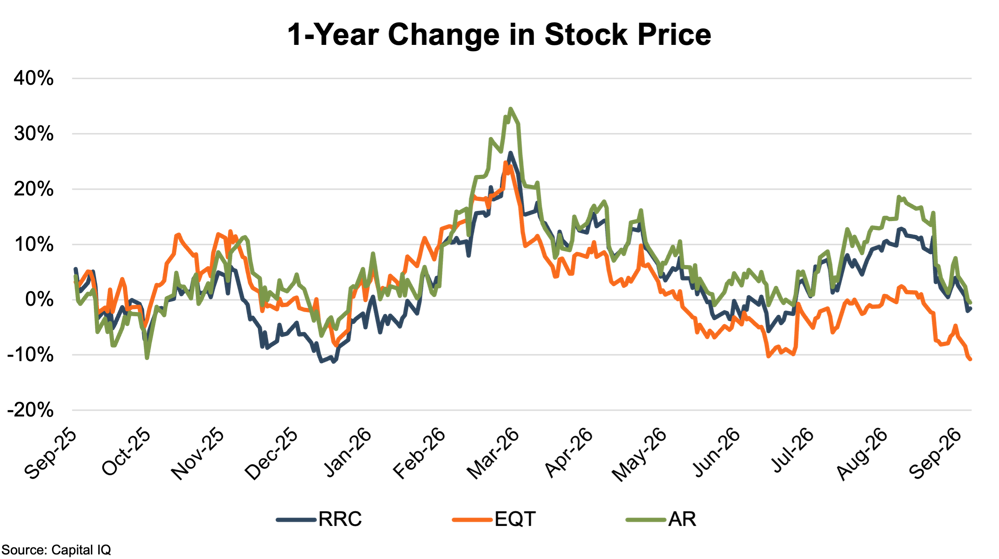
The Appalachian public comp group posted YoY stock price declines over the latest twelve-month period, with Antero Resources (AR) and Range Resources (RRC) declining a modest 0.5% and 1.6%, respectively, while EQT Corporation (EQT) posted a larger decline of 10.8%. Despite these relatively modest full-period changes, the three companies experienced considerable stock price volatility during the review period, generally following similar directional movements. Share prices trended upward through late November and early December 2025, alongside strengthening natural gas prices and expectations for increased winter heating demand. A sharp reversal followed through the end of December and into early January, coinciding with warmer weather forecasts that reduced near-term natural gas demand expectations and contributed to declining commodity prices.
The comp group's share prices subsequently recovered, climbing sharply from mid-January through late March 2026. The initial recovery coincided with increased natural gas demand and prices associated with Winter Storm Fern. The group's share prices continued to rise during March, coinciding with military hostilities involving Iran that disrupted global energy markets, including LNG shipments from the Middle East, and increased interest in U.S. natural gas and natural gas liquids (“NGL”) supplies. Share prices subsequently declined through late June, a period marked by relatively subdued domestic natural gas prices amid strong production and ample inventories, while easing concerns over international supply disruptions reduced some of the earlier upward pressure on global energy prices.
Share prices generally recovered during July and August, particularly for Antero and Range Resources, before declining again during September as expectations for relatively high natural gas inventories heading into the winter heating season weighed on market sentiment. EQT notably underperformed the other two companies beginning in July, potentially reflecting greater sensitivity to subdued domestic natural gas prices. EQT's second quarter earnings fell short of analyst expectations amid lower realized natural gas prices, while Antero and Range benefited from stronger NGL price realizations and favorable operating developments. Although all three companies ended the review period below their year-earlier share prices, their movements continued to reflect investor expectations regarding natural gas fundamentals and the growing importance of U.S. energy supplies to international markets.
Conclusion
Appalachian Basin production remained relatively stable over the review period despite a notable decline in drilling activity, supported in part by the completion of previously drilled wells. The basin's modest production growth contrasted with the much stronger gains in the Haynesville, where drilling activity expanded significantly amid expectations for growing Gulf Coast LNG export demand. While both basins are heavily weighted toward natural gas, differences in infrastructure access and development economics contributed to their differing levels of activity.
Natural gas prices experienced considerable volatility over the review period, contributing to fluctuations in Appalachian public company share prices and ultimately YoY stock price declines across the comp group. Nevertheless, Appalachia's ability to sustain production with fewer active rigs demonstrates the operating flexibility of the basin's producers. Continued growth in LNG export demand and domestic natural gas consumption should provide a constructive backdrop for the region, although commodity pricing and pipeline takeaway capacity will remain important considerations for future development activity.
We have assisted many clients with various valuation needs in the upstream oil and gas space for both conventional and unconventional plays in North America and around the world. Contact a Mercer Capital professional to discuss your needs in confidence and learn more about how we can help you succeed.