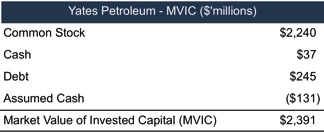
On September 6, 2016 EOG Resources (EOG) announced the acquisition of Yates Petroleum (Yates) for approximately $2.4 billion dollars, by our calculations. Yates will receive approximately $2.2 billion in EOG common stock and $37 million in cash. In addition, EOG assumed $114 million (net) in Yates debt.1 Based on EOG’s disclosures, the assets received by EOG include (1) Wells currently producing 29,600 barrels of oil equivalent per day (BOEPD); (2) proved developed reserves of 44 million barrels of oil equivalent; and (3) 1.624 million in net acreage throughout New Mexico, Wyoming, Colorado, Montana, North Dakota and Utah. Approximately 48% of the current production and proved developed reserves are crude oil. Based upon the consideration given by EOG, here is the implied market value of invested capital (MVIC) for Yates:
 The other side of the transaction ledger is the value of the individual assets acquired. Since Yates is not a public company, allocating the purchase price to the individual assets is, dare we say, educated guesswork at best. Here is our guestimate of the assets that will need allocated value and their key information items.2
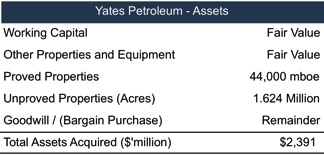 Before venturing into our approach to the allocation, we have compared pricing multiples of the Yates acquisition and other oil and gas public companies. At the time of the transaction, Yates owned acreage rights in several domestic resource plays with the most popular resource play of 186,000 net acres in the Delaware Basin. The below chart shows the implied pricing metrics for Yates versus the market pricing multiples for publicly traded operators in the Delaware Basin.
Valuation Metrics
Based upon these ratios, we have the following observations:3
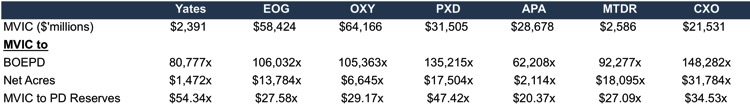
- EOG is approximately 25x larger than Yates;
- Of the six public companies, Yates is very close in size to Matador Resources Company (MTDR);
- Based on per day production, the Yates transaction was priced at the lowest indicated value except for Apache Corp (APA);
- Based upon net acres acquired, the Yates transaction was priced at the lowest indicated value of all the publicly traded companies;
- Based on proved developed reserves, the Yates transaction was priced at the highest indicated value of the group.
- The attractive upside for Yates is not in the current production, but in the undeveloped acreage, possibly adjacent to EOG acreage (explains the low MVIC to BOEPD metric);
- Of the acreage that Yates owned, a large majority of it is not highly coveted by Yates and EOG (explains the low MVIC to net acre metric);
- Of the proved developed reserves known by Yates, EOG believes they can develop significantly more reserves in the future (explains the high MVIC to proved developed reserves metric);
- As the interest for EOG does not appear to be in vast amounts of acreage that Yates owns, the current production nor the developed reserve, this leads us to believe the highly coveted Delaware Basin positions were the primary drivers for the acquisition.
Assets Purchased
Earlier, we displayed the high level categories for an allocation of purchase price. Three of these categories are oil and gas related assets: (1) Wells currently producing 29,600 barrels of oil equivalent per day; (2) proved developed reserves of 44 million barrels of oil equivalent; and (3) 1.624 million in net acreage. The valuation for current production and proved developed reserves is fairly straight forward. No doubt Yates prepared a reserve report which would aid in the valuation of the currently producing wells and the remaining proved reserves. However, the valuation gap between the proved developed reserves and the remaining proved undeveloped, probable and possible reserves or acreage value can be detailed, tedious, and complex. The historically low oil and gas price environment and financial tension within the industry creates a complicated market place for using market transactions as indications of value.
Acreage Owned by Yates
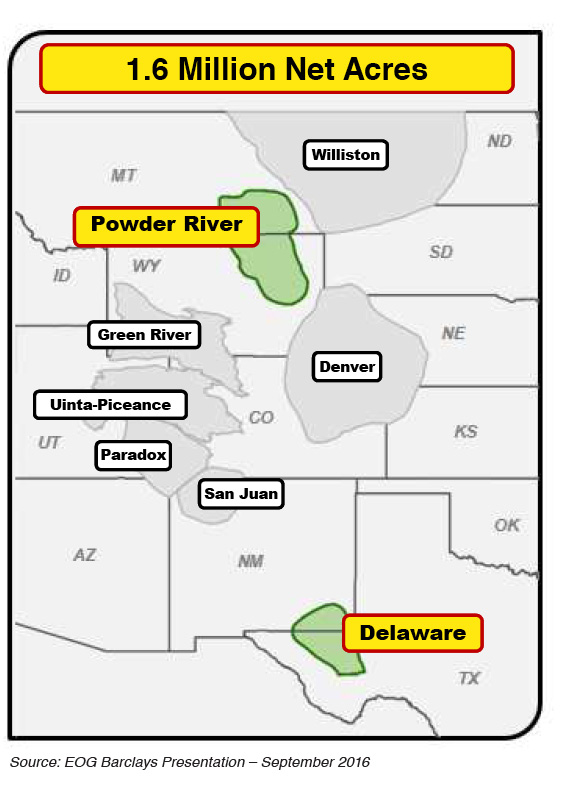 The highly publicized acreage includes: (1) 186,000 net acres in the Delaware Basin; (2) 138,000 net acres in the Northwest Shelf; (3) 200,000 net acres in the Powder River Basin and (4) other western basins which add up to 1.1 million net acres. The following maps, disclosed by EOG, show the resource plays Yates owned acreage within. These resource plays range from Texas to Canada. Of the eight resource plays named in the map, EOG classifies two as the “best plays”. These are the Delaware Basin and the Powder River Basin.
Delaware Basin
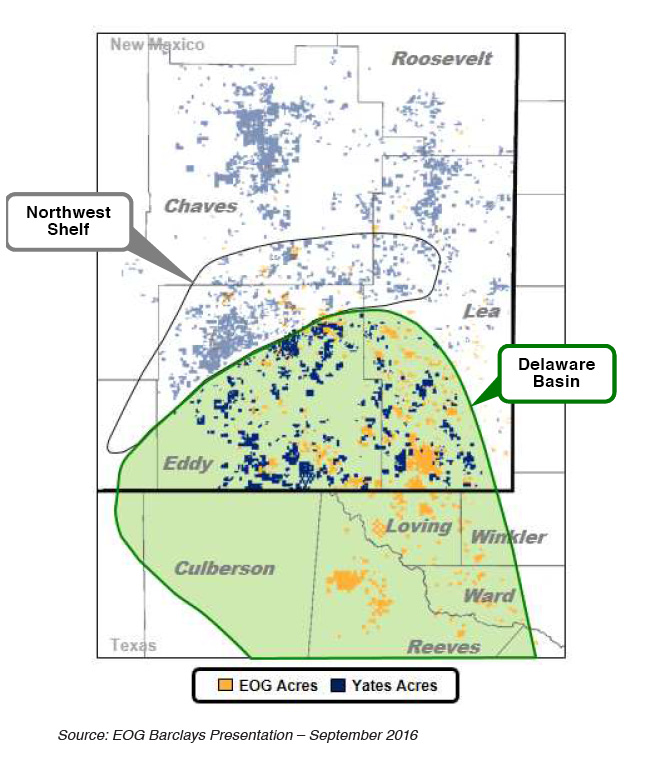 EOG then allows us a closer look at the location of Yates acreage in the Delaware Basin in comparison to EOG’s acreage. Many instances exist where Yates acreage is right next to EOG’s acreage, this could allow for longer and more cost effective lateral wells. Market transactions for acreage in this area vary significantly based on seller motivation, buyer synergies and commodity price timing. Our experience indicates acreage rights historically transact from $50 per acre to $14,000 per acre and above, depending on location.
Northwest Shelf
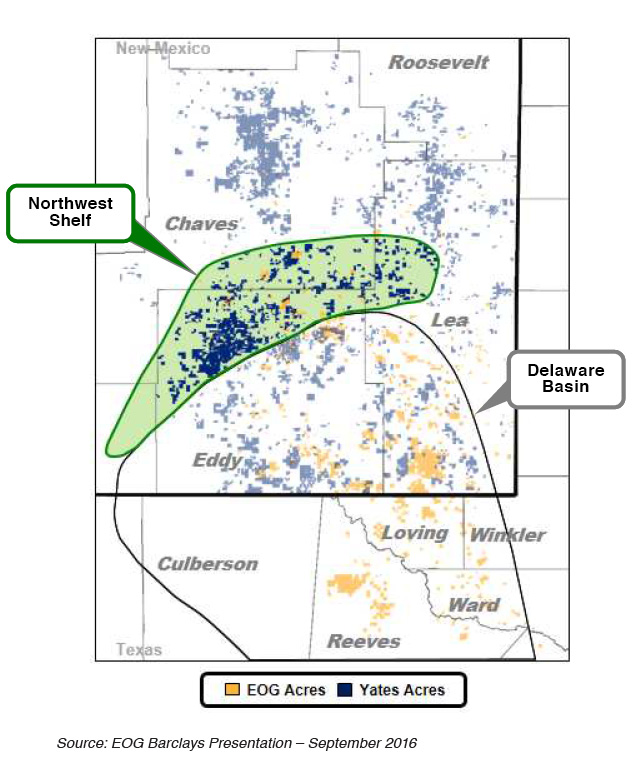 Another map comparing Yates and EOG’s acreage location in the Northwest Shelf shows less instances where the two companies acreage is connected but clearly demonstrates Yates is seemingly centered in the most desired areas of the Northwest Shelf. In addition to these two plays, the map shows Yates acreage located in northern Chaves and Lea counties. EOG does not show any acreage in these areas. Our historical transaction data indicates acreage rights transact for $50 to $350 per acre in northern Chaves, Lea, and Roosevelt counties. Compare this to the Delaware Basin and Northwest Shelf areas which have spots that historically transact for $5,000 per acre and above.
Powder River Basin
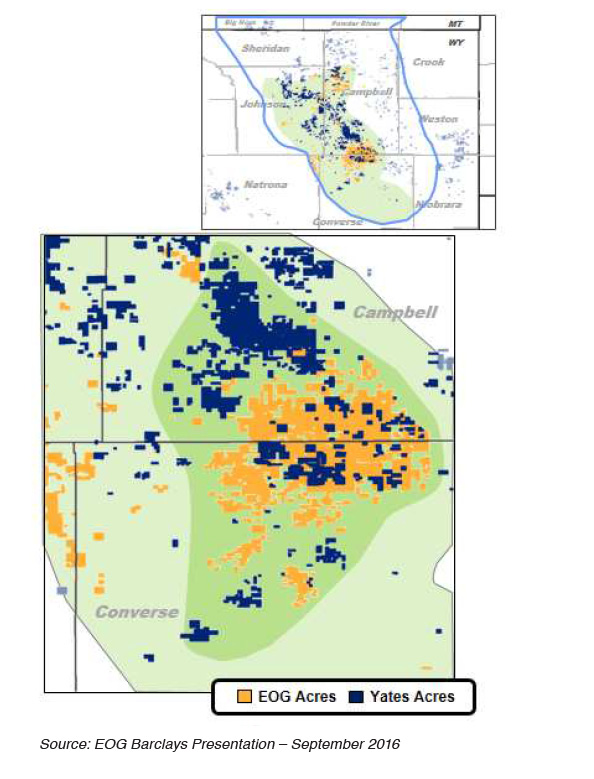 EOG also discusses their interest in the Powder River Basin. As the map shows, EOG has significant acreage positions in the middle of the play. Similarly, Yates has large clumps of acreage rights in the same general area and in some cases, right next to EOG. This tends to indicate efficient drilling benefits may exist in the Powder River Basin too. Similar to the resource plays in New Mexico, acreage rights pricing varies widely by location.
Drilling Deeper
More information is needed to drill down into the specifics and valuation of each of the acquired oil and gas assets. Interested parties may want to consider the following information areas:
- Reserve Reports. Specifically, we would like to understand the amount of acreage in each of the maps above that have been drilled versus what areas are included in the drilling plan, PV 10 indications and price deck assumptions.
- Financial Statements. It would also be helpful to understand more about Yate’s decision to sell, and perhaps, the financial situation immediately prior to the sale. What we know is approximately 48% of the current production is oil which leaves 52% of the production as either natural gas or natural gas liquids. This leads us to ask: is Yates an example of oil prices exposing a struggling natural gas company? Yates had $245 million in debt, and $114 million in net debt. Based upon our calculated $2.3 billion MVIC indication, debt is approximately 4.85% of the capital structure. While this is just a guess on our part, this doesn’t indicate a financially stressed company. It does make us question their ability to obtain additional financing for new wells.
- Synergistic efficiencies. Drilling efficiencies have been disclosed by EOG, but we don’t know how many new well locations EOG created by having access to Yates acreage. Yates may not have been able to release on their own for many reasons.

