Production in the Permian is as hot as the summers in West Texas. Despite being discovered in the 1920s, it was not until 2007 that the region’s true potential was realized when hydraulic fracturing techniques were used to access the play's tight sand layers. Given its low-cost economics and large well potential, in recent years, the Permian has been in the limelight with operators and investors alike prioritizing the region.
According to Baker Hughes, there are virtually no active gas-directed rigs, but significant gas production is still occurring in the region because natural gas is coming as a by-product from the oil rigs. As we discussed in a previous post, this is having a negative effect on natural gas prices and producers outside of the Permian. Companies in the Permian have an advantage because they do not have to choose between oil and gas, and production is more efficient. As such, the Permian is the largest producer of oil and the second largest producer of gas, after the Marcellus.
Rig Counts and Production
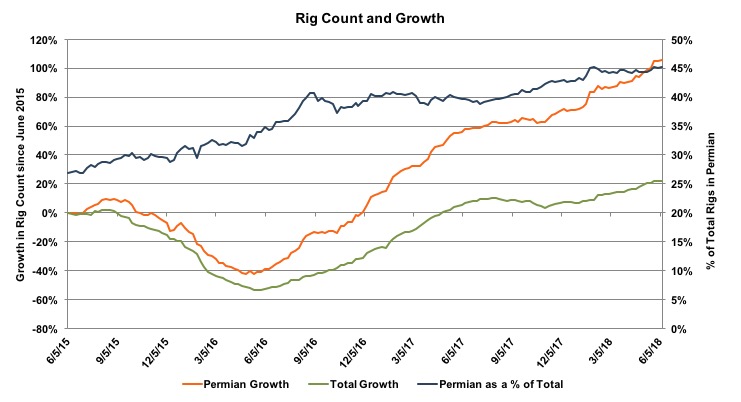
With many producers clamoring for a piece of the action, the number of rigs in the Permian has consistently grown at a faster rate than total rig counts in the country. As a result, the Permian has increased its share of total rig counts, as seen in the graph below. In June 2015, the Permian accounted for 27% of all rigs, but that number steadily increased to 45% as of June 2018. The number of rigs in the Permian has grown 32% in the past year, compared to 16% nationally; these figures were 156% and 125% for the year before that.
 According to the EIA, production of oil and natural gas in the Permian Basin has increased at a compound annual rate of 25.0% and 21.1%, respectively over the last five years. In the past year alone, oil production increased 35.6% and gas production increased 26.5%, with over 45% of the U.S.’ crude oil and 15% of the country’s natural gas currently coming from the Permian Basin.1 A concerted effort has been made to increase efficiency, which has led to a rise in production per well. Oil production per rig in the Permian increased more than 36% in the last year, which, when combined with the rise in rig count, further emphasizes the focus on the region.
Economic Impact
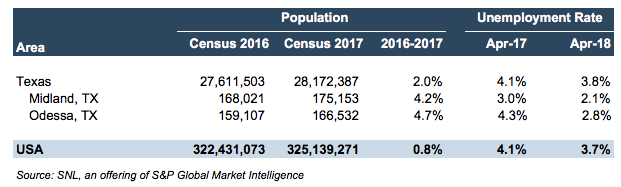
With this rush to West Texas, Midland and Odessa are in the middle of the action. The boom has had a large impact on their economies as a whole. Population growth from 2016 to 2017 was estimated at 4.2% for Midland and 4.8% for Odessa, compared to 2.0% for Texas and 0.8% for the country. Unemployment was also extremely low at 2.1% and 2.8%, respectively, compared to 3.8% for the state and 3.7% for the country. The national unemployment rate is already at its lowest of this millennium, emphasizing how razor-thin the margin is in Midland. This has caused significant labor shortages in other sectors of the economy as they cannot compete with $28/hour wages offered after minimal training requirements for workers in the oil sector.
Valuation Implications
We can understand the valuation implications for companies in the Permian Basin by looking at 1) royalty trusts and mineral rights aggregators and 2) E&P companies.
Royalty Trusts
Positive market sentiment for the Permian region can be viewed in the performance of both operators in the region and publicly traded royalty trusts with exposure to the Permian. As seen in the following tables, royalty trusts in the Permian have seen far superior two year returns. Also of note is the average size measured by market cap. Viper Energy Partners, Black Stone Minerals, and Kimbell Royalty Partners are all aggregators of mineral interests and are not restricted from acquiring new interests like many other royalty trusts. This causes them to be larger, and it also allows them to gain exposure to new, advantageous regions, which may play a role in all of them having exposure to the Permian.
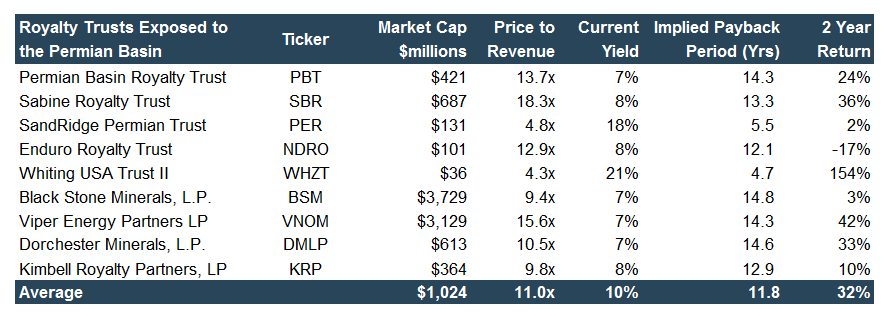
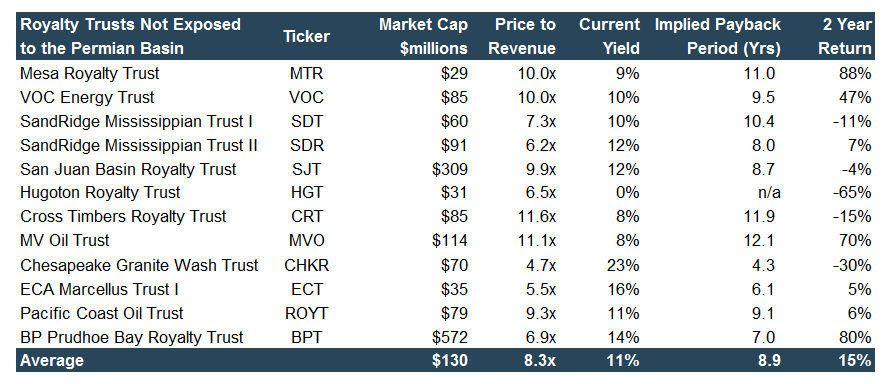 Royalty Trusts typically decline in both production and level of reserves. For the trusts with properties outside of the Permian, they have averaged decline rates of 14% for production and 21% for reserves over the past three years.2 However, trusts in the Permian are increasing at average rates of 13% for production and 7% for reserves. This indicates the increased activity in the region, though again, it should be noted that some of the trusts that are not restricted from acquiring new properties are likely to be categorized in the Permian group as they would have sought exposure to the region.
E&P Companies
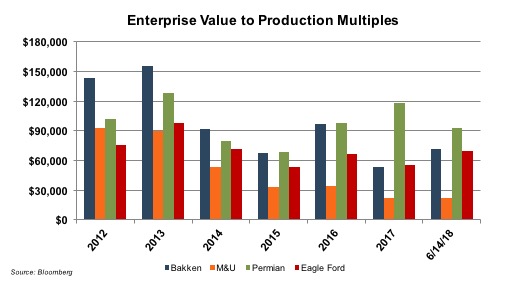
As seen in the graph below, E&P companies valuation multiples on average remain highest in the Permian, but they have declined 21% in 2018. Multiples in the Bakken and Eagle Ford meanwhile have cut into the gap, increasing 34% and 25%, respectively since the beginning of the year. The Marcellus and Utica continue to see the lowest valuation multiples and have declined by 2% in 2018. Companies in the Permian are generally more profitable than companies in other regions as explained by their lower break-even prices. According to Bloomberg Intelligence, recent break-even prices in the Permian were $38 in both the Delaware and Midland Basins.3 This represents a 6% decline for the Delaware Basin since June 2017, compared to a 28% decline in break-even price for the Midland Basin. These break-even prices compare favorably to $40 in the Bakken and about $44 in the Eagle Ford.
 Production in the Permian appears to be full steam ahead. And as they say, if you can’t stand the heat, stay out of the Permian.
We have assisted many clients with various valuation needs in the oil and gas space in the Permian region, other conventional and unconventional plays in North America, and around the world. Contact Mercer Capital to discuss your needs in confidence and learn more about how we can help you succeed.
Production in the Permian appears to be full steam ahead. And as they say, if you can’t stand the heat, stay out of the Permian.
We have assisted many clients with various valuation needs in the oil and gas space in the Permian region, other conventional and unconventional plays in North America, and around the world. Contact Mercer Capital to discuss your needs in confidence and learn more about how we can help you succeed.

