Memphis, our headquarters location, recently lost one of its more eccentric citizens, Prince Mongo, aged 333. The only known person from the planet Zambodia, Mongo had a varied career as a nightclub operator, a commercial property owner, and a perennial political candidate (sample platform plank: building a jail on an island in the Mississippi River surrounded by sharks). While we are not privy, we assume that his business activities led to interactions with the banking industry, but it is unknown whether Mongo sought to apply Zambodian law. Mongo cut quite a figure, with his usual attire consisting of no shoes, goggles, a silver wig, and a bandolier of rubber chickens. Some stories also mention a pet chimpanzee.
In contrast to Mongo’s idiosyncrasies, the dullness of banks within the current AI-driven market environment may be the banking industry’s most attractive feature. Consider the following financial metrics for publicly-traded banks:
Median year-to-date 2026 loan growth of 2.1% (not annualized), excluding banks that completed an acquisition in 2026. Among publicly-traded banks, 59% reported loan growth between 0% and 5% in 2026.
Median net interest margin expansion of 8bps between the fourth quarter of 2025 and the second quarter of 2026. Banks with wider 2026 NIMs represented 69% of the banks in our analysis. Recent NIM trends, coupled with the outlook for short-term interest rates, suggest relatively stable NIMs in coming quarters.
Median core return on assets was 1.24% in the first half of 2026, the same as in the second half of 2025.
Current 2026 and 2027 EPS estimates are 4% higher than the 2026 and 2027 EPS estimates that existed at year-end 2025.
These performance metrics might suggest relatively stable share price performance for publicly traded banks in 2026. This has not occurred, however. Among the 298 publicly-traded banks in our analysis, the median share price appreciation was 20% between year-end 2025 and August 24, 2026. This is even more impressive considering that bank stocks outperformed the S&P 500 and Nasdaq, which both appreciated by 12% in 2026, and follows small-cap bank stock underperformance compared to broad market indices in 2023, 2024, and 2025.
Several factors contributed to the small-cap bank stock outperformance in 2026, which can be categorized as bank-specific elements and market features. Contributors specific to the banking industry include:
The concerns that arose in 2025 about nondepository financial institution lending have faded with most banks reporting low loan losses.
After being surprised by banks’ adverse sensitivity to rising interest rates in 2022 and 2023, investors increasingly realize that the current interest rate environment is conducive to bank profitability.
Market factors, rather than banks’ operating performance, appear to be primarily driving bank stock performance, including:
Banks are, in a sense, an anti-AI trade. Not that banks will avoid disruption from AI but rather their performance is easier to extrapolate through the intermediate term than companies in the AI ecosystem.
Small-cap stocks performed well in 2026 relative to large-cap stocks, and this change in market sentiment has lifted the performance of bank stocks.
Relative to their long-term average trading multiples, or relative to broad market indices like the S&P 500, bank stocks appeared cheap in 2024 and 2025.
Our calculations indicate that about 20% of banks’ share price appreciation in 2026 has arisen from higher 2026 and 2027 EPS estimates, while the remaining 80% is attributable to P/E multiple expansion.
To the Zambodia
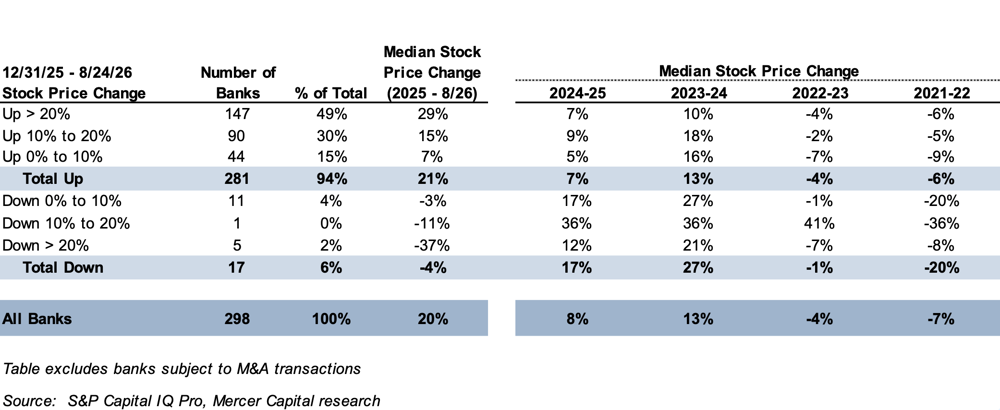
To adopt an older meme, bank stocks have not quite gone “to the moon” (er, Zambodia) in 2026, but they have performed very well. Table 1 shows that 94% of the approximately 300 publicly-traded banks appreciated in value during 2026, the largest portion (49%) of which have reported stock price increases of more than 20%. The median share price increase is 20%, relative to median appreciation of 13% in 2024 and 8% in 2025.
Table 1 also supports that share price laggards in 2025 outperformed in 2026. Banks with stock price appreciation in 2026 rose by 7% in 2025, whereas banks with lower stock prices in 2026 reported median share price growth of 17% in 2025. However, the number of banks with lower 2026 stock prices is relatively small.
Table 1
Large-cap stocks, measured by the S&P 500 or Nasdaq, significantly outperformed small-cap stocks, represented by the Russell 2000, in 2023 through 2025 (see Table 2). However, this trend reversed in 2026, with the Russell 2000’s appreciation (up 20.7%) nearly doubling the growth in the S&P 500 and Nasdaq indices (up 11.8%). This shift in market sentiment towards small-cap stocks appears to have influenced bank stock returns as well, with the S&P Small Cap Banks index outperforming the mid-cap and large-cap bank indices (15% vs. 9% to 10%).
Table 2
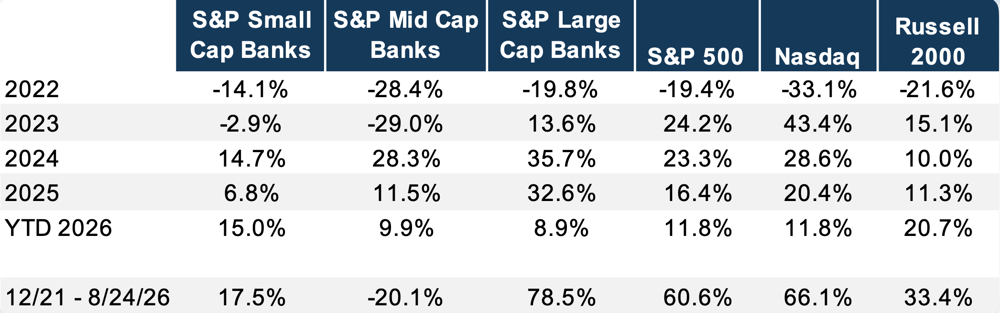
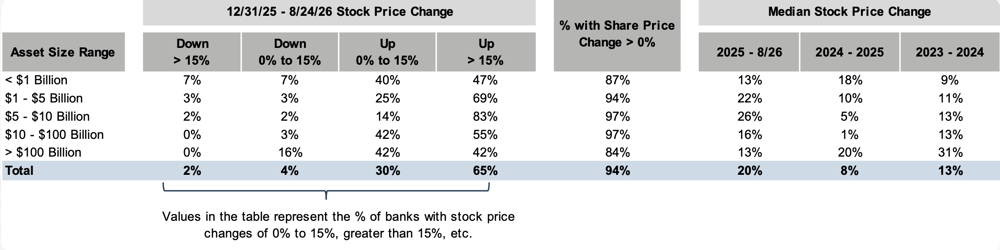
Table 3 indicates bank stock returns by asset size range, with banks in the $1 to $10 billion size range reporting the highest median share price appreciation in 2026 (up 22% for banks with assets between $1 to $5 billion and 26% for banks with assets between $5 and $10 billion).
Table 3
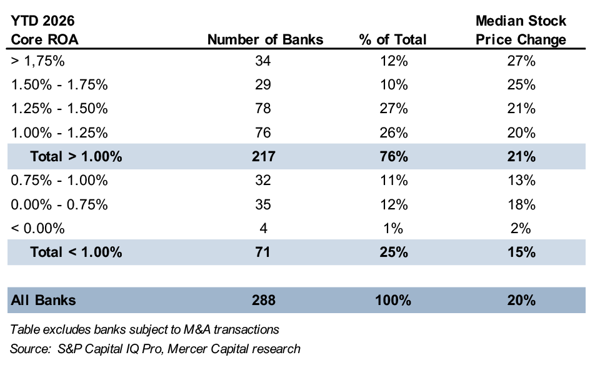
Some correlation appears to exist with return on assets and 2026 share price performance, with more profitable banks experiencing better returns (Table 4). However, banks with 2026 ROAs below 1.00% have benefited from the re-valuation of bank stocks in 2026.
Table 4
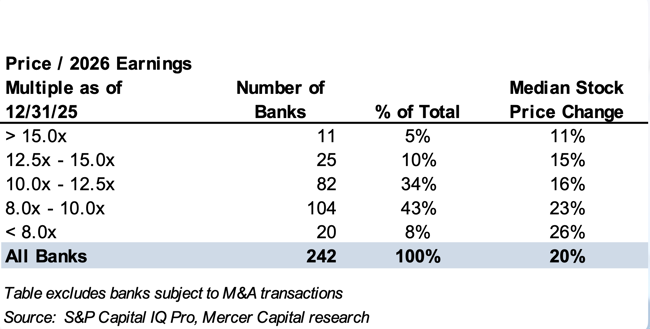
We also evaluated whether “cheaper” bank stocks, as measured by their price/2026 earnings multiples at year-end 2025, performed better in 2026. There is some evidence to support this assertion, as banks trading below 10x 2026 earnings as of year-end 2025 outperformed banks trading at higher multiples (see Table 5 ).
Table 5
Median EPS estimates for 2026 increased by about 4% between year-end 2025 and August 2026. As a result, bank stock returns in 2026 are attributable primarily to a broad re-valuation of the sector’s earnings, rather than a more optimistic earnings outlook. As indicated in Table 6, median bank P/E multiples increased by about two turns for all but the largest banks between year-end 2025 and August 24, 2026 (e.g., from 9.4x to 11.5x for banks with assets between $5 billion and $10 billion).
Table 6
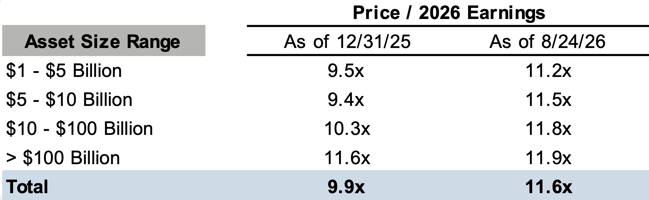
Table 7
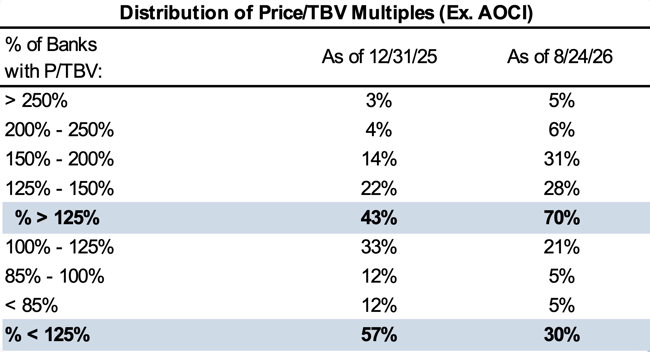
As would be expected with P/E multiple expansion in 2026, price/tangible book value multiples have risen as well. Our analysis uses price/TBV multiples excluding accumulated other comprehensive income. Table 7, on the next page, illustrates the re-valuation of the banking sector in 2026. At year-end 2025, 43% of publicly traded banks had a price/TBV multiple exceeding 125%. This proportion increased to 70% as of August 24, 2026.
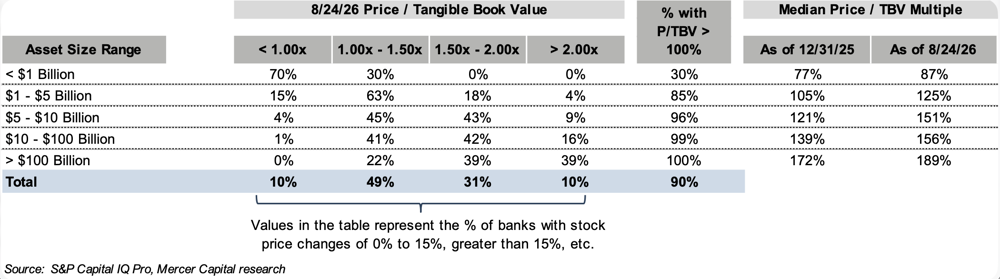
Table 8 shows a breakdown of price/TBV multiples by asset size range as of August 24, 2026, with the largest proportion (49%) trading between 1.00x and 1.50x TBV. Price/TBV multiples have expanded noticeably in 2026, with median P/TBV multiples for banks with assets between $1 and $5 billion rising from 1.05x at year-end 2025 to 1.25x at August 24, 2026.
Table 8
Conclusion
While small-cap bank stocks have not gone to Zambodia in 2026, several positive trends are evident:
Banks with assets below $10 billion, which underperformed large-cap banks in 2024 and 2025, outperformed in 2026.
Forward P/E multiples, now approximately 12x 2026 earnings and 10.5x to 11.0x 2027 earnings,have trended towards a long-term average.
While most all bank stocks have appreciated in 2026, greater returns have accrued to more profitable banks.
Ultimately, the market controls the P/E multiple applied to bank earnings; banks should not count on the market’s beneficence, in terms of P/E multiple expansion, to continue driving shareholder returns. To create a (perhaps misplaced) analogy, banks are like Earth and markets are like Planet Zambodia.
Earnings are determined on Earth by banks’ day-to-day focus on risk management, profitability, and growth. The markets, this unseen force somewhere out there like Planet Zambodia, render judgment on banks’ performance. Like Price Mongo, the market’s actions can appear irrational. Banks can influence the market’s judgment by enhancing growth or lessening risk, but the P/E multiple ultimately is subject to the market’s Zambodian wisdom.