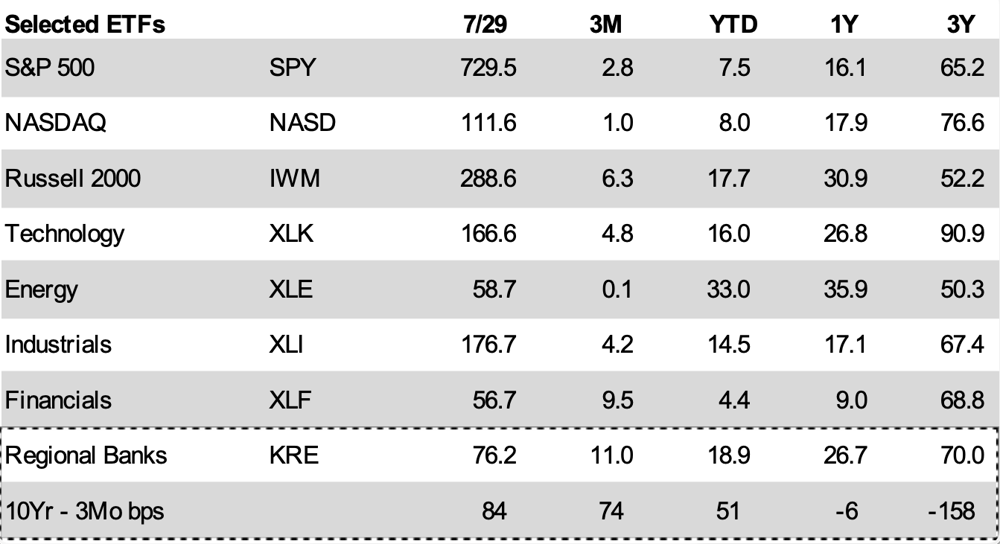
As shown in Table 1, large community and regional banks have joined in the equity rally that has been off and on the past several years after posting strong returns in the ~12 months after SVB failed. Through July 29, the S&P Regional Bank ETF that encompasses ~160 equally weighted bank stocks, returned 18.9% year-to-date, ahead of the S&P 500’s 7.5% gain and broad financial sector’s return of 4.4% that was hindered by underperformance of large cap alternative asset managers.
The Russell 2000 also outperformed, rising 17.7%, suggesting that the bid for bank shares is part of a broader rotation toward smaller-cap companies rather than a bank-only phenomenon.
Table 1 – Sector Total Returns & Yield Curve Spread
Aside from sector rotation and relatively modest multiples, bank stocks have been supported via earnings growth that has been powered by net interest margin (NIM) expansion and flattish credit costs. NIM improvement reflects a combination of factors, most notably the return to a positively sloped yield curve, repricing of assets that were originated at ultra-low rates during 2020-1H22, and lower funding costs once the Fed cut policy rates in the fall of 2024 and 2025.
The spread between the ten-year Treasury and three-month Treasury widened to 84 basis points as of July 29 from an inversion of 158 basis points three years earlier. A positively sloped curve does not solve every balance-sheet issue, but it improves the backdrop for deposit rates that track the short-end of the yield curve, asset repricing, reinvestment, and prospective margin performance.
Earnings Supply the Fundamental Support
Second-quarter results explain much of the market’s enthusiasm. Every peer group reported double-digit year-over-year EPS growth, with the strongest gains among Wall Street and trust banks as booming capital markets supported trading, investment banking and asset management. Revenue and pre-provision net revenue also increased across the board, while loan growth generally remained in the low- to mid-single digits.
For community and regional banks, the more relevant point is that earnings growth was not confined to the money centers. Banks with $2 billion to $10 billion of assets produced median ROA of 1.28%, ROTCE of 14.3%, and 18.8% EPS growth as NIMs expanded ~25bps over the past year. Institutions above $10 billion posted similar profitability and traded near 12x expected 2026 earnings. That valuation is not cheap per se, but it leaves room for expansion if the Street’s earnings estimates hold or improve provided the credit outlook remains benign.
Table 2 – 2Q26 Public Banks’ Summary Performance
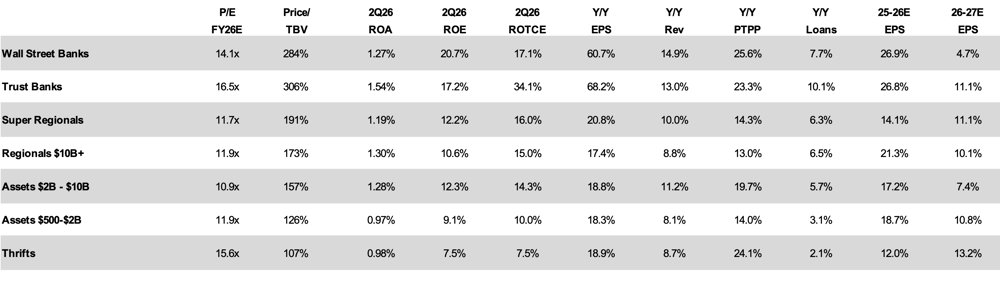
The table also highlights the industry’s remaining divide. Larger banks continue to earn higher ROEs and command richer tangible book multiples, while the smallest banks and thrifts lag on profitability. Scale is not the only answer, but the market is assigning a clear premium to institutions that can generate operating leverage.
IPOs for Banks Too
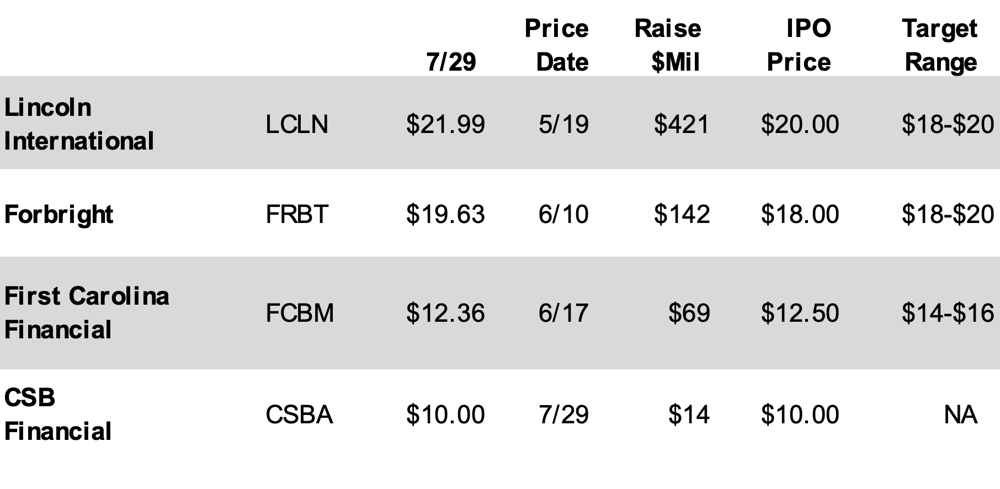
A functioning IPO market is another sign that risk appetite has improved. Although there is not a flood of IPOs in the sector (capital is high), the market is receptive. Aside from one mutual conversion shown in Table 3 (CSB Financial), multiple conversions are expected this year.
Lincoln International is a boutique investment bank and is outside the wheelhouse of Bank Watch, but its IPO speaks to the current state of the capital markets.
Forbright, Inc. is the parent company of Chevy Chase, Maryland-based Forbright Bank, whose model entails a digital-focused deposit franchise that funds middle market companies, i.e., somewhat akin to a commercial finance company in a bank wrapper. The company was founded by CEO John Delaney, who founded Healthcare Financial Partners in 1993 (sold to Heller Financial in 1999) and CapitalSource in 2001 (sold to PacWest Bancorp in 2013, now Banc of California). Mr. Delaney also served in the U.S. House of Representatives during 2013-2019.
Underwriters struggled with the IPO for Raleigh-based First Carolina Financial Services, Inc., which priced at $12.50 per share vs a targeted range of $18 to $20 per share. We were not privy to the roadshow dialogue, but suspect investors questioned losses incurred by 2024 FinTech acquisition BM Technologies for $70 million of cash. The company funded the acquisition in part via a private placement of common equity at $35 per share in late 2024.
Table 3 – 2026 Financial Services IPOs
M&A Pace is Slow vs. Expectations
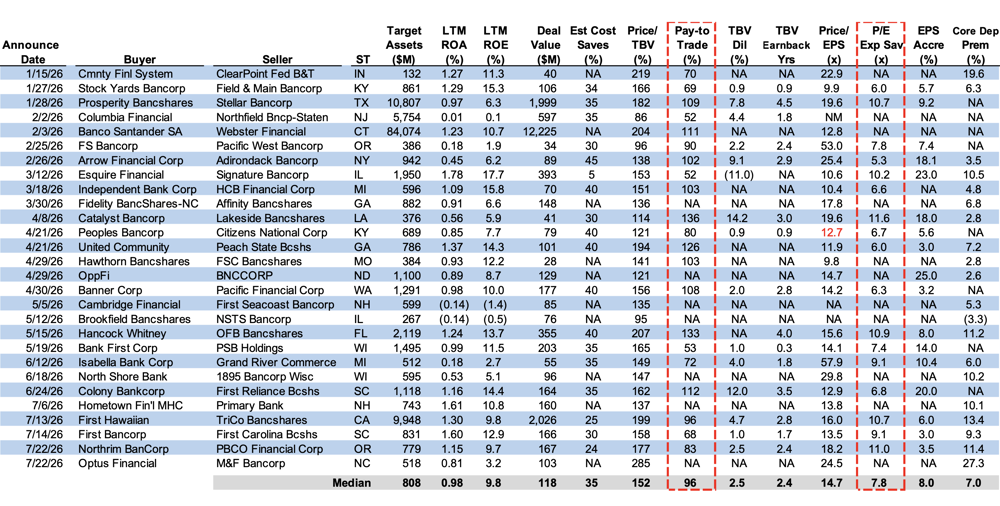
Bank M&A has been slower than expected this year, in part because of the Iran War that began in late February and sort of continues today. As of July 30, there were 96 reported transactions of which 31 have reported pricing. Although it does not quite feel like it, the pace of M&A activity will be comparable to most years as the annualized rate is ~170, or 3.8% of the charters at the beginning of the year.
The median transaction involved an $808 million-asset target and was valued at 152% of tangible book value and 14.7x earnings. Investors are focused on (a) pay-to-trade multiples (seller’s P/TBV multiple relative to the buyer’s pre-announcement P/TBV multiple); (b) day one dilution to TBVPS; and (c) the projected time to recoup the day one dilution to TBVPS given EPS accretion.
As shown in Table 4, the median pay-to-trade TBV multiple of 96% is consistent with recent year’s pricing, while the median 2.4 year earn back is within the Street’s preference of no more than 2 to 3 years.
Also of note is the P/E based on the target’s projected earnings plus after-tax expense saves of 7.8x, which is consistent with the past several years where the majority of synergized P/Es tend to be in a range of 6x to 9x though weak earners may be higher.
Where From Here
Taken together, the public market, earnings, IPO, and M&A data illustrate the positive operating environment of the past 18 months or so once the yield curve became positively sloped with Fed rate cuts. From here, relative performance will depend on the economy performing well, or well enough, credit and the absence of sharp changes in rates that negatively impact NIMs. Plus, many banks continue to repurchase shares given solid capital and profitability that is overlaid with just moderate loan growth.
Table 4 – Bank M&A with Disclosed Pricing