Core Deposits: A Liability That Acts Like an Asset
Before we dive into trends seen in core deposit valuations during 2026, it may be helpful to begin with a brief primer on core deposits.
Recently I was asked to explain why a purchase price allocation performed by Mercer Capital included the time deposits in two different components – the core deposit intangible asset and the mark-to-market adjustment of the time deposit liability. Wasn’t this some form of double counting? We get this question from time to time from both bank executives and auditors. One component of our analysis is a valuation of an intangible asset (the CDI) while the other portion is a mark to market of the deposit liability. Core deposits, including time deposits in some cases, are liabilities that behave like assets. Banking has an interesting contradiction in that some of the most valuable things a bank owns are technically things it owes.
Deposits sit on the liability side of a bank’s balance sheet, but a stable base of checking accounts, savings accounts, and other core deposits can be one of the most valuable components of a banking franchise. Banks compete aggressively for them, acquisitions are often driven in large part by them, and accounting rules require an acquirer to recognize their value as an identifiable intangible asset. That makes core deposits one of the more unusual assets (or liabilities, depending on how you look at them) in finance.
Imagine a customer keeps $10,000 in a noninterest-bearing checking account. The bank owes that customer $10,000, so the account is unquestionably a liability. But the customer is also providing the bank with $10,000 of funding without receiving explicit interest in return. If the alternative source of funding costs the bank 4%, that checking account potentially provides a substantial funding advantage. Multiply that across thousands of customers and hundreds of millions of dollars of deposits, and the economics become meaningful very quickly. This is the fundamental reason a deposit franchise can have value even though deposits themselves are liabilities.
What Makes a Deposit “Core”?
There is no single definition of a core deposit that works in every context. Generally, however, the term refers to deposits that are relatively stable, relationship-oriented, and expected to remain with a financial institution for an extended period. Checking accounts would be the classic example. Savings and money market accounts may also be core deposits, while brokered deposits and other forms of wholesale funding generally are not. The distinction matters because one dollar of deposits isn’t necessarily worth the same as another dollar of deposits. Consider two banks, each with $1 billion of deposits. One has a large base of long-standing checking accounts from local households and businesses. The other relies heavily on rate-sensitive CDs and customers who routinely move their money in search of the highest available yield. The balance sheets may look similar. Economically, the funding franchises can be very different.
Depositors Can Be Remarkably “Sticky” & Deposits Don’t Always Follow Fed Moves
Perhaps the most interesting characteristic of core deposits is how reluctant many customers are to move them. Consumers don’t necessarily behave like perfectly rational rate-shopping machines. A customer might spend considerable time comparing prices before buying a television but leave $50,000 sitting in a savings account earning substantially less than an alternative available elsewhere. Moving a primary banking relationship can mean changing direct deposits, automatic payments, debit cards, online banking credentials, peer-to-peer payment connections, and links to other financial accounts. Businesses may face an even greater burden, particularly if their relationship includes treasury management, merchant services, payroll, or lending. That inconvenience creates something valuable for banks: deposit persistence. It also explains why the value of a deposit relationship can’t be measured simply by looking at today’s interest rate.
One of the most useful concepts for understanding deposits is the deposit beta. A 2025 Federal Reserve staff study of policy cycles since the 1980s found that systemwide deposit betas remained at or below roughly 50% across the cycles examined and were consistently lower than betas on nondeposit funding. If market interest rates increase by 100 basis points and a bank raises a particular deposit rate by only 40 basis points, the deposit’s rate has exhibited a 40% beta over that period. That sounds straightforward, but actual deposit behavior is more complicated. Different account types behave differently.
Commercial customers can behave differently from consumers. Large-balance customers may be more rate sensitive than small-balance customers, and customer behavior can change depending on how long rates have remained elevated and how aggressively competitors are pricing deposits. Financial institutions in rural areas with few local alternatives generally face less pressure to offer competitive deposit rates.
Deposit pricing doesn’t necessarily behave symmetrically. The speed at which banks raise rates when market rates increase does not have to equal the speed at which they lower rates when market rates decline. That creates both opportunities and risks for banks managing deposit costs through an interest-rate cycle.
Small-Balance Checking Accounts: Tiny but Mighty
Another quirk of deposit economics is that today’s account balance may not tell you much about the value of the customer relationship. A household might keep only $3,000 in its checking account but also have a mortgage, savings account, credit card, and future borrowing needs with the same institution. A business checking account might carry a relatively modest average balance but be connected to merchant processing, treasury management, a revolving credit facility, owner accounts, and employee relationships. In other words, the account is sometimes less important than the relationship attached to it.
This is one reason banks place so much emphasis on acquiring the customer’s primary transaction account. Once a bank becomes the center of a customer’s financial life, the relationship can be difficult for a competitor to dislodge.
Assigning a Value to Core Deposits
In a business combination, the acquirer will likely recognize a core deposit intangible, or CDI, representing the value of acquired deposit relationships. At its heart, CDI valuation asks a relatively intuitive question: How valuable is it to inherit this stable deposit funding rather than having to obtain alternative funding elsewhere?
The analysis generally considers the expected life and runoff characteristics of the acquired deposits, their interest and servicing costs, the cost of alternative funding, and other relevant economic assumptions. The resulting CDI is recorded separately from goodwill and amortized over its estimated useful life. Importantly, the CDI is not simply a percentage applied mechanically to deposits. Two institutions with identical deposit balances can have very different CDI values because their deposit composition, pricing, customer behavior, and expected runoff differ.
Core Deposits vs. CDI vs. Deposit Premiums
For additional clarification, core deposits, core deposit intangible assets, and deposit premiums are distinct concepts. Core deposit intangible assets are related to, but not identical to, deposit premiums paid in acquisitions. While a CDI is an intangible asset recorded in an acquisition to capture the value of the customer relationships represented by the deposits, the deposit premium is a function of the acquisition’s purchase price. Deposit premiums in whole bank acquisitions are computed based on the excess of the purchase price over the target’s tangible book value, as a percentage of the core deposit base.
While deposit premiums often capture the value to the acquirer of assuming the established funding source of the core deposit base (that is, the value of the deposit franchise), the purchase price also reflects factors unrelated to the deposit base, such as the quality of the acquired loan portfolio or unique synergy opportunities anticipated by the acquirer.
2026 Trends in Core Deposit Intangibles
Since Mercer Capital published its 2025 Core Deposit Intangibles Update, bank acquisition activity has continued to improve. Industry data indicate that 86 U.S. bank transactions were announced during the first half of 2026, compared with 78 during the same period of 2025. A more accommodating regulatory environment and shorter approval timelines have contributed to the improvement in deal activity. Funding pressures also remain more manageable than at their 2023 peak, although the expected rise in market interest rates during 2026 may slow (or partially reverse) the decline in mark-to-market adjustments on loans and securities. Recent transaction announcements suggest that CDI values have remained resilient and, in some cases, moved higher as the interest-rate outlook has shifted.
While many factors are relevant to analyzing a deposit base, market interest rates remain a significant driver of value. All else equal, higher market rates increase the value of low-cost core deposits by widening the difference between the cost of those deposits and the cost of alternative funding. The reverse generally occurs when market rates decline.
On September 16, the FOMC voted unanimously to raise the target range by 25 basis points to 3.75% to 4.00% in response to inflation concerns. This marks the first upward adjustment since July 2023. The increase generally supports the value of stable, low-cost deposits because comparable wholesale and market-based funding becomes more expensive. The benefit is not automatic, however. Higher rates may also increase deposit betas, encourage customers to migrate into higher-yielding products, accelerate runoff, and raise valuation discount rates. Accordingly, the effect on a particular CDI valuation will depend on how slowly the institution’s deposit costs reprice and how successfully it retains customer balances. Because the September increase was largely anticipated by financial markets, its immediate effect may be modest, but a sustained higher-rate environment would provide more meaningful support for CDI values.
As shown below in Figure 1, the Treasury yield curve has shifted materially upward from one year ago across most maturities beyond the very short end of the curve. Based on the latest data available before the September FOMC announcement, the one-year Treasury yield increased from 3.62% on September 16, 2025, to 4.39% on September 15, 2026. Over the same period, the five-year yield increased from 3.59% to 4.83%, while the ten-year yield increased from 4.04% to 5.00%.
Figure 1 :: U.S. Treasury Yield Curve
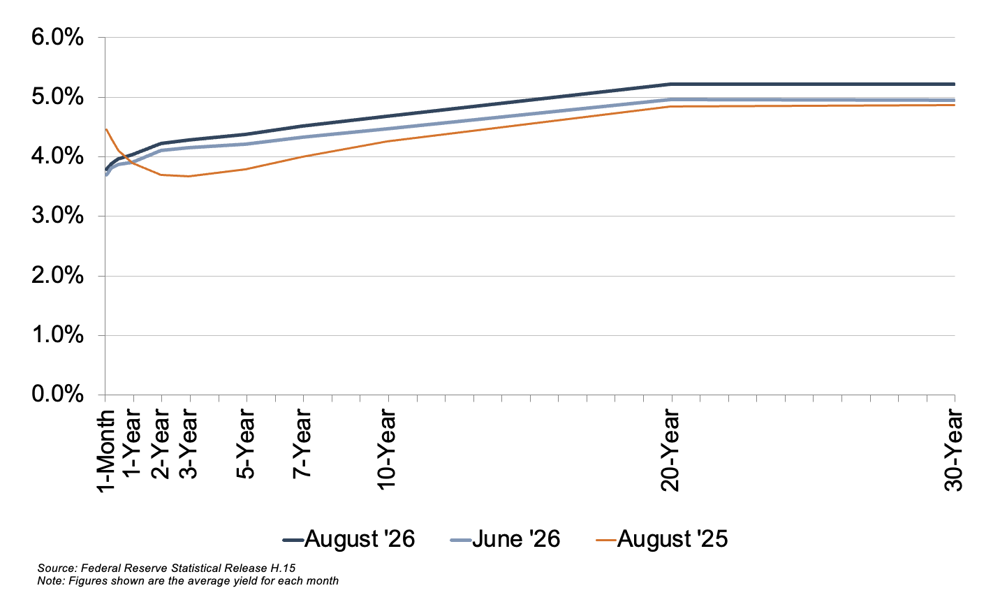
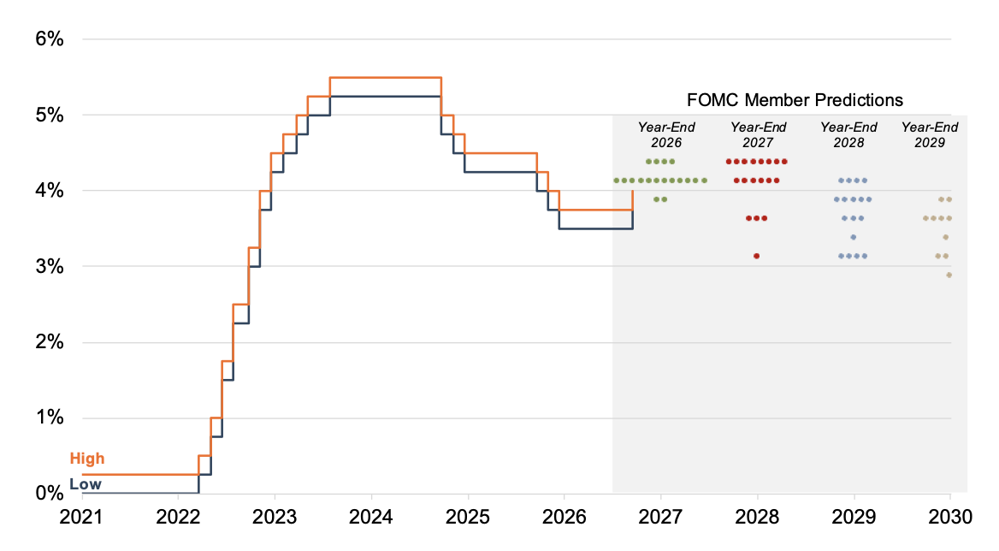
The Federal Reserve’s updated “dot plot,” presented in Figure 2, also reflects a marked change from last year’s easing expectations. The median FOMC participant now projects a federal funds rate of 4.1% at year-end 2026 and year-end 2027, followed by 3.9% in 2028 and 3.6% in 2029. The 2026 median is consistent with one additional 25-basis-point increase before year-end, while the projections suggest that policymakers do not anticipate an immediate return to rate cuts. Although the individual projections continue to exhibit considerable dispersion, particularly for 2028 and beyond, the outlook has shifted from steadily declining short-term rates toward a higher-for-longer environment.
Figure 2 :: Federal Reserve Dot Plot
Trends In CDI Values
Using data compiled by S&P Capital IQ Pro, we analyzed trends in core deposit intangible (CDI) assets recorded in whole bank acquisitions completed from 2000 through mid-September 2026. For our analysis of industry trends in CDI values, we relied on S&P Capital IQ Pro’s definition of core deposits. In analyzing core deposit intangible assets for individual acquisitions, however, a more detailed analysis of the deposit base would consider the relative stability of various account types. In general, CDI assets derive most of their value from lower-cost demand deposit accounts, while more rate-sensitive time deposits and public funds often receive significantly less, if any, value. Non-retail funding sources such as listing service or brokered deposits are excluded from core deposits when determining the value of a CDI.
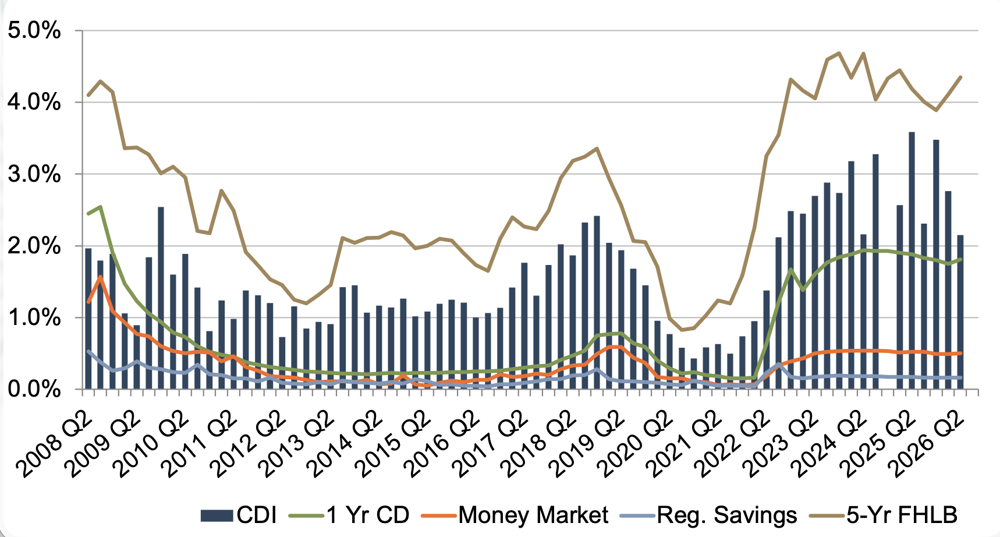
Figure 3 summarizes the trend in CDI values since the beginning of the 2008 recession, compared with rates on 5-year FHLB advances. Over the post-recession period, CDI values have largely followed the general trend in interest rates. As alternative funding became more costly in 2017 and 2018, CDI values generally ticked up as well, relative to post-recession average levels. Throughout 2019, CDI values exhibited a declining trend in light of yield curve inversion and Fed cuts to the target federal funds rate during the back half of 2019. This trend accelerated in March 2020 when rates were effectively cut to zero.
CDI values in 2026 averaged 2.48% through mid-September 2026, materially unchanged from 2.47% through the same point in 2025. Excluding one 2025 and one 2026 transaction with unusually low CDI ratios, the averages for both year-to-date periods were approximately 2.6%. This compares to averages of 2.79% for all of 2025, 2.73% in 2024, 2.58% in 2023, 1.60% in 2022, and 0.63% in 2021. These recent values remain well above the post-recession average of approximately 1.53% and are closer to the longer-term levels of approximately 2.5% to 3.0% observed during the early 2000s.
Figure 3 :: CDI as % of Acquired Core Deposits
Source: S&P Global Market Intelligence Cap IQ Pro
As shown in Figure 3, reported CDI values have fluctuated along with the general trend in FHLB rates. However, the averages should be interpreted cautiously. The chart is provided to illustrate the general direction of CDI values rather than to predict specific indications of value, due to the following factors:
The Federal Reserve’s September 16, 2026 rate increase is not reflected in the data above. The FOMC raised the target federal funds rate by 25 basis points to a range of 3.75% to 4.00%. The accompanying projections also shifted upward, with the median participant forecast for the federal funds rate at year-end 2026 increasing to 4.1% from 3.8% in the June projections. Although one 25-basis-point increase may not materially affect CDI values, particularly because valuations consider the expected path of funding costs over time, a sustained increase in market rates or an upward shift in the yield curve generally would increase the relative value of stable, low-cost deposits. The benefit could be moderated, however, if banks must raise deposit rates materially to retain their customers.
Most of the values presented above represent estimated CDI values disclosed at deal announcement rather than final values determined through the post-closing purchase price allocation process. Announcement-date estimates may differ from final purchase-accounting values because rates, deposit balances, pricing, runoff expectations, and the alternative funding curve can change between announcement and closing.
The number of transactions with disclosed CDI estimates also remains relatively limited and varies considerably by period, with no available observations in certain quarters. Consequently, individual transactions can have a disproportionate effect on the reported averages.
General market averages do not reflect the individual characteristics of a particular institution’s deposit base. Deposit composition, pricing, customer concentration, account size, historical retention, and the presence of broader customer relationships can produce materially different CDI values among institutions operating in the same interest-rate environment.
Thirty-three deals were announced in July, August, and the first half of September 2026, and investor presentations or earnings calls for 12 of those deals contained CDI estimates. These CDI estimates ranged from 2.0% to 3.0% of core deposits, as defined by the acquirer, with an average of 2.7%. However, the CDI values cited in investor presentations can be difficult to compare, as acquirers may use different definitions of core deposits when calculating the amounts reported to investors. For example, some acquirers may include CDs or public funds accounts in the calculation, while other buyers may exclude or include only certain types of these deposits.
The September rate increase and the upward revision to the FOMC’s rate projections have altered the near-term outlook for CDI values. Higher market rates generally increase the value of core deposits by raising the cost of alternative funding. However, the magnitude and timing of any increase in CDI values will depend on the degree to which acquired deposits reprice and the stability of the underlying customer relationships. Several factors will be particularly important:
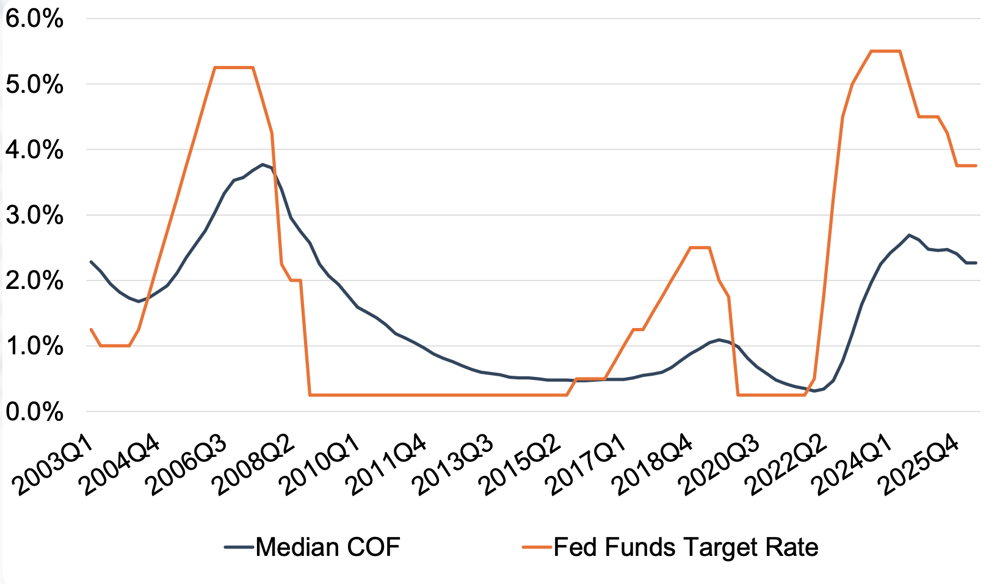
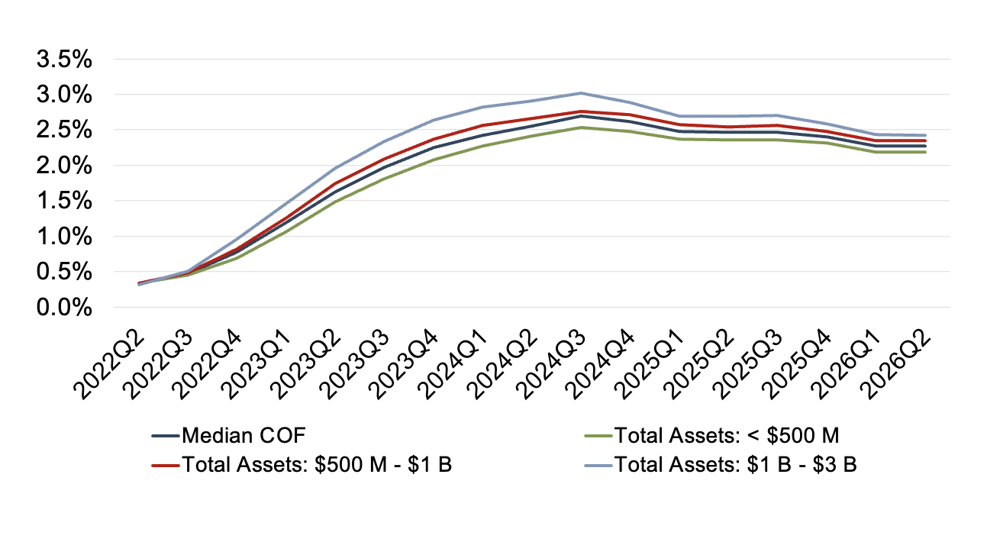
Cost of Funds. During the recent easing cycle, banks generally reduced deposit rates more slowly than the Federal Reserve reduced its target rate, reflecting competitive pressure to preserve deposit balances and the tendency of deposit pricing to lag changes in market rates. The September rate increase introduces the possibility of renewed upward pressure on deposit costs, particularly for money market accounts, larger-balance relationships, and other rate-sensitive funding. The effect on CDI values will depend less on the change in market rates alone than on the resulting spread between the cost of the acquired deposits and the cost of alternative funding. Institutions with significant concentrations of noninterest-bearing and lower-beta deposits may realize a greater valuation benefit from higher rates. Conversely, institutions that must reprice deposits rapidly to prevent runoff may experience a smaller increase in CDI value. As shown in Figures 4 and 5, deposit costs do not move in lockstep with the federal funds rate, and the degree of repricing also varies with institution size and funding composition.
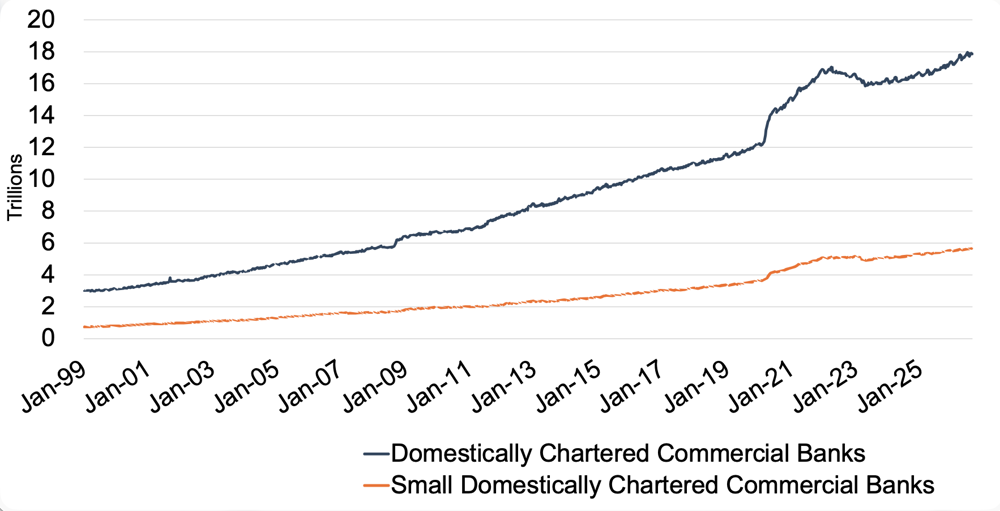
Deposit Levels. After declining in 2022 and 2023, commercial bank deposits returned to growth, increasing 2.8% in 2024 and 3.8% in 2025. Deposit growth accelerated during the first half of 2026, with deposits increasing at seasonally adjusted annual rates of 6.1% in the first quarter and 9.0% in the second quarter. Total deposits reached approximately $19.6 trillion by late August 2026. Bankers generally expect deposit balances to continue growing, although optimism has moderated somewhat. Approximately 79% of respondents to S&P Global Market Intelligence’s first-quarter 2026 U.S. Bank Outlook Survey expected their organizations’ total deposits to increase over the following 12 months, compared with approximately 83% in the preceding survey. All else equal, stronger deposit growth may support lower runoff assumptions and higher indications of CDI value. However, the valuation effect ultimately depends on the composition of that growth, as stable core transaction accounts generally contribute more value than rate-sensitive, brokered, or other wholesale deposits.
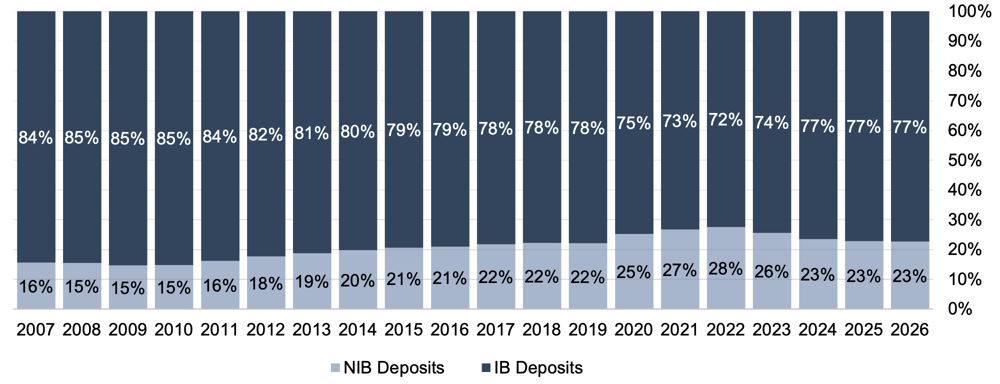
Deposit Mix and Deposit Beta. During the low-rate environment preceding 2022, the nationwide deposit mix shifted toward noninterest-bearing deposits. Higher rates from 2022 through 2025 reversed this trend as customers moved balances into higher-yielding products. Through the second quarter of 2026, the mix had begun to stabilize: noninterest-bearing deposits represented 23% of commercial bank deposits on average for 2024, 2025, and year-to-date 2026. The Federal Reserve’s September rate increase could renew customers’ incentives to seek higher yields. All else equal, noninterest-bearing and lower-beta deposits generate higher CDI values because they provide a greater cost advantage relative to alternative funding. Conversely, migration into rate-sensitive accounts or faster deposit repricing would reduce that advantage.
Uncertain Rate Outlook. The outlook has shifted from declining rates toward a potentially higher-for-longer environment. However, future policy remains dependent on incoming inflation, employment, and economic-growth data. Additional rate increases could support CDI values, while weaker growth or renewed disinflation could reverse that effect.
Additionally, CDI value is based on the spread between deposit costs and the cost of replacement funding over time, not simply the current federal funds rate. Changes in FHLB advance rates, wholesale funding spreads, and the curve’s shape can affect CDI values before deposit costs respond.
Figure 4 :: Median Cost of Funds as Compared to Target Federal Funds Rate
Source: S&P Capital IQ Pro
Figure 5 :: Cost of Funds by Asset Size – 2Q22 to 2Q26
Source: S&P Capital IQ Pro
Figure 6 :: Total Industry Deposits Per Federal Reserve H.8 Release
Source: Federal Reserve H.8
Figure 7:: Deposit Mix Over Time
Source: S&P Capital IQ Pro
Trends In Deposit Premiums Relative To CDI Asset Values
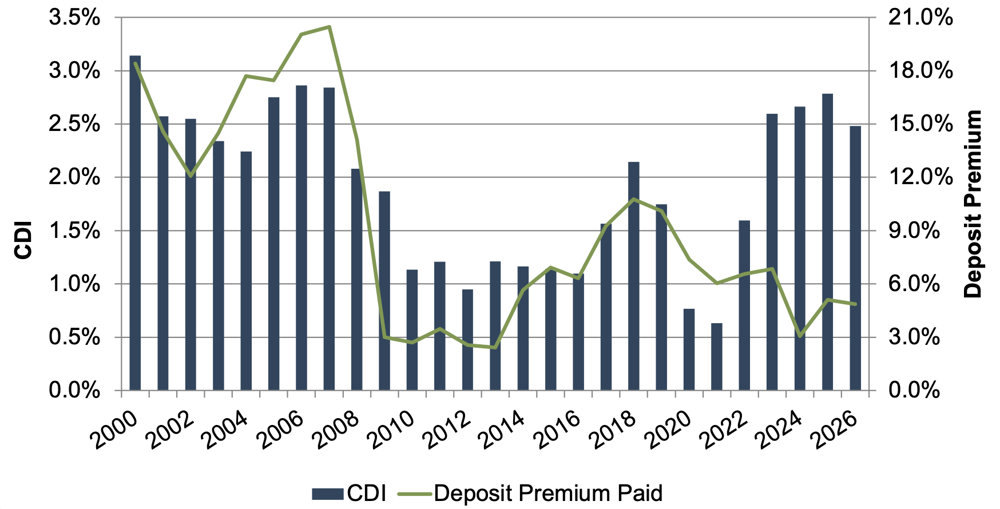
As shown in Figure 8, deposit premiums paid in whole bank acquisitions have shown more volatility than CDI values. Deposit premiums ranged from 6% to 10% from 2015 to 2023, well below the pre-Great Recession levels when premiums for whole bank acquisitions averaged closer to 20%. Net interest margin pressure—caused by assets originated at low rates during the pandemic and deposits that proved more rate sensitive than expected—resulted in deposit premiums in 2024 falling to levels last seen in the Great Financial Crisis. That is, low-cost core deposits proved valuable in 2024, but CDI values in whole-bank transactions were offset by mark-to-market adjustments on the asset side of the balance sheet that also resulted from the higher rate environment. Deposit premiums for 2026 have been consistent with 2025 premiums (4.9% and 5.1%, respectively).
Figure 8 :: CDI Recorded vs. Deposit Premiums Paid
Source: S&P Capital IQ Pro
Other factors may influence the purchase price, causing the calculated deposit premium to bear little relationship to the value of the core deposit base to the acquirer. These other factors are often less relevant in branch transactions, where the deposit base is the primary driver and its relationship to the purchase price is more direct. Figure 9 presents deposit premiums paid in whole bank acquisitions as compared to premiums paid in branch transactions.
Deposit premiums paid in branch transactions have generally been less volatile than tangible book value premiums paid in whole bank acquisitions. Only two branch transactions with reported premium data have occurred year-to-date in 2026. For those transactions, the deposit premiums were 5.0% and 7.65%. Three such transactions occurred in 2025, and the reported premiums were within a similar range. The limited number of branch transactions likely reflects the strategic value of core deposits. With short-term funding costs remaining elevated and competition for deposits continuing, relatively few institutions have been willing to sell stable, low-cost funding relationships.
Figure 9 :: Average Deposit Premiums Paid
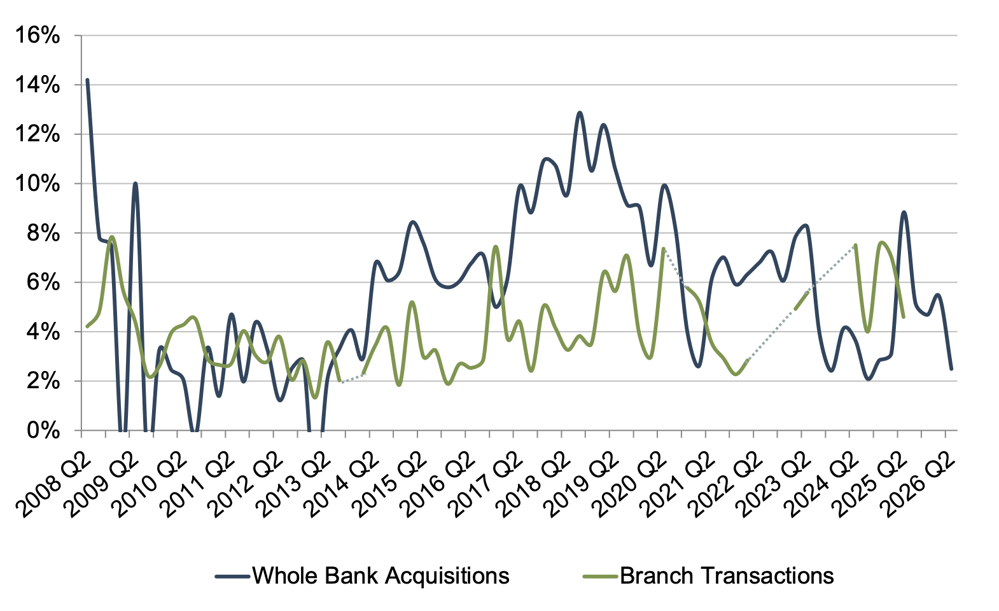
Source: S&P Capital IQ Pro; Dashed lines represent periods where no branch transactions have occurred with disclosed pricing data.
Accounting For CDI Assets
Among acquisitions for which core deposit intangible details were reported, a majority of banks selected a ten-year amortization term for the booked CDI values. Amortization terms longer than ten years were selected in less than 10% of the transactions for which data were available. Amortization methods were somewhat more varied, but an accelerated method, including the sum-of-the-years’ digits method, was selected in approximately two-thirds of these transactions.
Mercer Capital has deep experience analyzing CDI values and advising financial institutions in transactions and strategic decisions. Contact us to discuss how we can help your organization navigate these trends.